
 Submit Manuscript
 Peer Review
 Editor Work
- Home
- Articles & Issues
-
Data
- Dataset of Radar Detecting Sea
- SAR Dataset
- SARGroundObjectsTypes
- SARMV3D
- AIRSAT Constellation SAR Land Cover Classification Dataset
- 3DRIED
- UWB-HA4D
- LLS-LFMCWR
- FAIR-CSAR
- MSAR
- SDD-SAR
- FUSAR
- SpaceborneSAR3Dimaging
- Sea-land Segmentation
- SAR Multi-domain Ship Detection Dataset
- SAR-Airport
- Hilly and mountainous farmland time-series SAR and ground quadrat dataset
- SAR images for interference detection and suppression
- HP-SAR Evaluation & Analytical Dataset
- GDHuiYan-ATRNet
- Multi-System Maritime Low Observable Target Dataset
- DatasetinthePaper
- DatasetintheCompetition
- Report
- Course
- About
- Publish
- Editorial Board
- Chinese
| Citation: | BI Hui, JIN Shuang, WANG Xiao, et al. High-resolution high-dimensional imaging of urban building based on GaoFen-3 SAR data[J]. Journal of Radars, 2022, 11(1): 40–51. doi: 10.12000/JR21113

|
High-resolution High-dimensional Imaging of Urban Building Based on GaoFen-3 SAR Data(in English)
DOI: 10.12000/JR21113 CSTR: 32380.14.JR21113
More Information-
Abstract
Conventional Synthetic Aperture Radar (SAR) can only obtain two-dimensional (2-D) azimuth-range images without accurately reflecting the three-Dimensional (3-D) scattering structure information of the targets. However, SAR Tomography (TomoSAR) is a multi-baseline interferometric measurement mode that extends the synthetic aperture principle into the elevation direction, making it possible to recover the true height of the target, thereby achieving 3-D imaging. Moreover, Differential SAR Tomography (D-TomoSAR) extends the synthetic aperture principle into the elevation and time directions simultaneously. Thus, it can obtain the target 3-D scattering structure along with the deformation speed of the observed target. GaoFen-3 (GF-3) is the first C-band multi-polarization 1 m resolution SAR satellite of China. It has several advantages, such as high-resolution, large swath width, and multiple imaging modes, which are crucial to the development of a high-resolution earth observation technology for China. Presently, GF-3 data are mainly used in the image processing field, such as target identification. However, the phase information of the SAR images is not yet fully utilized. Moreover, because of the high-dimensional imaging ability that was overlooked at the beginning of designing the system, existing SAR images acquired by GF-3 have spatial and temporal de-coherence problems. Thus, it is difficult to use the images in further interference series processing. To solve the above problems, this study achieved 3-D and four-Dimensional (4-D) imaging of buildings around Yanqi Lake, in Beijing, based on the data of seven SAR complex images. We obtained the 3-D scattering structure information of buildings and achieved millimeter-level high-precision monitoring of building deformation. The preliminary experimental results demonstrate the application potential of GF-3 SAR data and provide a technical support for the subsequent further application of the GF-3 SAR satellite in urban sensing and monitoring. -

-
References
[1] CURLANDER J C and MCDONOUGH R N. Synthetic Aperture Radar: Systems and Signal Processing[M]. New York: Wiley, 1991.[2] BUDILLON A, JOHNSY A C, and SCHIRINZI G. Contextual information based SAR tomography of urban areas[C]. 2019 Joint Urban Remote Sensing Event (JURSE), Vannes, Italy, 2019: 1–4. doi: 10.1109/JURSE.2019.8809076.[3] REIGBER A, MOREIRA A, and PAPATHANASSIOU K P. First demonstration of airborne SAR tomography using multibaseline L-band data[C]. IEEE 1999 International Geoscience and Remote Sensing Symposium, Hamburg, Germany, 1999: 44–46. doi: 10.1109/IGARSS.1999.773395.[4] REIGBER A and MOREIRA A. First demonstration of airborne SAR tomography using multibaseline L-band data[J]. IEEE Transactions on Geoscience and Remote Sensing, 2000, 38(5): 2142–2152. doi: 10.1109/36.868873[5] FORNARO G and SERAFINO F. Imaging of single and double scatterers in urban areas via SAR tomography[J]. IEEE Transactions on Geoscience and Remote Sensing, 2006, 44(12): 3497–3505. doi: 10.1109/TGRS.2006.881748[6] REALE D, FORNARO G, PAUCIULLO A, et al. Tomographic imaging and monitoring of buildings with very high resolution SAR data[J]. IEEE Geoscience and Remote Sensing Letters, 2011, 8(4): 661–665. doi: 10.1109/LGRS.2010.2098845[7] SHAHZAD M and ZHU Xiaoxiang. Reconstruction of building façades using spaceborne multiview TomoSAR point clouds[C]. 2013 IEEE International Geoscience and Remote Sensing Symposium - IGARSS, Melbourne, Australia, 2013: 624–627. doi: 10.1109/IGARSS.2013.6721234.[8] WANG Xiao, XU Feng, and JIN Yaqiu. The iterative reweighted alternating direction method of multipliers for separating structural layovers in SAR tomography[J]. IEEE Geoscience and Remote Sensing Letters, 2017, 14(11): 1883–1887. doi: 10.1109/LGRS.2017.2694825[9] WANG Yuanyuan and ZHU Xiaoxiang. Robust nonlinear blind SAR tomography in urban areas[C]. 12th European Conference on Synthetic Aperture Radar, Aachen, Germany, 2018: 1–6.[10] 秦斐, 梁兴东, 张福博, 等. 基于机器学习的阵列层析SAR建筑物目标提取方法[J]. 信号处理, 2019, 35(2): 176–186. doi: 10.16798/j.issn.1003-0530.2019.02.003QIN Fei, LIANG Xingdong, ZHANG Fubo, et al. Building target extraction methods in array SAR tomography based on machine learning[J]. Journal of Signal Processing, 2019, 35(2): 176–186. doi: 10.16798/j.issn.1003-0530.2019.02.003[11] LOMBARDINI F. Differential tomography: A new framework for SAR interferometry[C]. IGARSS 2003. 2003 IEEE International Geoscience and Remote Sensing Symposium, Toulouse, French, 2003: 1206–1208. doi: 10.1109/IGARSS.2003.1294059.[12] FORNARO G, PAUCIULLO A, and SERAFINO F. Multipass SAR processing for urbanized areas imaging and deformation monitoring at small and large scales[C]. 2007 Urban Remote Sensing Joint Event, Paris, 2007: 1–7. doi: 10.1109/URS.2007.371879.[13] FORNARO G, REALE D, and SERAFINO F. 4D SAR focusing: A tool for improved imaging and monitoring of urban areas[C]. IGARSS 2008 - 2008 IEEE International Geoscience and Remote Sensing Symposium, Boston, USA, 2008: V-475–V-478. doi: 10.1109/IGARSS.2008.4780132.[14] ZHU Xiaoxiang, ADAM N, and BAMLER R. Space-borne high resolution tomographic interferometry[C]. 2009 IEEE International Geoscience and Remote Sensing Symposium, Cape Town, South Africa, 2009: IV-869–IV-872. doi: 10.1109/IGARSS.2009.5417515.[15] FORNARO G, SERAFINO F, and REALE D. 4-D SAR imaging: The case study of Rome[J]. IEEE Geoscience and Remote Sensing Letters, 2010, 7(2): 236–240. doi: 10.1109/LGRS.2009.2032133[16] ZHU Xiaoxiang and BAMLER R. Let’s do the time warp: Multicomponent nonlinear motion estimation in differential SAR tomography[J]. IEEE Geoscience and Remote Sensing Letters, 2011, 8(4): 735–739. doi: 10.1109/LGRS.2010.2103298[17] SIDDIQUE M A, HAJNSEK I, AERSOSPACE G, et al. Investigating the combined use of differential SAR tomography and PSI for spatio-temporal inversion[C]. 2015 Joint Urban Remote Sensing Event (JURSE), Lausanne, Swiss, 2015: 1–4. doi: 10.1109/JURSE.2015.7120504.[18] WANG Zhigui and LIU Mei. Seasonal deformation and accelerated motion of infrastructure monitoring using a generalized differential SAR tomography[J]. IEEE Geoscience and Remote Sensing Letters, 2020, 17(4): 626–630. doi: 10.1109/LGRS.2019.2917324[19] CANDÈS E J. Compressive sampling[C]. The International Congress of Mathematicians, Madrid, Spain, 2006: 1433–1452.[20] DONOHO D L. Compressed sensing[J]. IEEE Transactions on Information Theory, 2006, 52(4): 1289–1306. doi: 10.1109/TIT.2006.871582[21] CANDÈS E J, ROMBERG J K, and TAO T. Stable signal recovery from incomplete and inaccurate measurements[J]. Communications on Pure and Applied Mathematics, 2006, 59(8): 1207–1223. doi: 10.1002/cpa.20124[22] ZHU Xiaoxiang and BAMLER R. Tomographic SAR inversion by L1-Norm regularization—The compressive sensing approach[J]. IEEE Transactions on Geoscience and Remote Sensing, 2010, 48(10): 3839–3846. doi: 10.1109/TGRS.2010.2048117[23] ZHU Xiaoxiang and BAMLER R. Super-resolution of sparse reconstruction for tomographic SAR imaging-demonstration with real data[C]. EUSAR 2012; 9th European Conference on Synthetic Aperture Radar, Nuremberg, USA, 2012: 215–218.[24] WEISS M, FORNARO G, and REALE D. Multi scatterer detection within tomographic SAR using a compressive sensing approach[C]. 2015 3rd International Workshop on Compressed Sensing Theory and its Applications to Radar, Sonar and Remote Sensing (CoSeRa), Pisa, 2015: 11–15. doi: 10.1109/CoSeRa.2015.7330254.[25] LI Xinwu, PENG Xing, and LIANG Lei. Sparse reconstruction-based SAR tomography and it’s application[C]. 2017 IEEE International Conference on Imaging Systems and Techniques (IST), Beijing, China, 2017: 1–5. doi: 10.1109/IST.2017.8261514.[26] ZHU Xiaoxiang and BAMLER R. Super-resolution for 4-D SAR tomography via compressive sensing[C]. 8th European Conference on Synthetic Aperture Radar, Aachen, Germany, 2010: 1–4.[27] ZHU Xiaoxiang and BAMLER R. Compressive sensing for high resolution differential SAR tomography - the SL1MMER algorithm[C]. 2010 IEEE International Geoscience and Remote Sensing Symposium, Honolulu, USA, 2010: 17–20. doi: 10.1109/IGARSS.2010.5654021.[28] LENG Ying, LI Fei, SHAO Yunfeng, et al. Elevation and deformation estimation based on TomoSAR[C]. EUSAR 2014; 10th European Conference on Synthetic Aperture Radar, Berlin, Germany, 2014: 1–4.[29] 姚天宇. 长征四号丙运载火箭成功发射高分三号卫星[J]. 中国航天, 2016(8): 8.YAO Tianyu. The Long March 4C carrier rocket successfully launched the GaoFen-3 satellite[J]. Aerospace China, 2016(8): 8.[30] 张庆君. 高分三号卫星总体设计与关键技术[J]. 测绘学报, 2017, 46(3): 269–277. doi: 10.11947/j.AGCS.2017.20170049ZHANG Qingjun. System design and key technologies of the GF-3 satellite[J]. Acta Geodaetica et Cartographica Sinica, 2017, 46(3): 269–277. doi: 10.11947/j.AGCS.2017.20170049[31] 李胜阳, 许志辉, 陈子琪, 等. 高分3号卫星影像在黄河洪水监测中的应用[J]. 水利信息化, 2017(5): 22–26, 72.LI Shengyang, XU Zhihui, CHEN Ziqi, et al. Application of GF-3 satellite remote sensing image on Yellow River flood monitoring[J]. Water Resources Informatization, 2017(5): 22–26, 72.[32] 马建威, 孙亚勇, 陈德清, 等. 高分三号卫星在洪涝和滑坡灾害应急监测中的应用[J]. 航天器工程, 2017, 26(6): 161–166. doi: 10.3969/j.issn.1673-8748.2017.06.026MA Jianwei, SUN Yayong, CHEN Deqing, et al. Applications of GF-3 satellite in flood and landslide disasters emergency monitoring[J]. Spacecraft Engineering, 2017, 26(6): 161–166. doi: 10.3969/j.issn.1673-8748.2017.06.026[33] 余博, 李如仁, 陈振炜, 等. 基于高分三号数据的干涉测量研究[J]. 测绘工程, 2019, 28(4): 19–23, 28.YU Bo, LI Ruren, CHEN Zhenwei, et al. Experimental research on interferometry based on GF-3 SAR data[J]. Engineering of Surveying and Mapping, 2019, 28(4): 19–23, 28.[34] 黄震, 赵双明, 常青. 国产高分三号卫星干涉测量试验[J]. 测绘地理信息, 2021, 46(4): 7–11. doi: 10.14188/j.2095-6045.2019083HUANG Zhen, ZHAO Shuangming, and CHANG Qing. Interferometric test using domestic GF-3 satellite[J]. Journal of Geomatics, 2021, 46(4): 7–11. doi: 10.14188/j.2095-6045.2019083[35] FORNARO G, SERAFINO F, and SOLDOVIERI F. Three-dimensional focusing with multipass SAR data[J]. IEEE Transactions on Geoscience and Remote Sensing, 2003, 41(3): 507–517. doi: 10.1109/TGRS.2003.809934[36] ZHU X. High-resolution spaceborne radar tomography[D]. Technische Universität München, 2008.[37] FORNARO G, REALE D, and SERAFINO F. Four-dimensional SAR imaging for height estimation and monitoring of single and double scatterers[J]. IEEE Transactions on Geoscience and Remote Sensing, 2009, 47(1): 224–237. doi: 10.1109/TGRS.2008.2000837[38] PATI Y C, REZAIIFAR R, and KRISHNAPRASAD P S. Orthogonal matching pursuit: Recursive function approximation with applications to wavelet decomposition[C]. 27th Asilomar Conference on Signals, Systems and Computers, Pacific Grove, USA, 1993: 40–44. doi: 10.1109/ACSSC.1993.342465.[39] BI Hui and BI Guoan. Performance analysis of iterative soft thresholding algorithm for L1 regularization based sparse SAR imaging[C]. 2019 IEEE Radar Conference (RadarConf), Boston, USA, 2019: 1–6. doi: 10.1109/RADAR.2019.8835551.[40] 毕辉. 基于稀疏信号处理的SAR/TomoSAR成像方法研究[D]. [博士论文], 中国科学院大学, 2017: 33–41.BI Hui. Research on the imaging method of SAR/TomoSAR based on sparse signal processing[D]. [Ph. D. dissertation], University of Chinese Academy of Sciences, 2007: 33–41.[41] STOICA P and MOSES R. Spectral Analysis of Signals[M]. Upper Sadle River, New Jersey: Pearson Prentice Hall, 2005.[42] CAPON J. High-resolution frequency-wavenumber spectrum analysis[J]. Proceedings of the IEEE, 1969, 57(8): 1408–1418. doi: 10.1109/PROC.1969.7278[43] SCHMIDT R. Multiple emitter location and signal parameter estimation[J]. IEEE Transactions on Antennas and Propagation, 1986, 34(3): 276–280. doi: 10.1109/TAP.1986.1143830[44] STOICA P and NEHORAI A. MUSIC, maximum likelihood, and Cramer-Rao bound: Further results and comparisons[J]. IEEE Transactions on Acoustics,Speech,and Signal Processing, 1990, 38(12): 2140–2150. doi: 10.1109/29.61541 -
Proportional views


- Publishing Ethics
- Journal Insights
- Abstracting & Indexing
- Peer Review Policies
- Guide for Authors
- Conference
- ISSN 2095-283X (Print)ISSN 2097-339X (Online)
- CN 10-1030/TN
- CODEN LXEUAO
About Journal
- Sponsor: China Radio Detection and Ranging Industry Association (CRIA)
- Phone: 010-58887062
- Email:radars@aircas.ac.cn
- Publisher: Leida Xuebao Bianjibu (Editorial office of the Journal of Radars)
Contacts Us

京ICP备20021838号-14
Supported by: Beijing Renhe Information Technology Co. Ltd

Export File
Citation
Format
Content
 DownLoad:


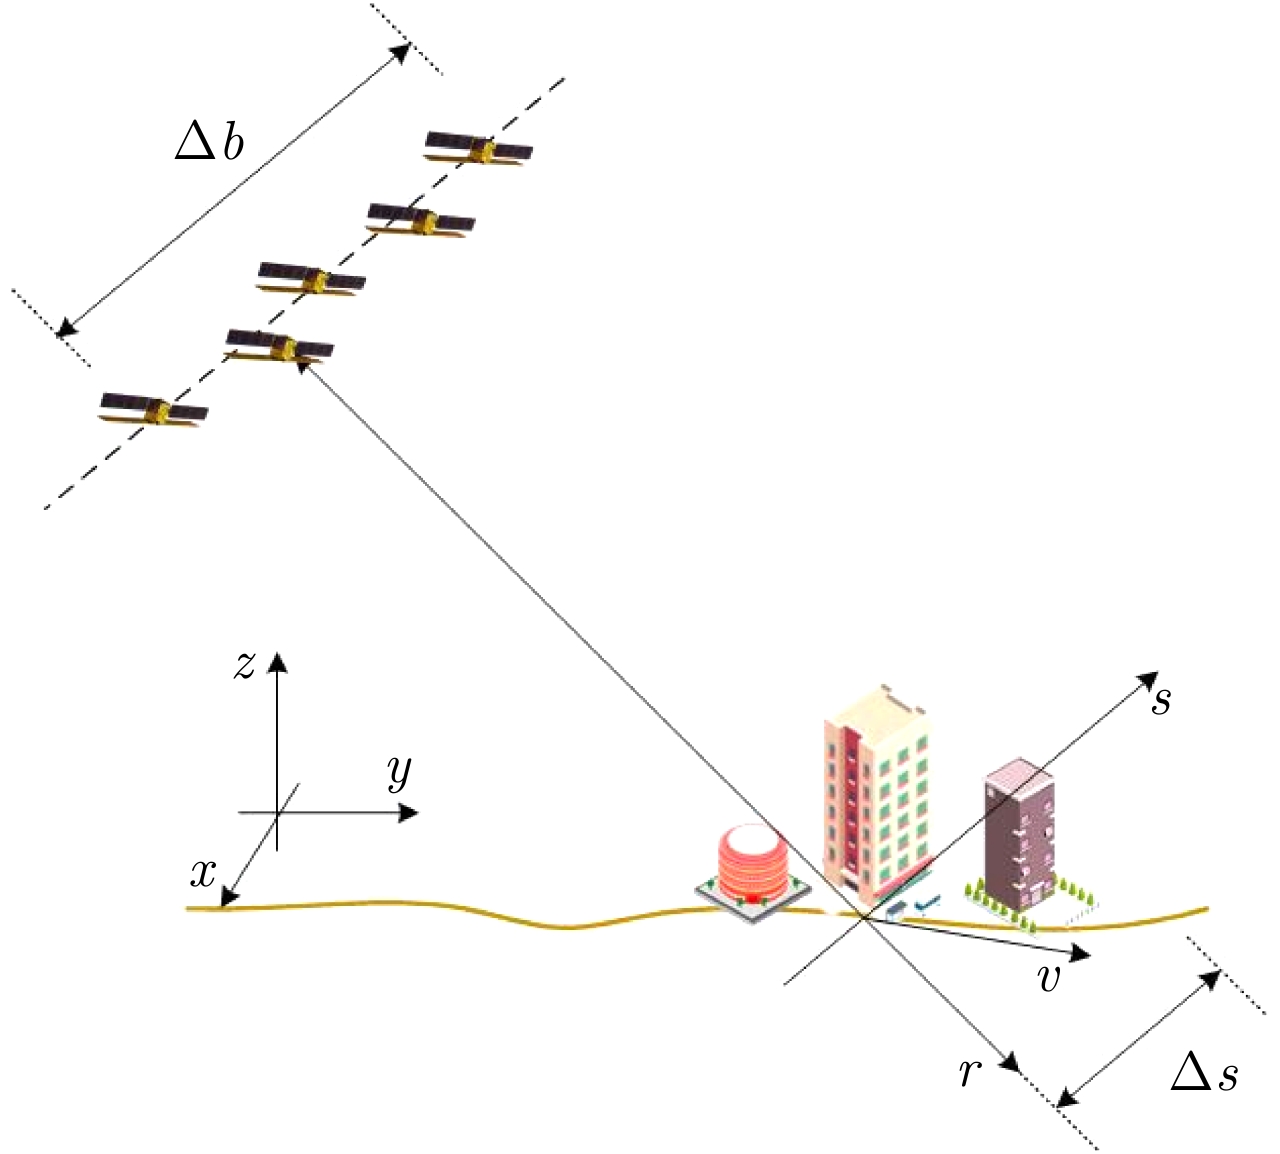


- Figure 1. TomoSAR imaging geometry
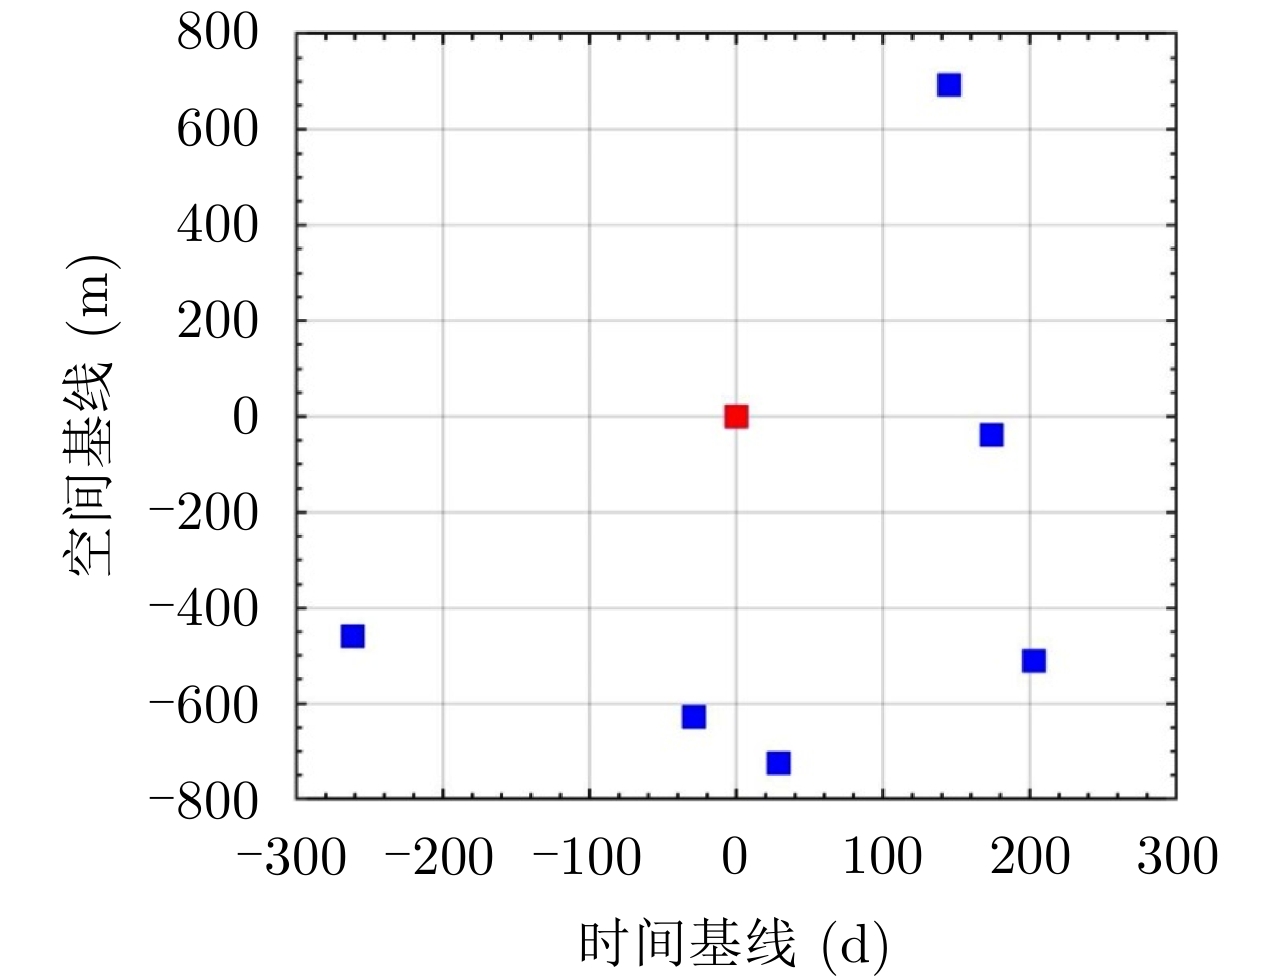
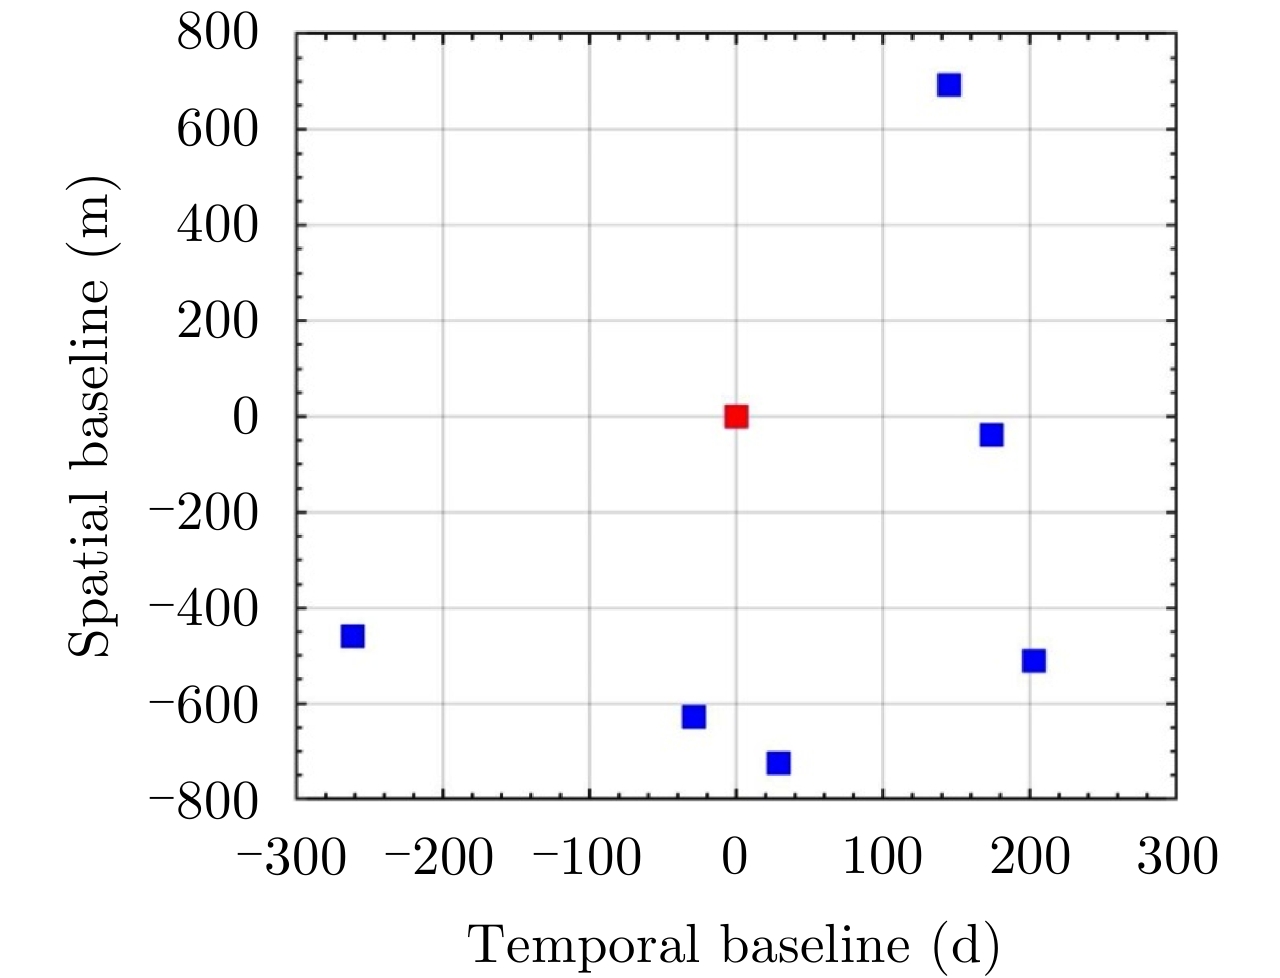
- Figure 2. Spatial-temporal baseline distribution of GF-3 dataset
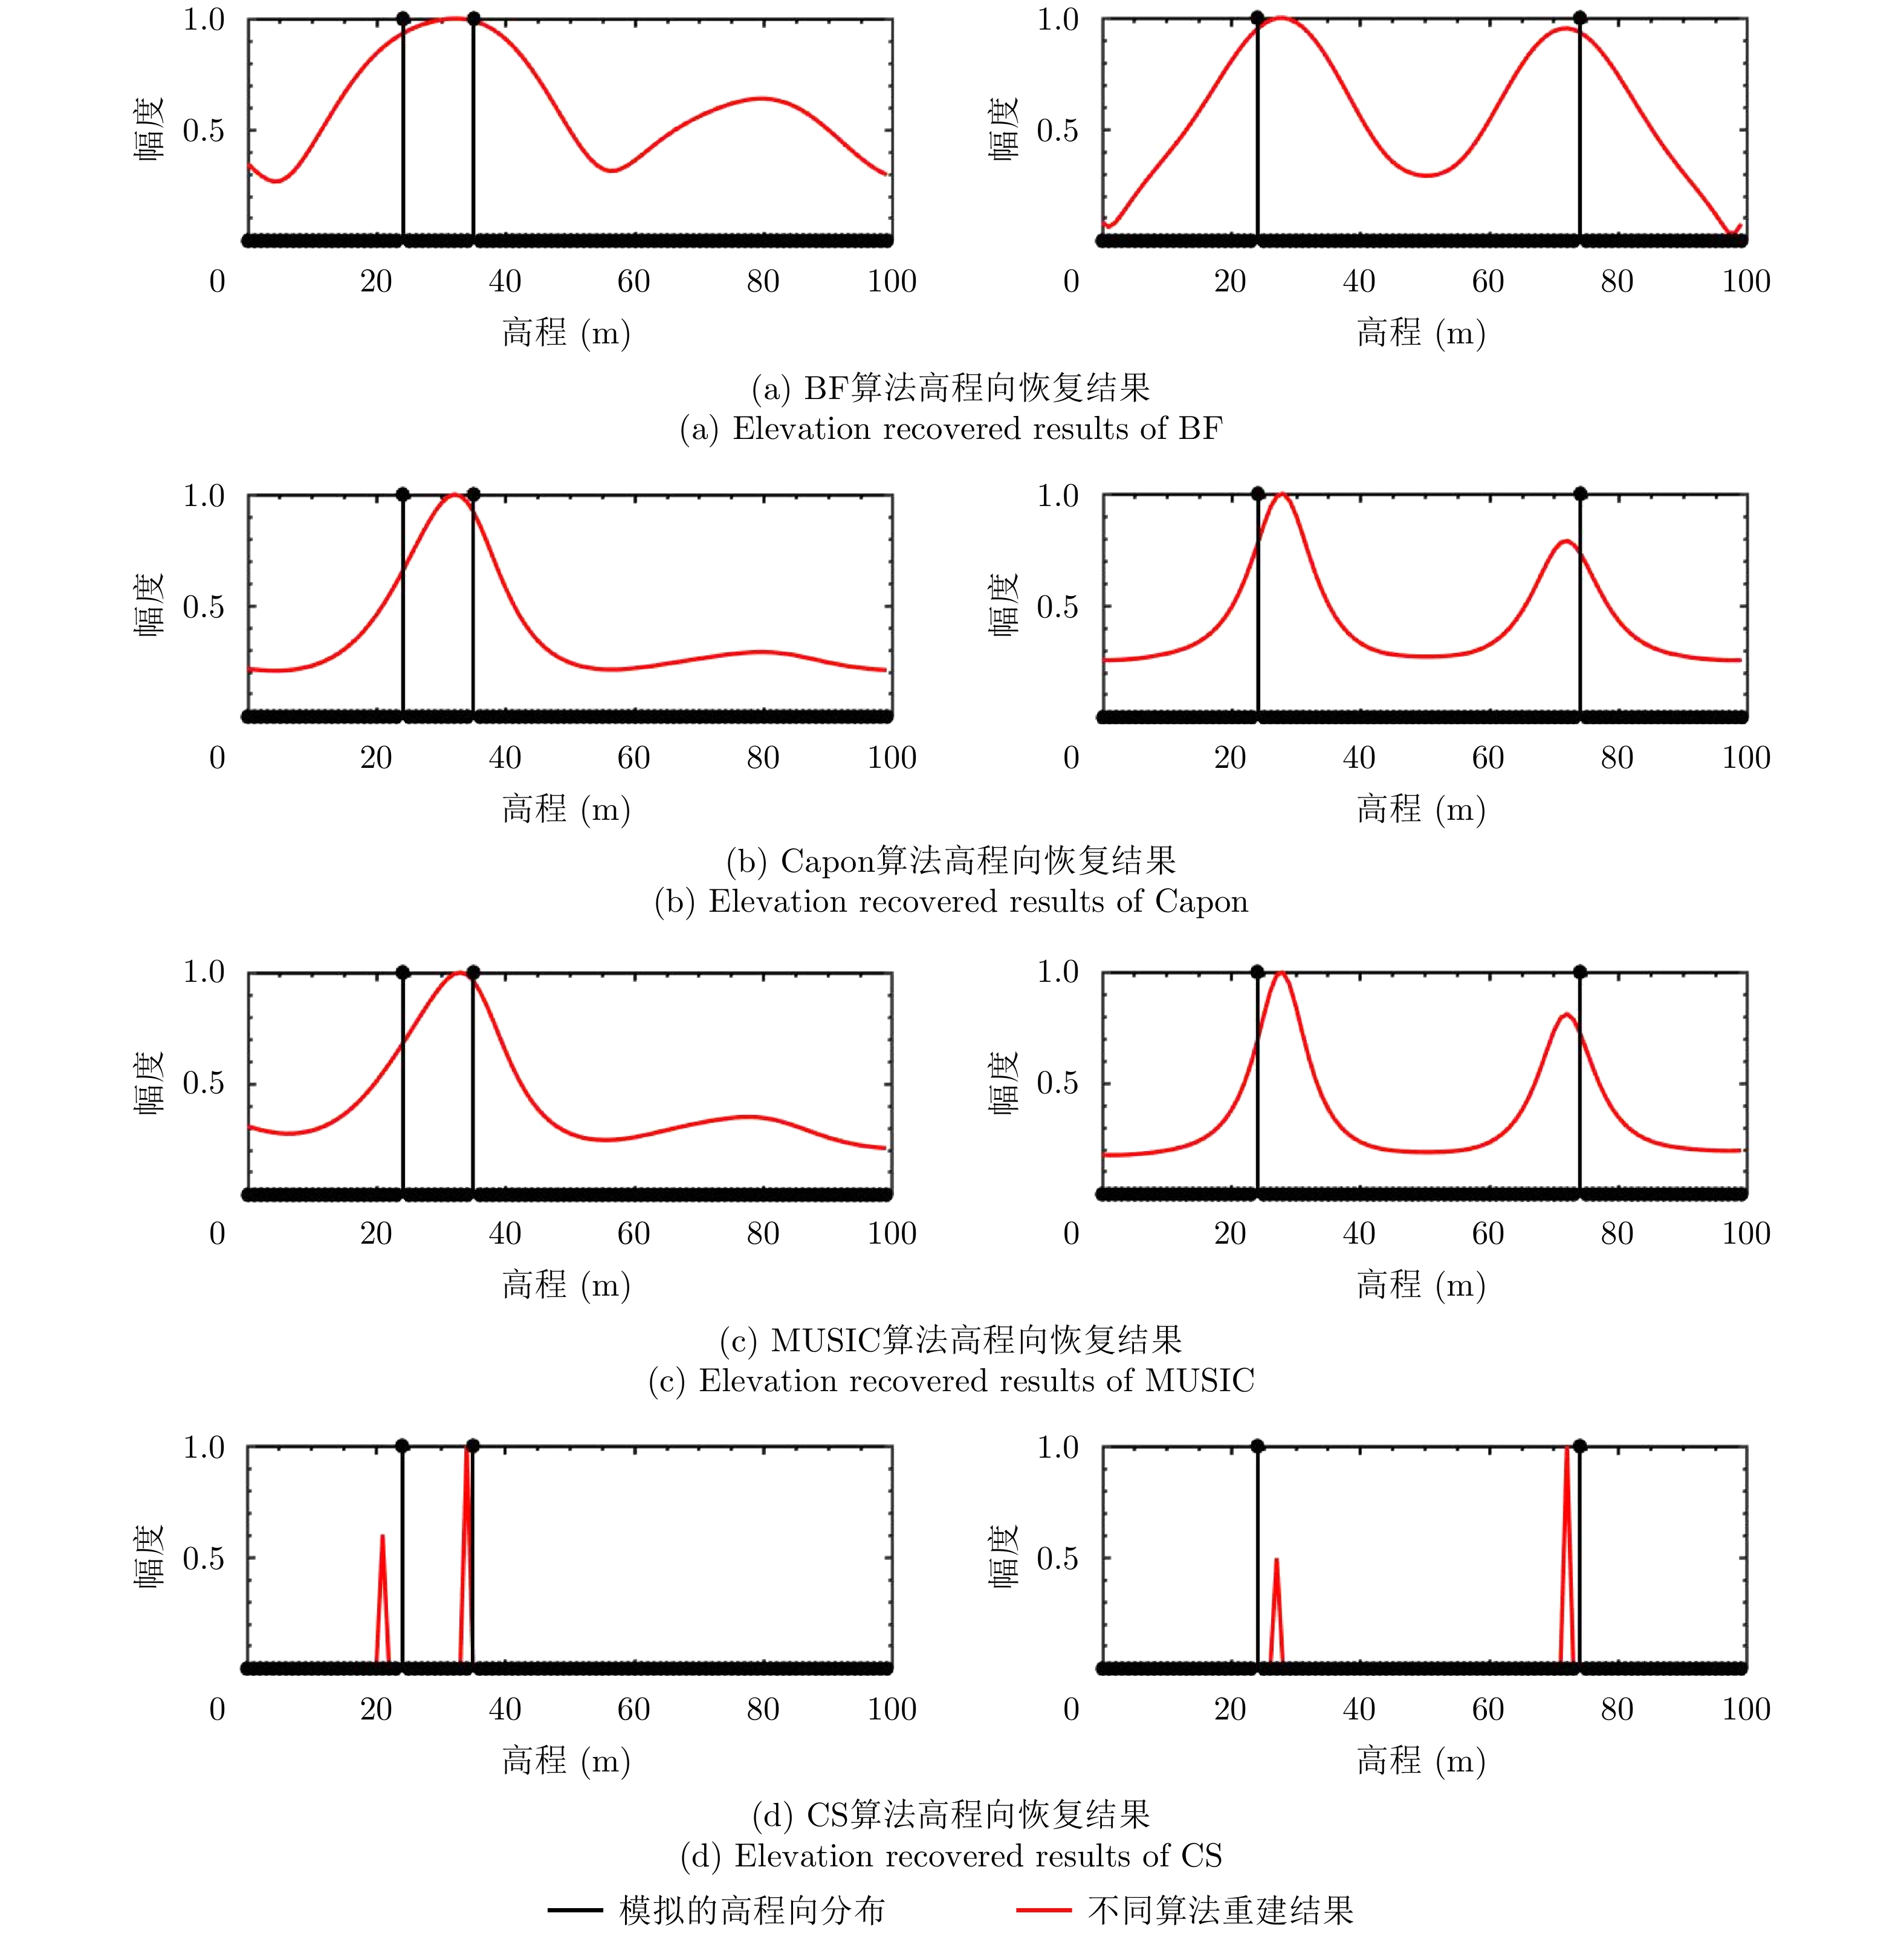
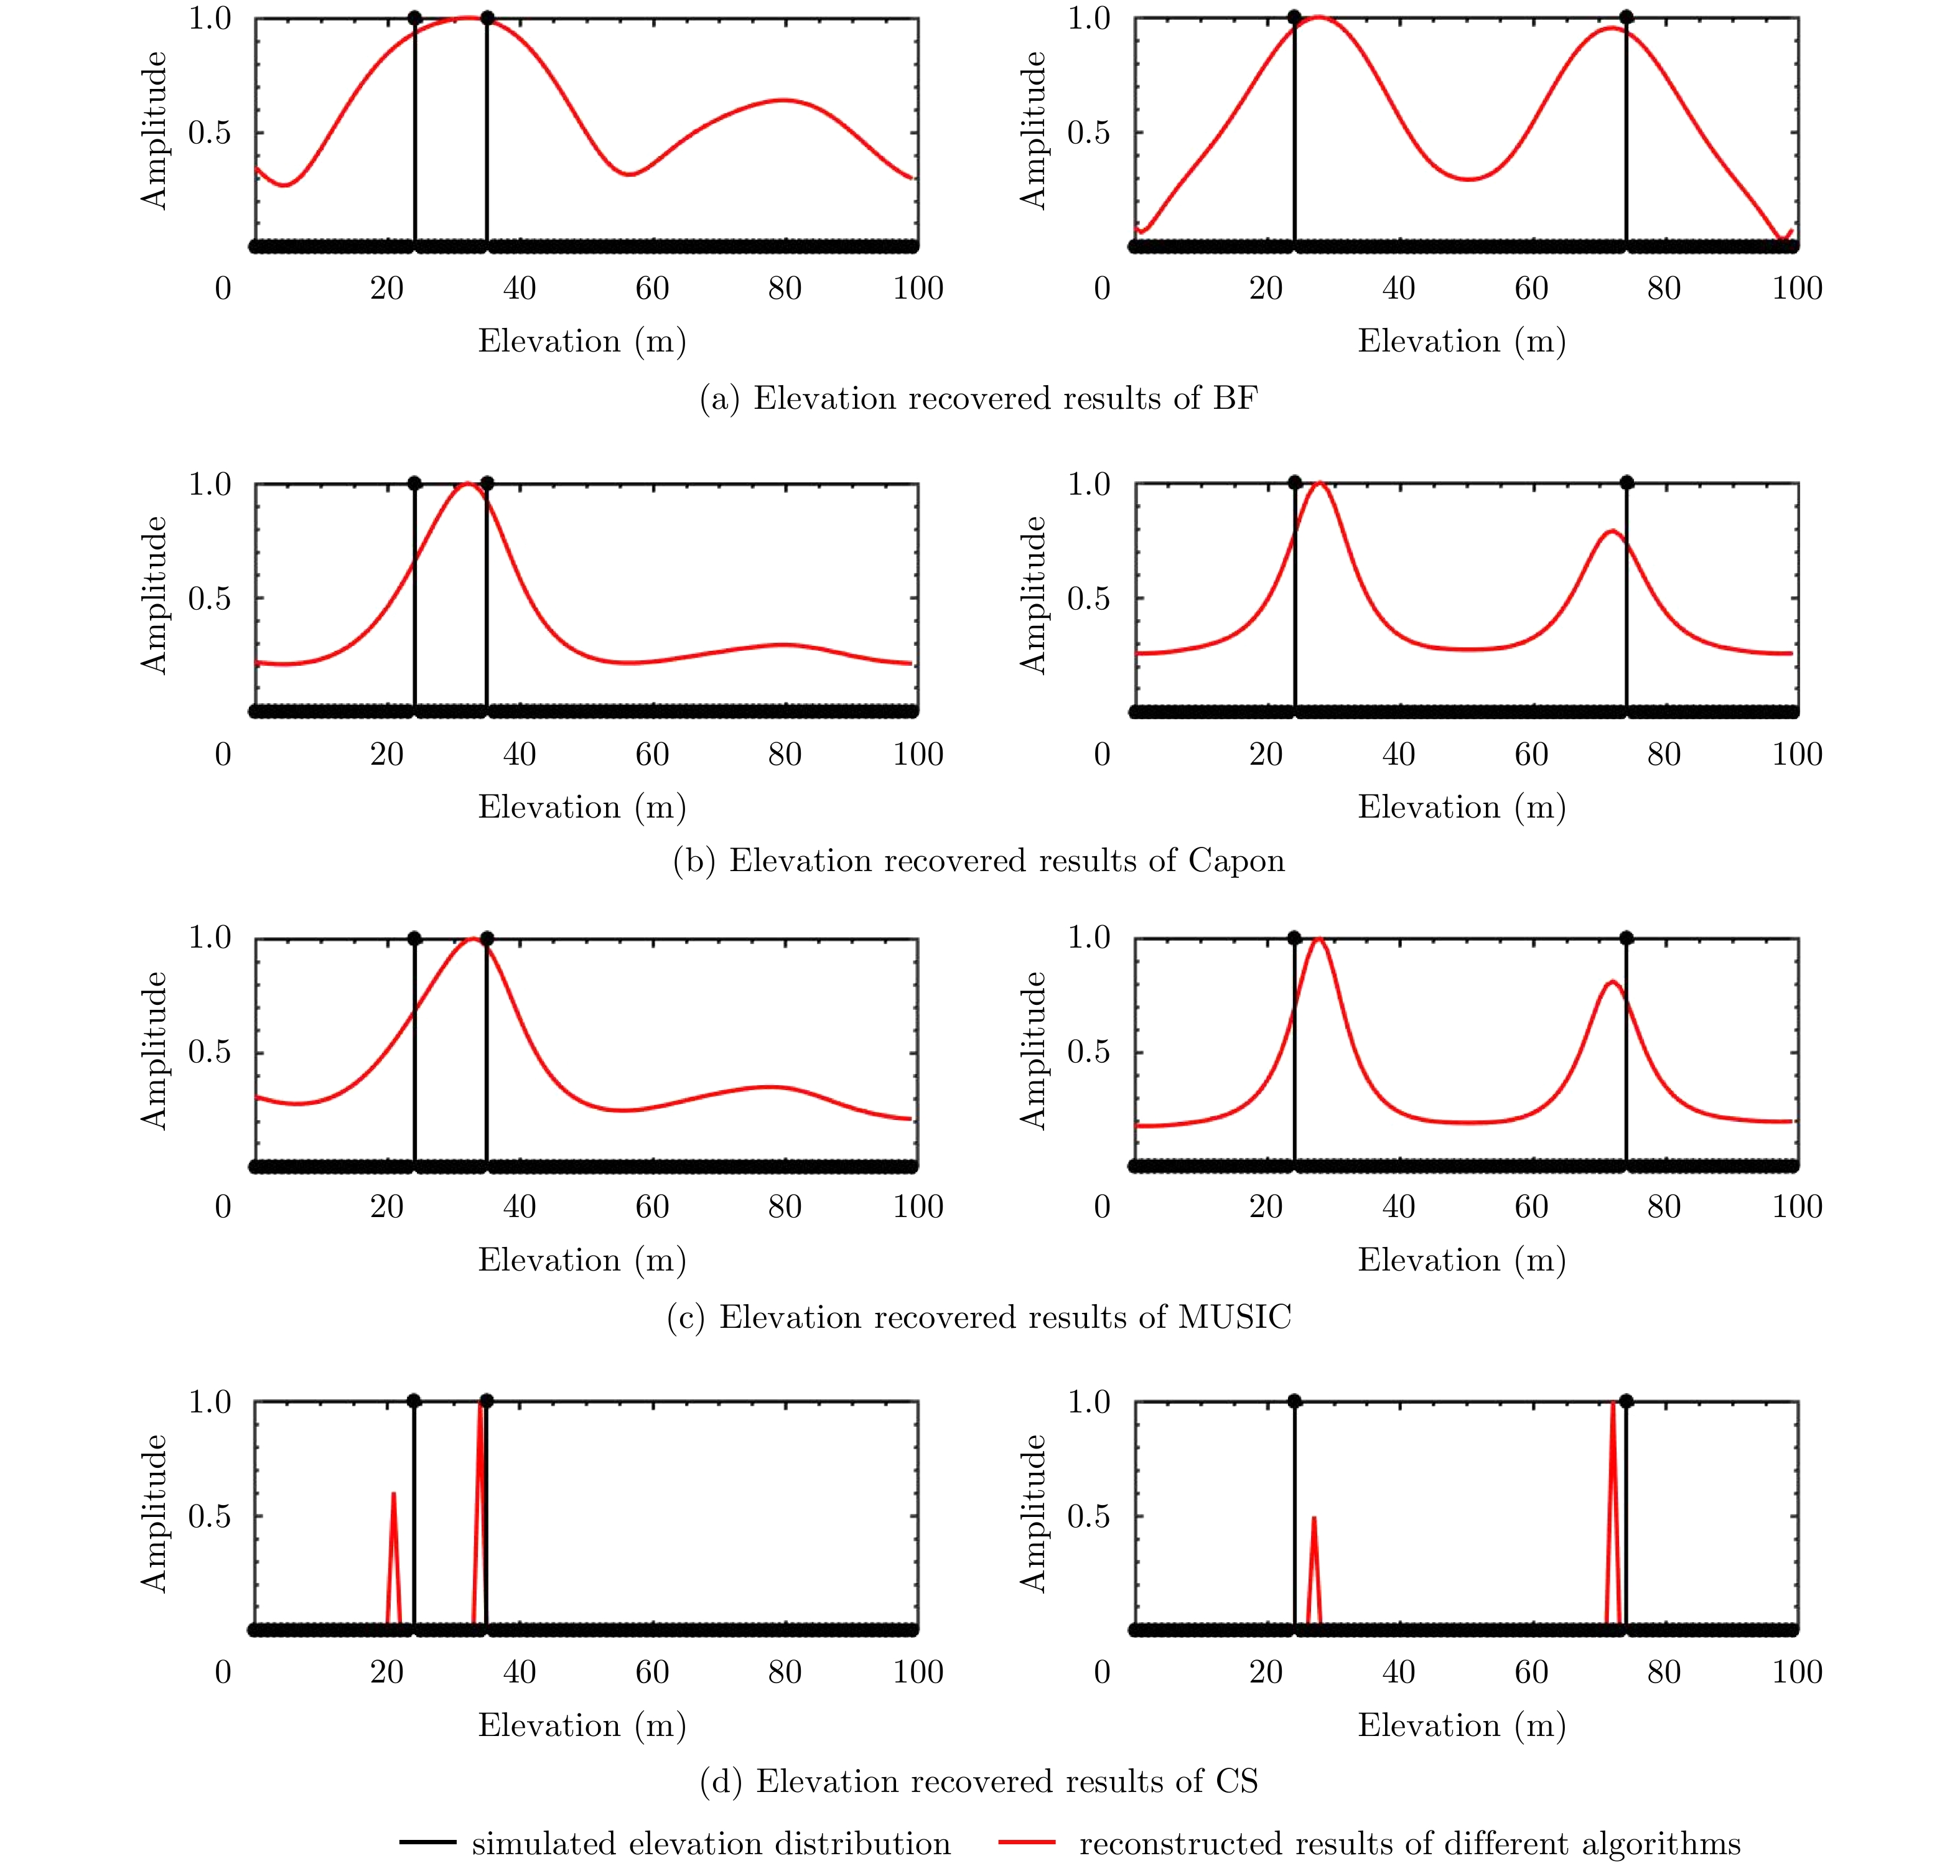
- Figure 3. TomoSAR reconstructed reflectivity profiles of two scattering points along the elevation direction (left image: the distance between two scattering points is 11 m; right image: the distance between two scattering points is 50 m)
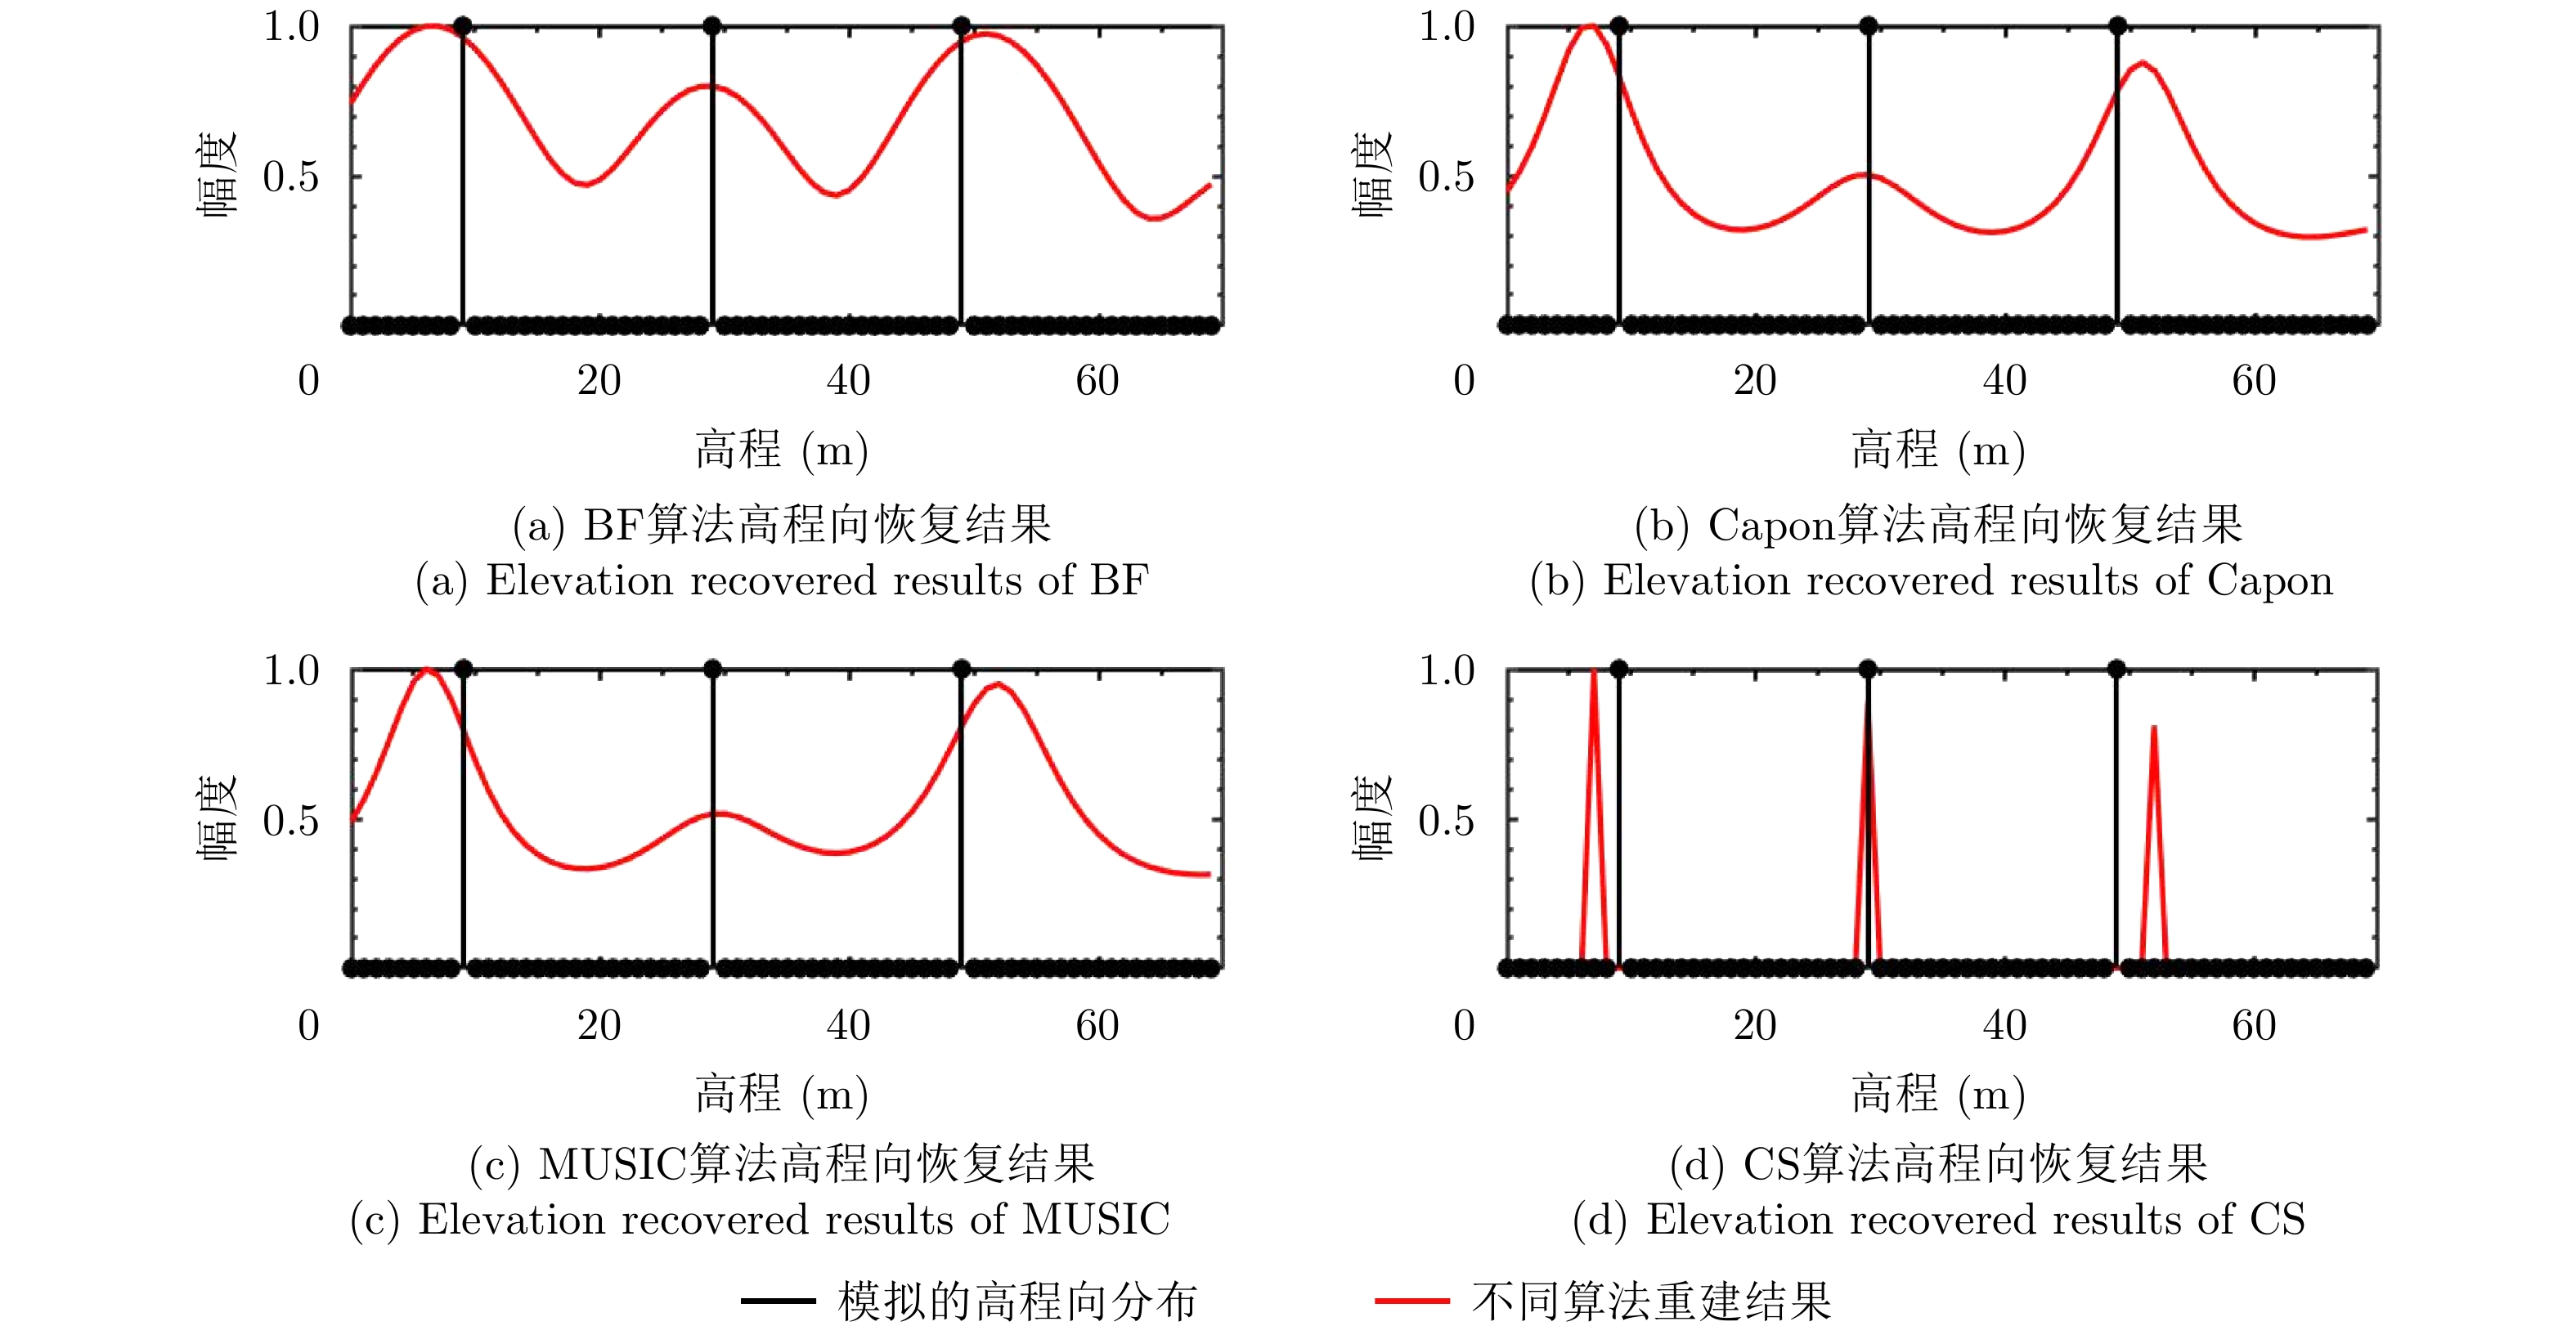
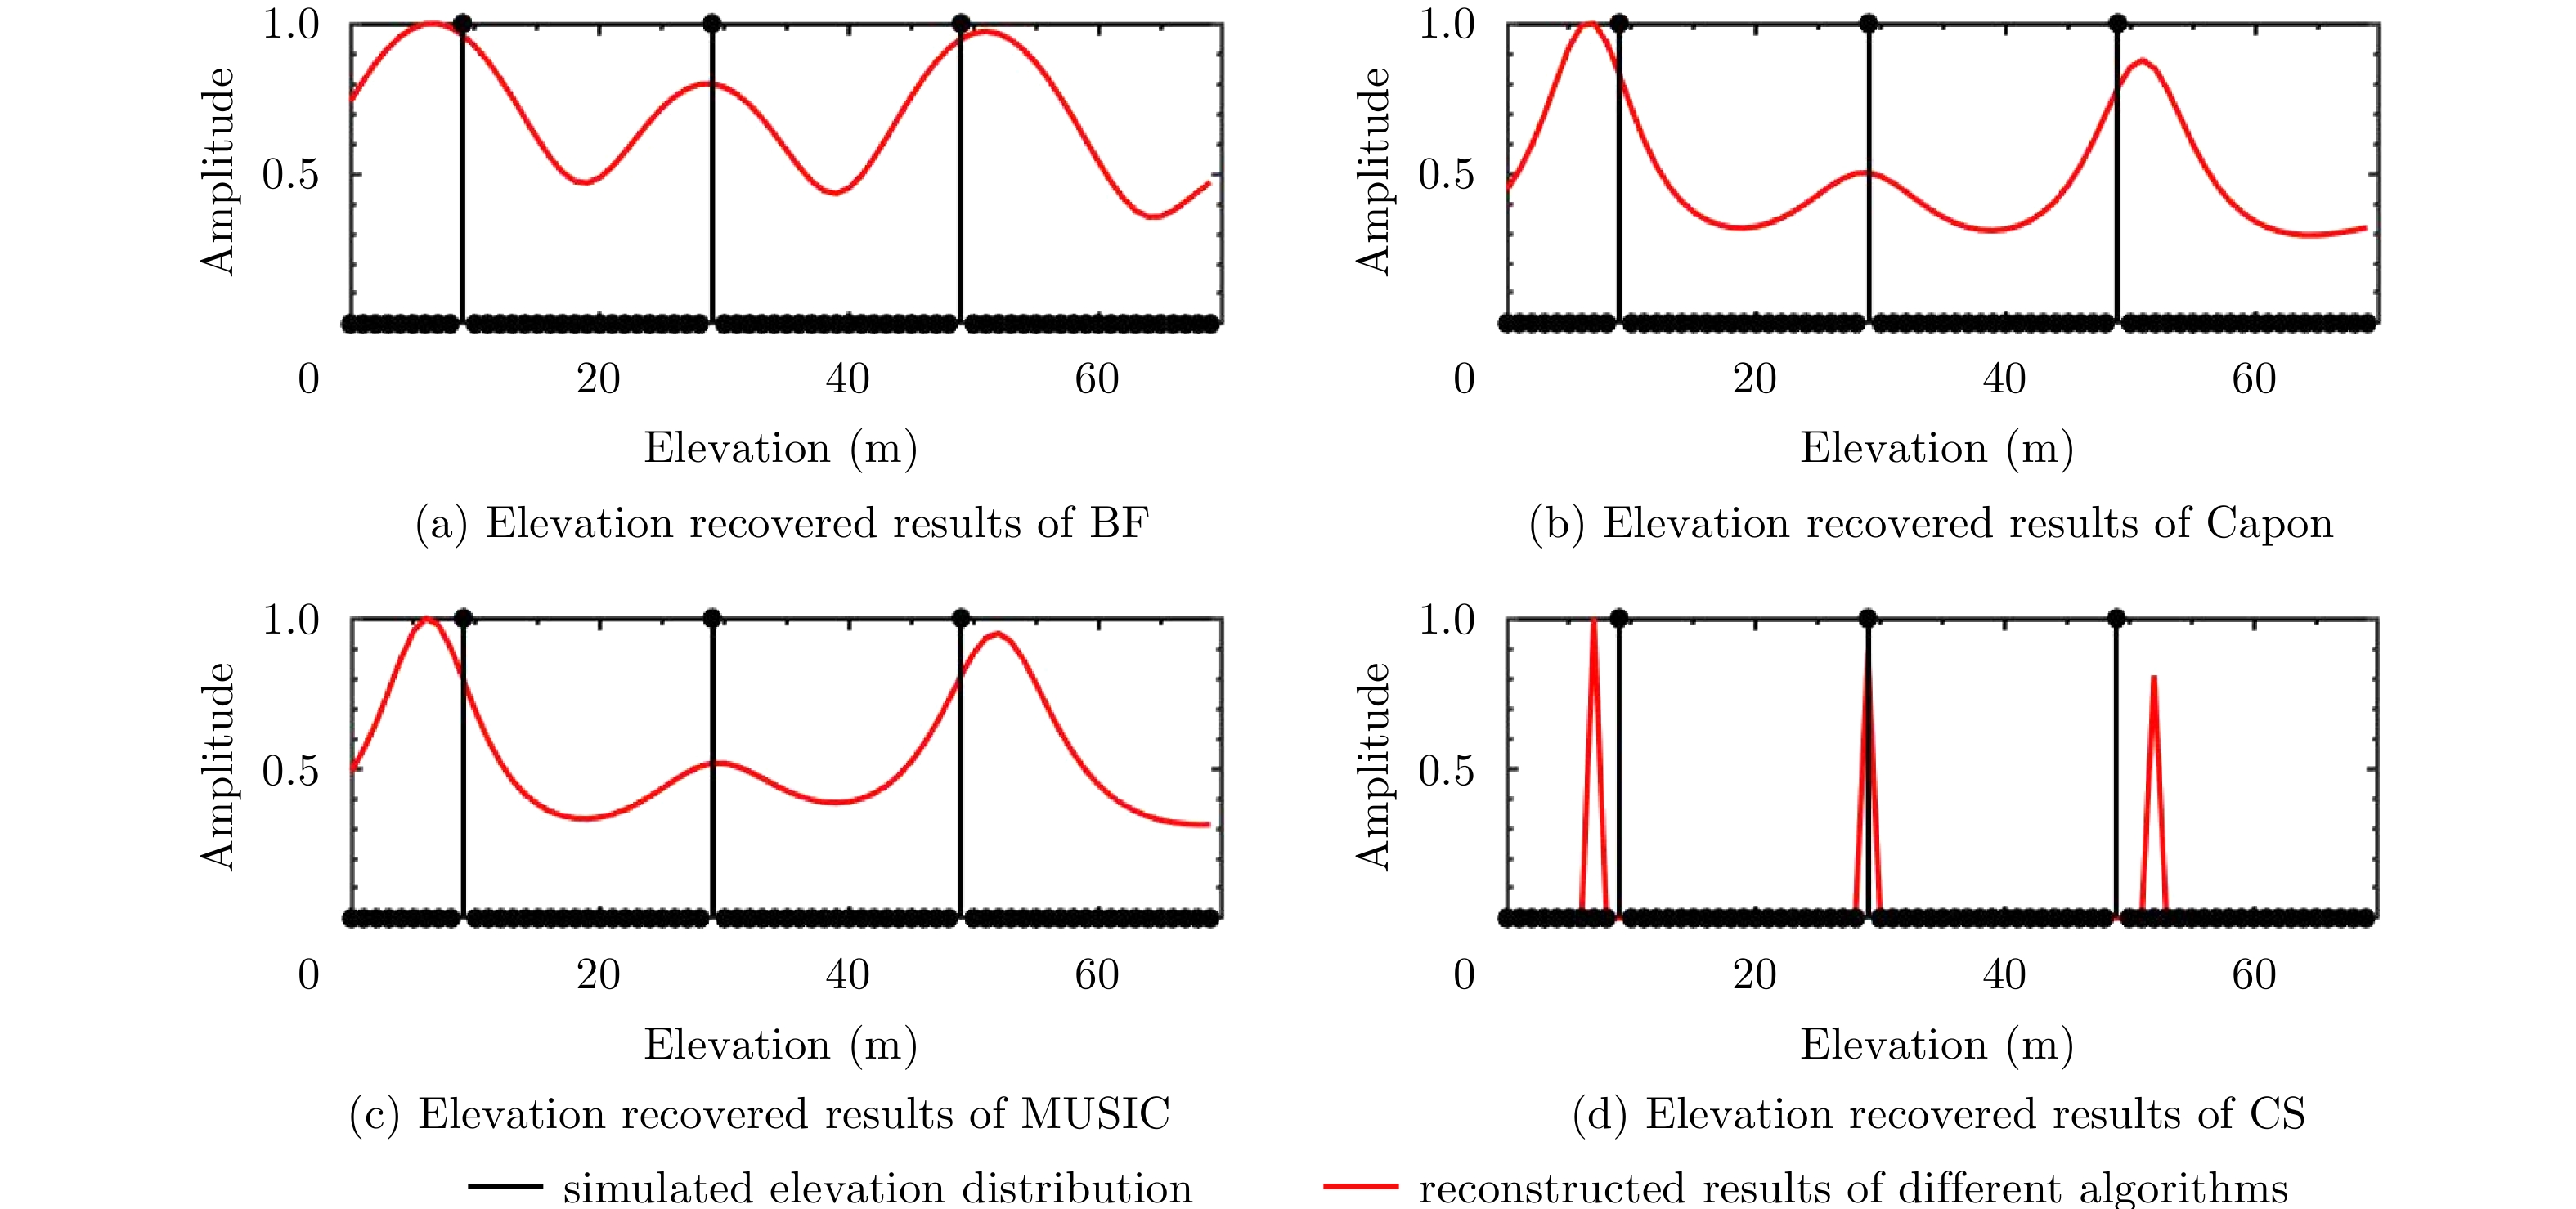
- Figure 4. TomoSAR reconstructed reflectivity profiles of three scattering points along the elevation direction (the distance between three scattering points is 20 m)
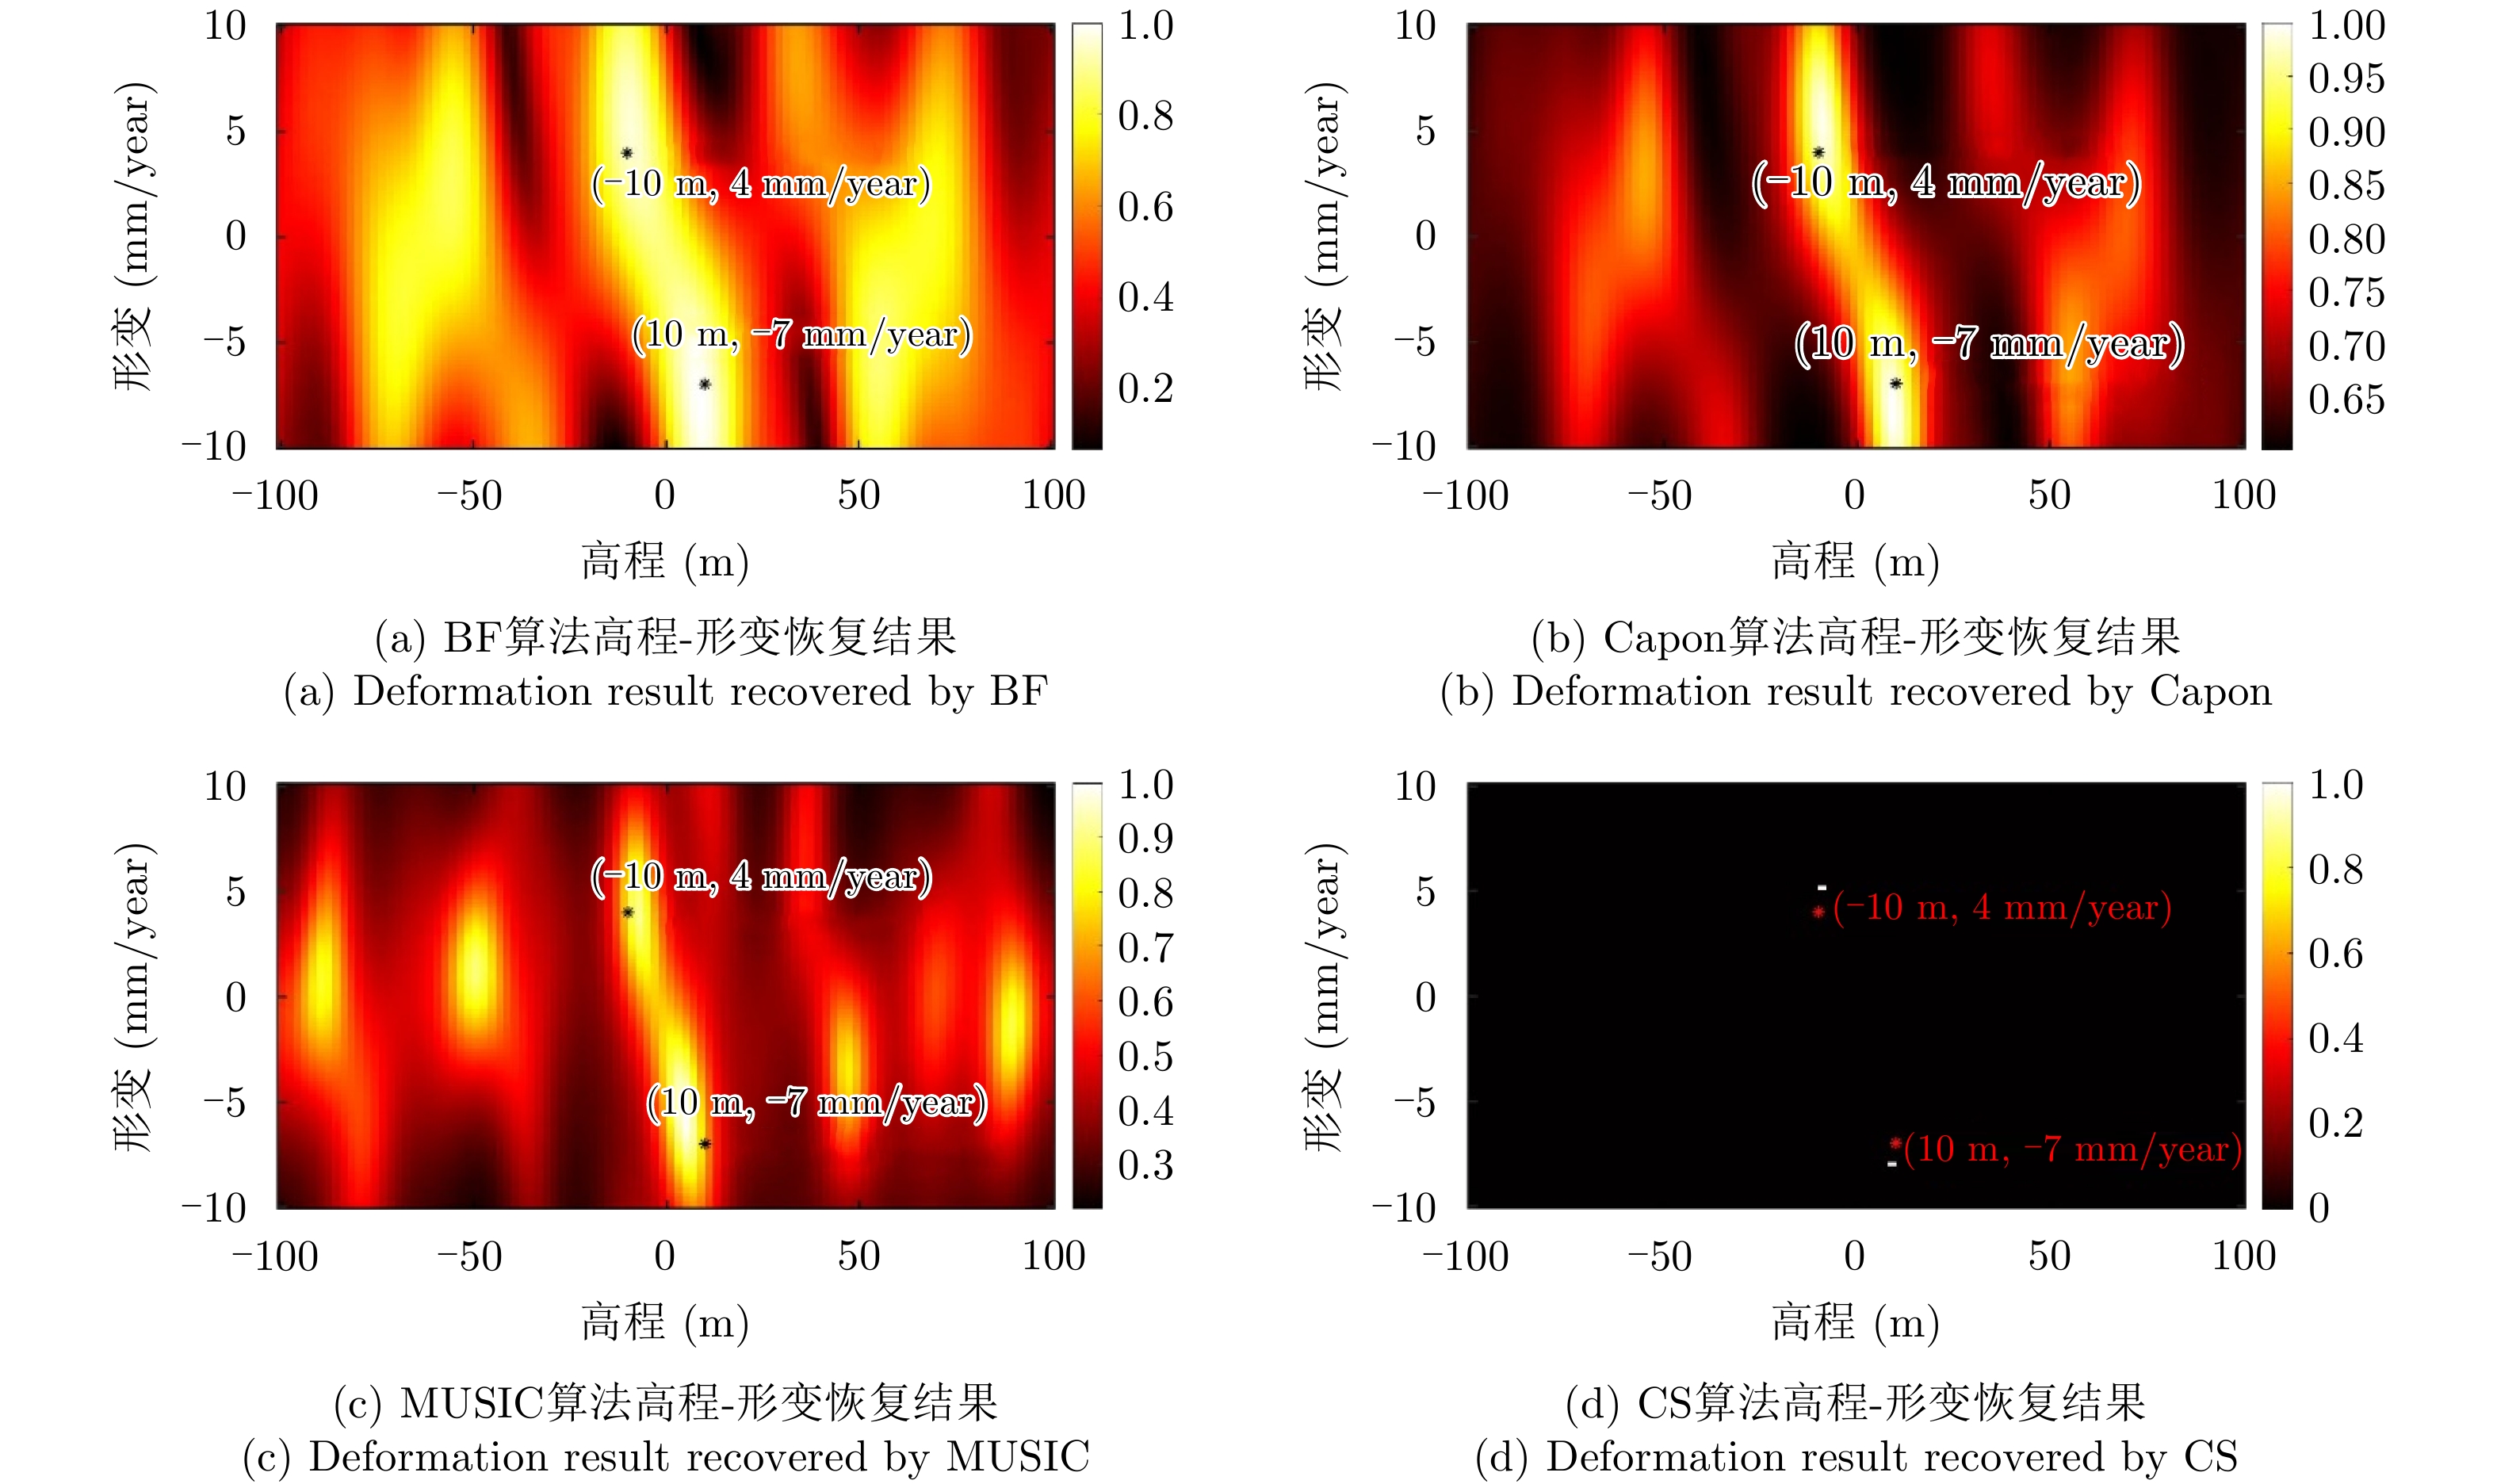
- Figure 5. D-TomoSAR simulation results (elevation position of two scatters are –10 m and 10 m; deformation velocity of two scatters are 4 mm/year and –7 mm/year, respectively)
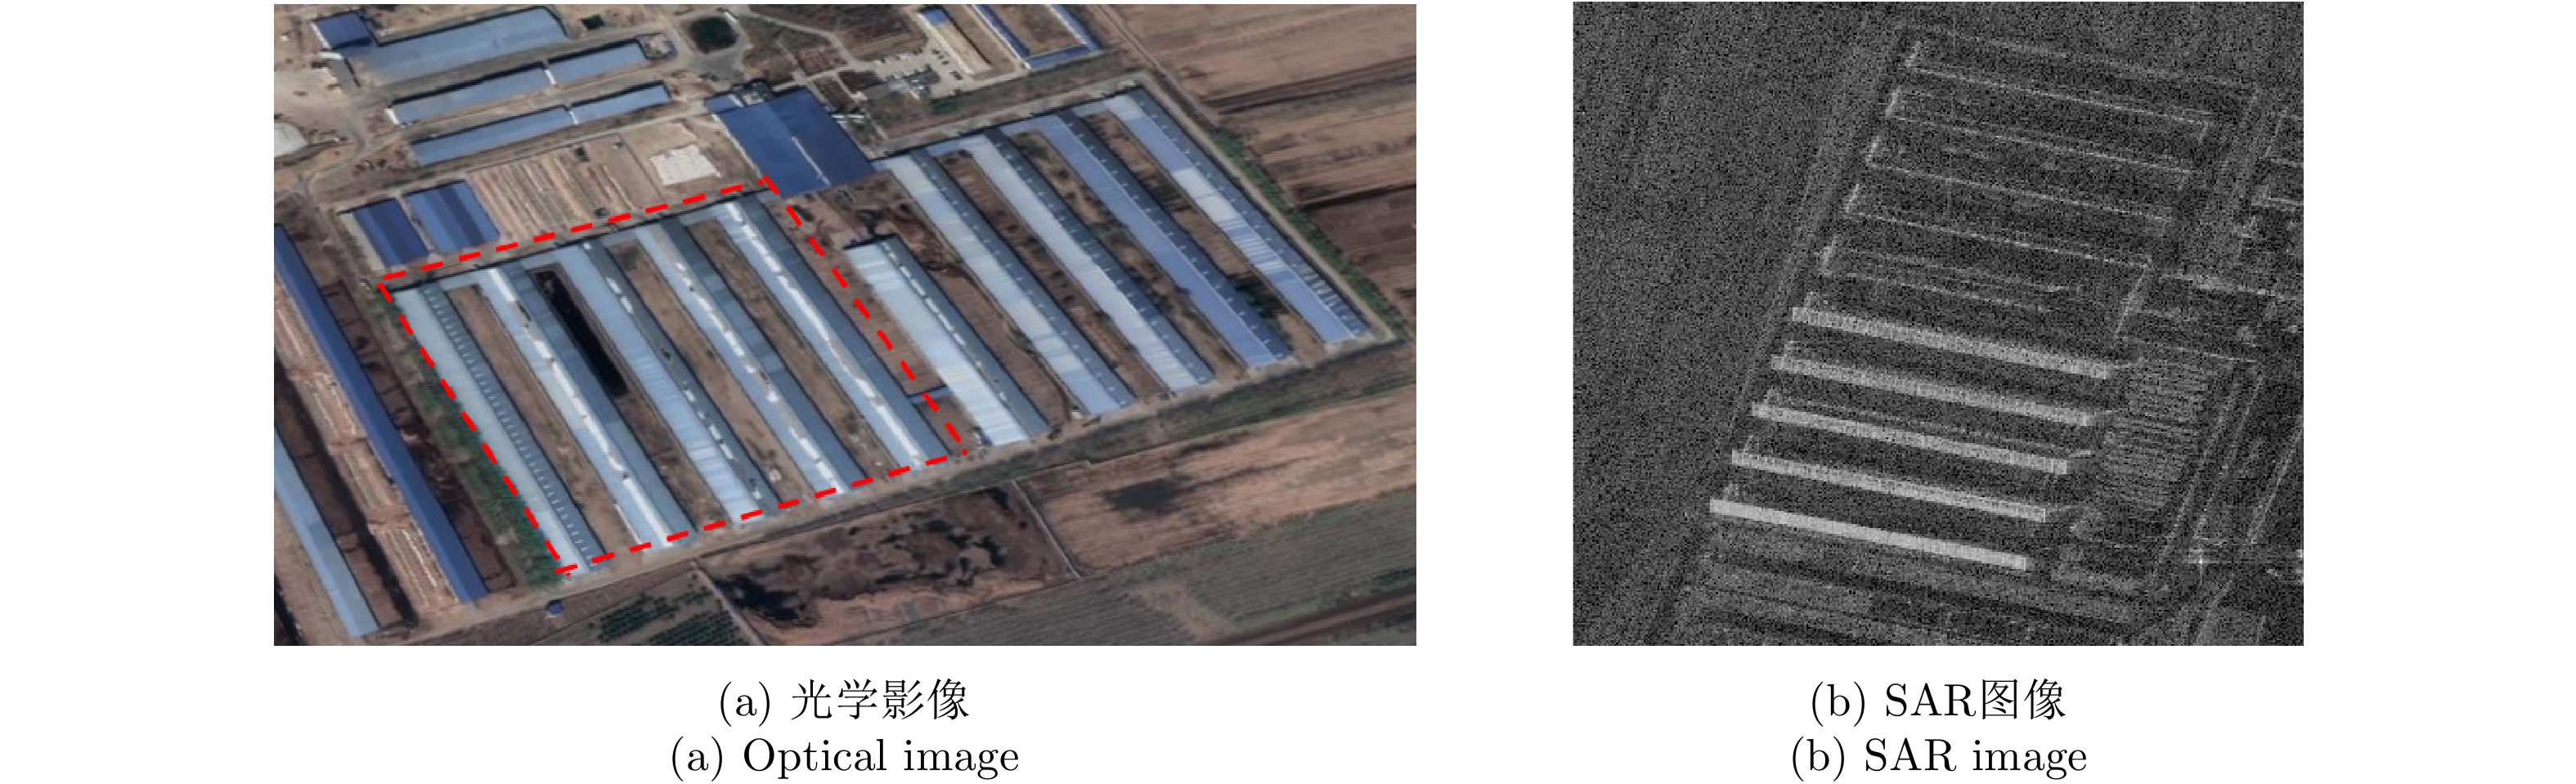
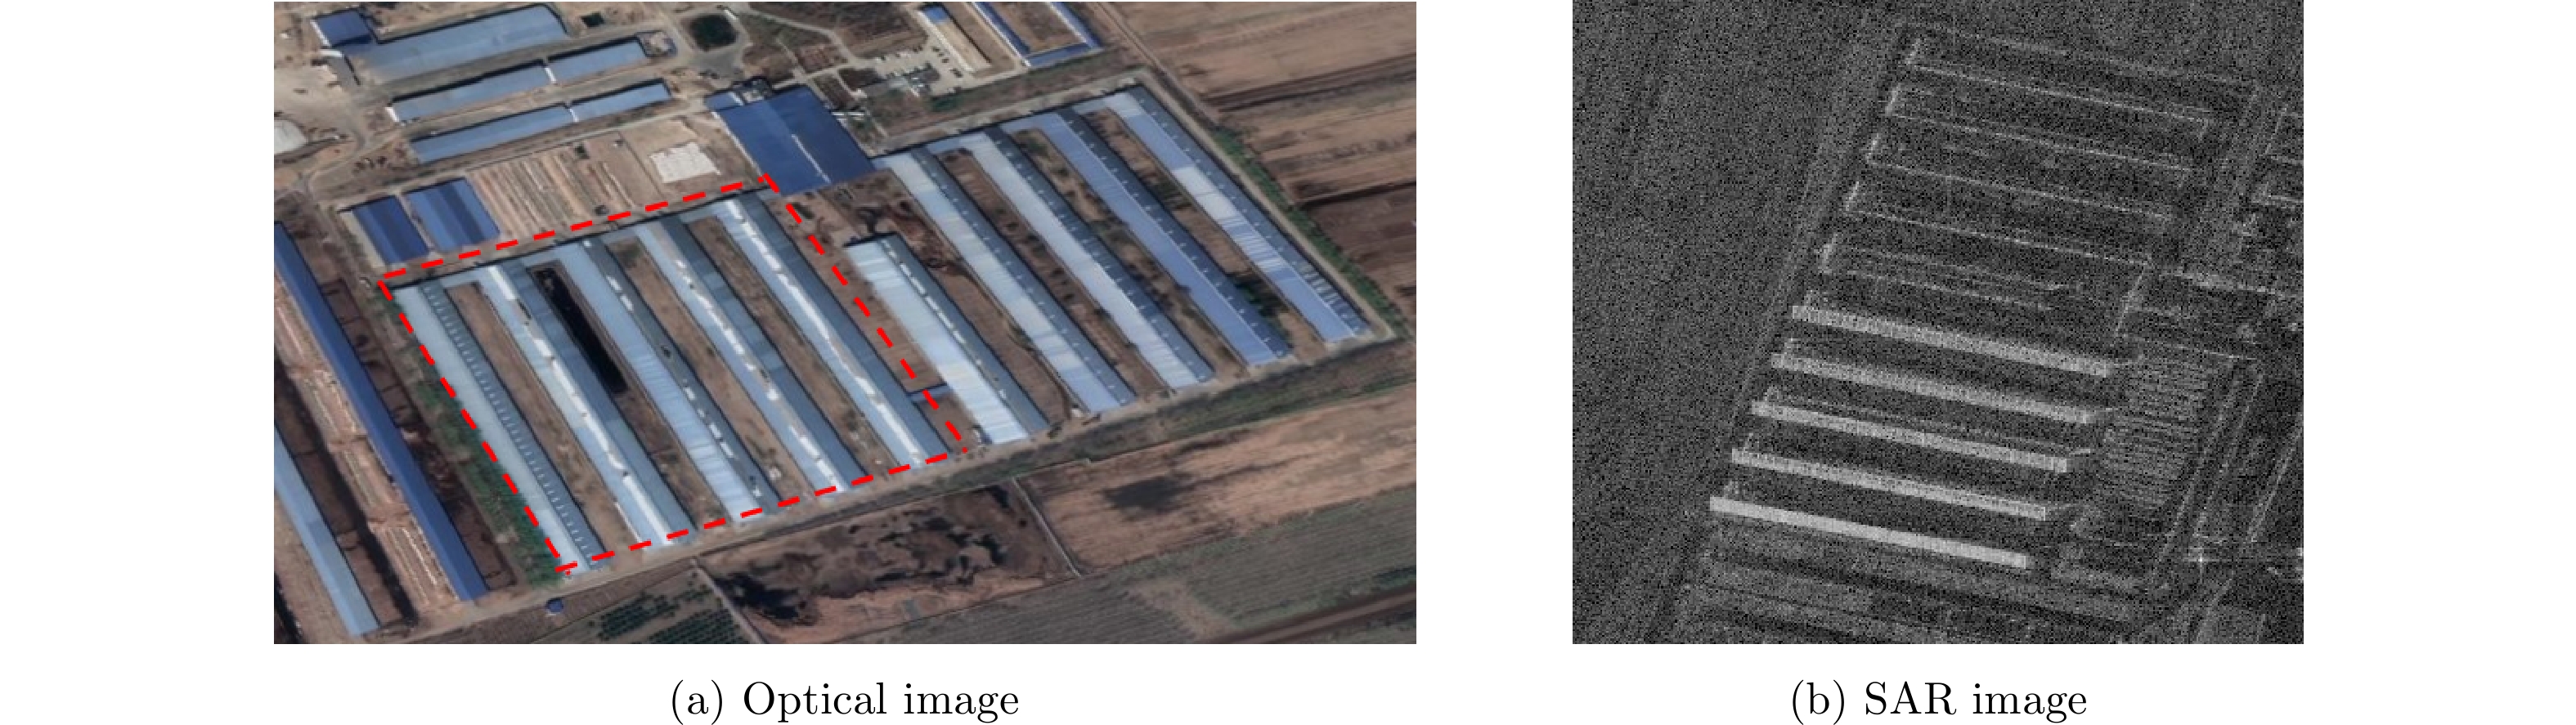
- Figure 6. Ecological agricultural company
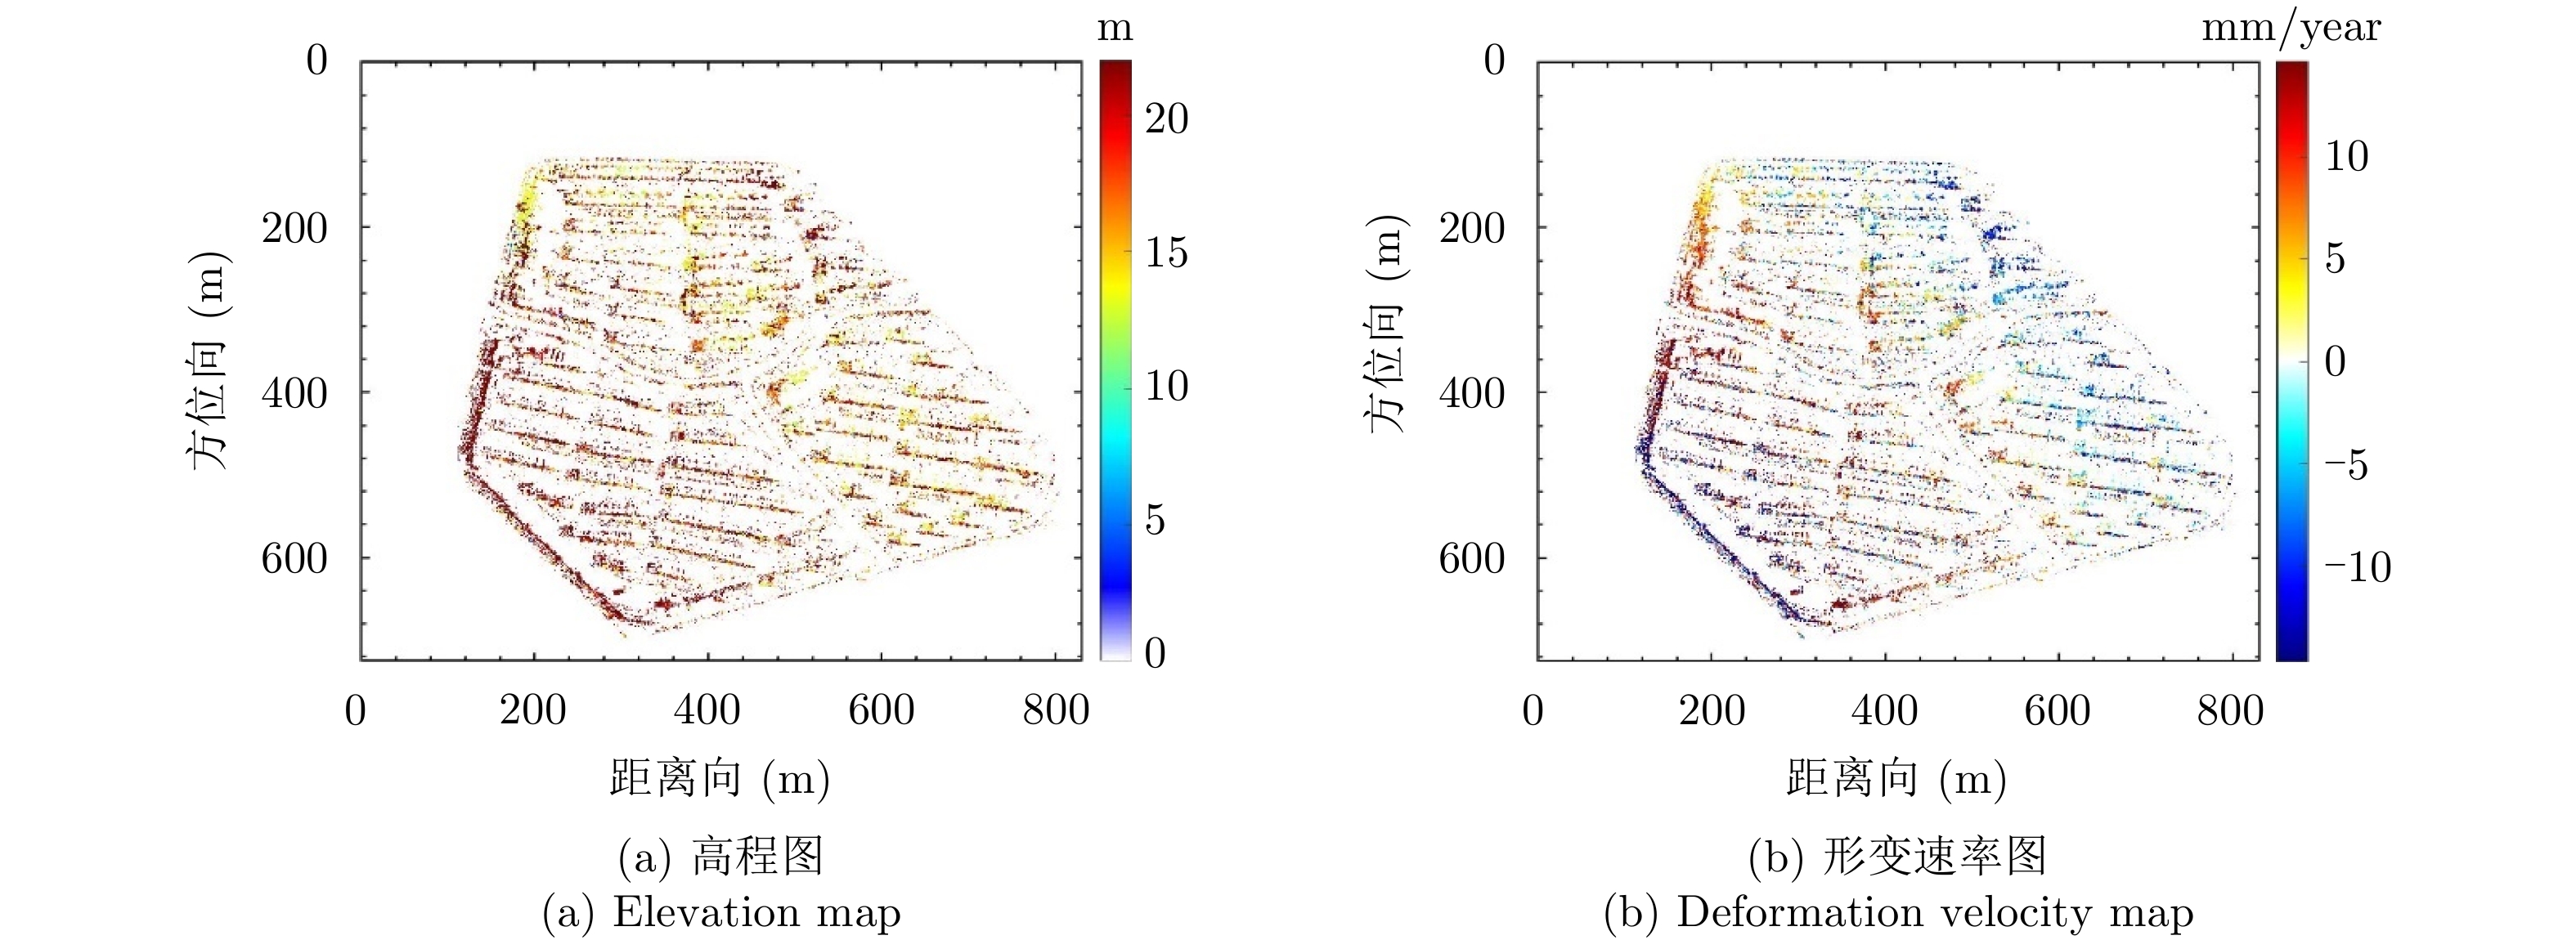
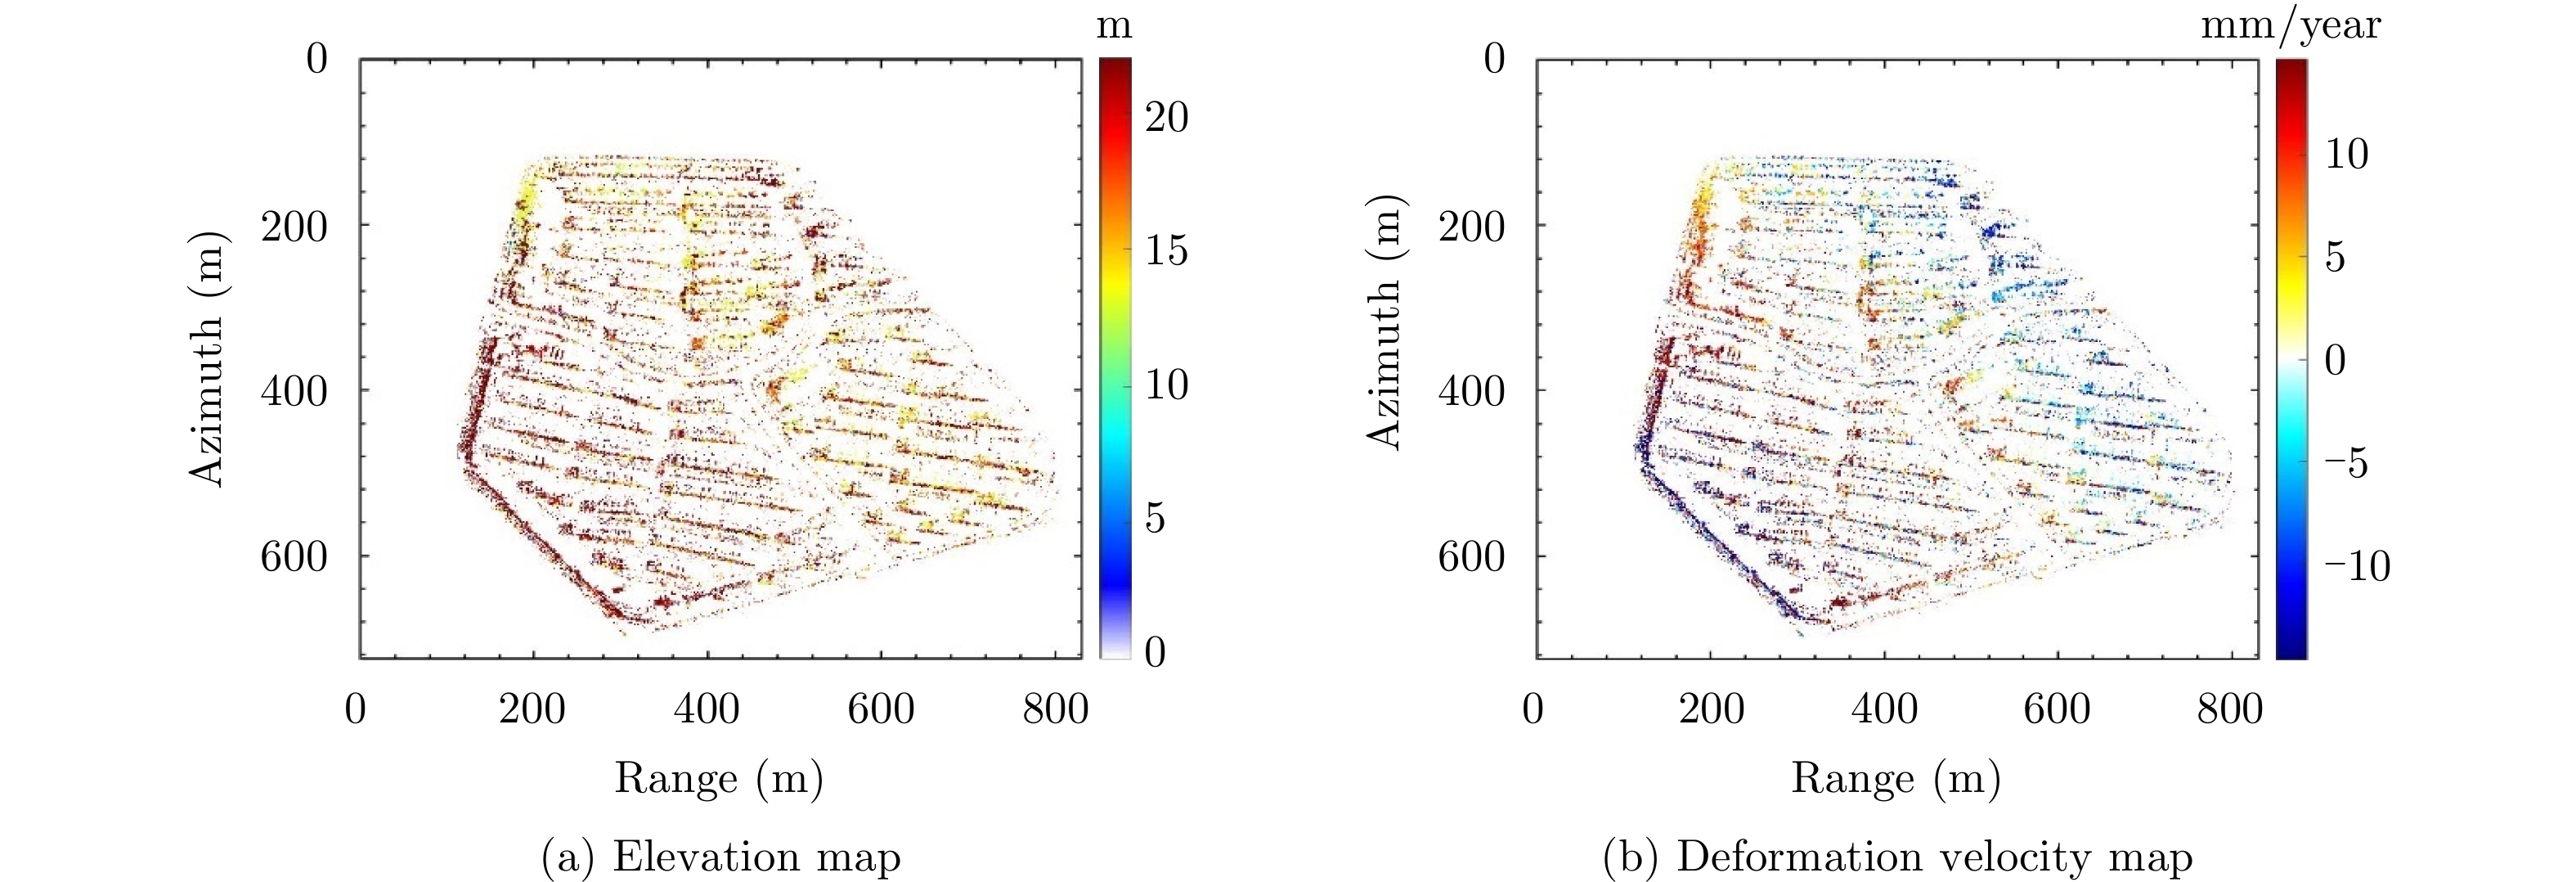
- Figure 7. Elevation and deformation velocity maps of ecological agricultural company
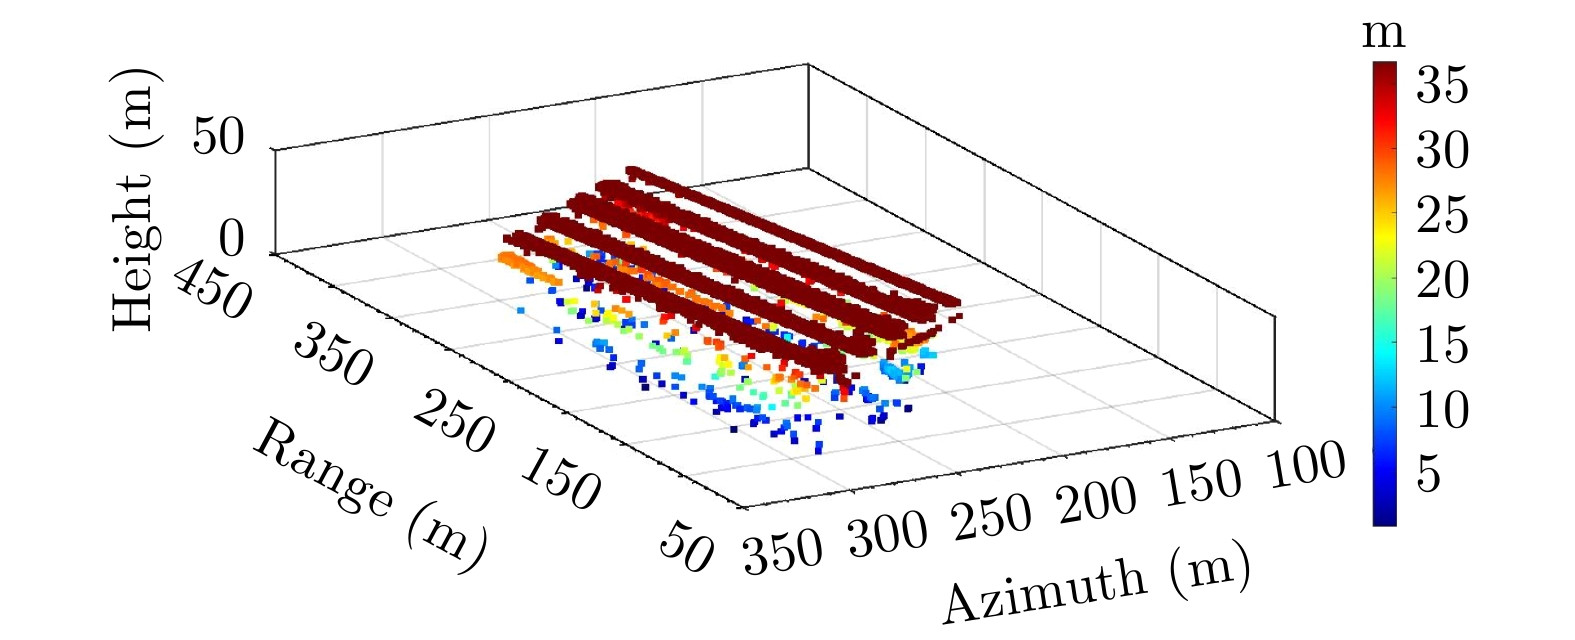
- Figure 8. 3-D point cloud of ecological agricultural company
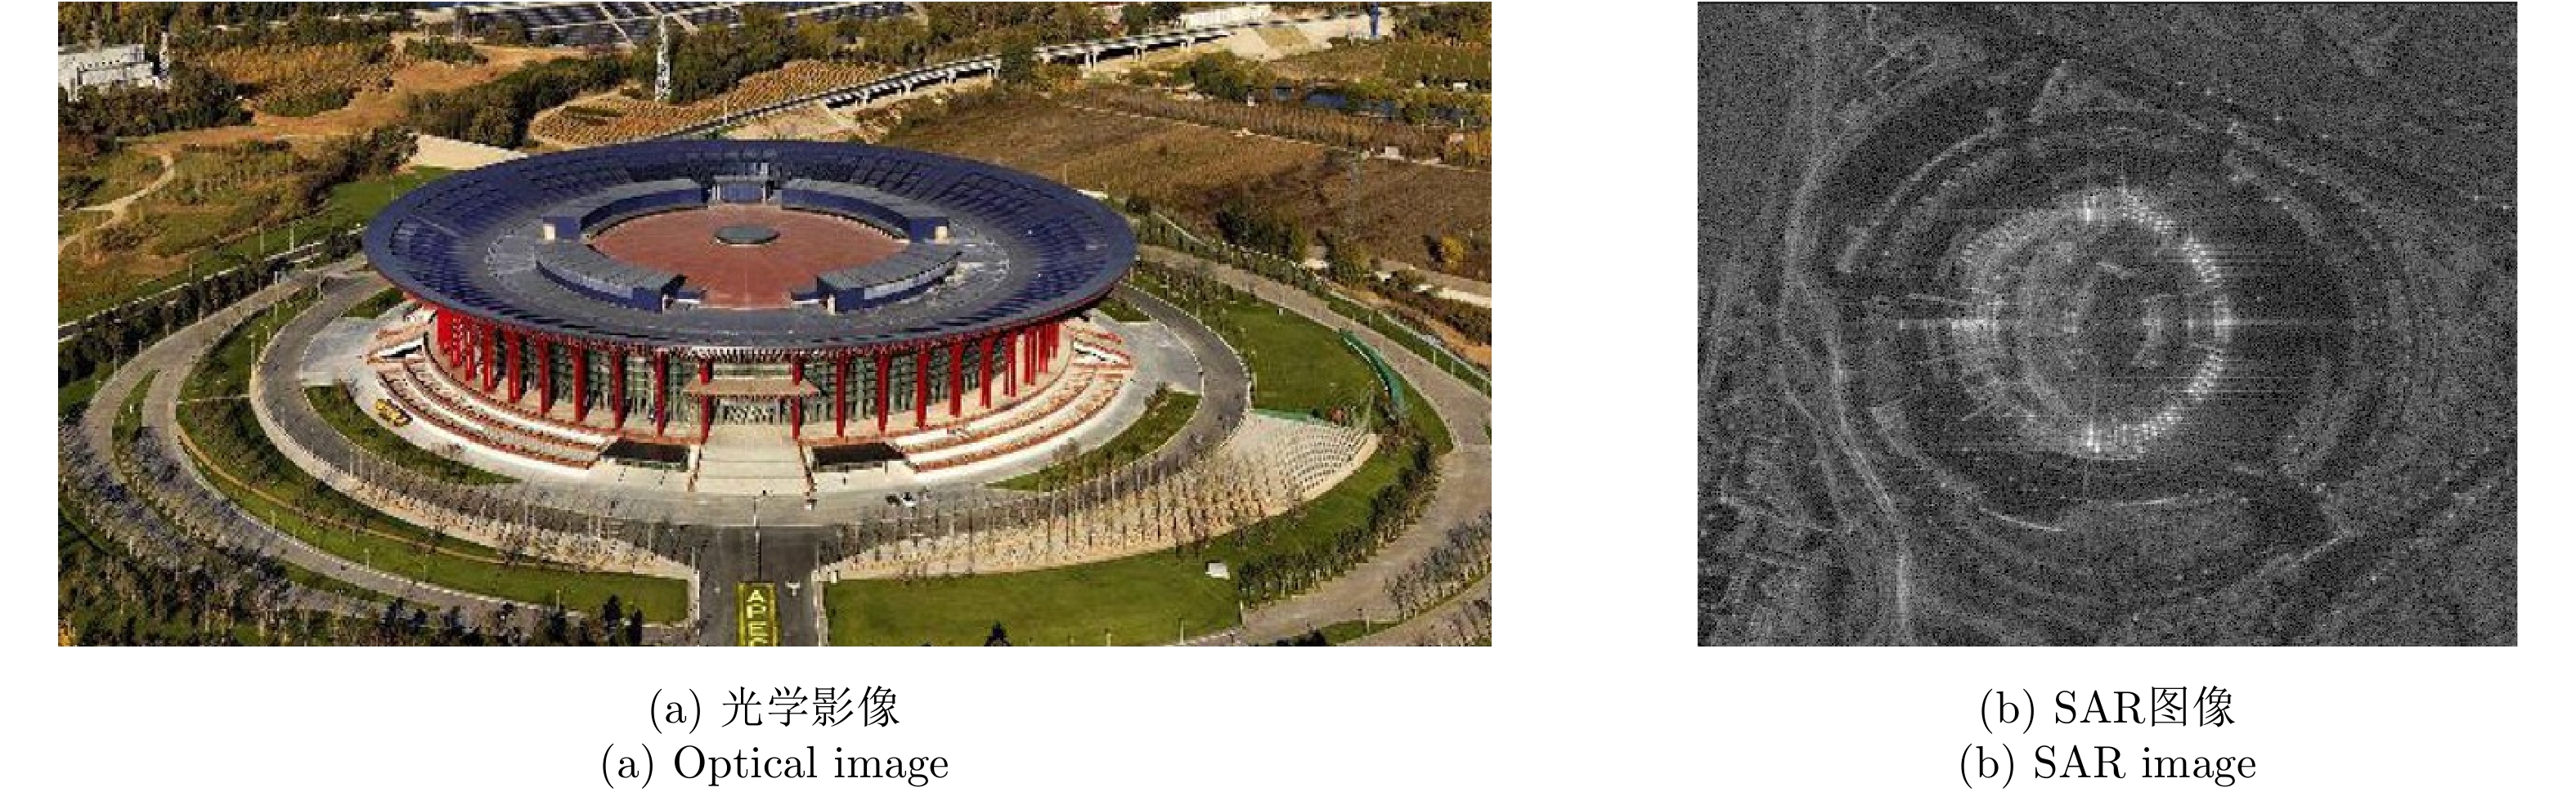
- Figure 9. Beijing Yanqi lake international convention and exhibition center
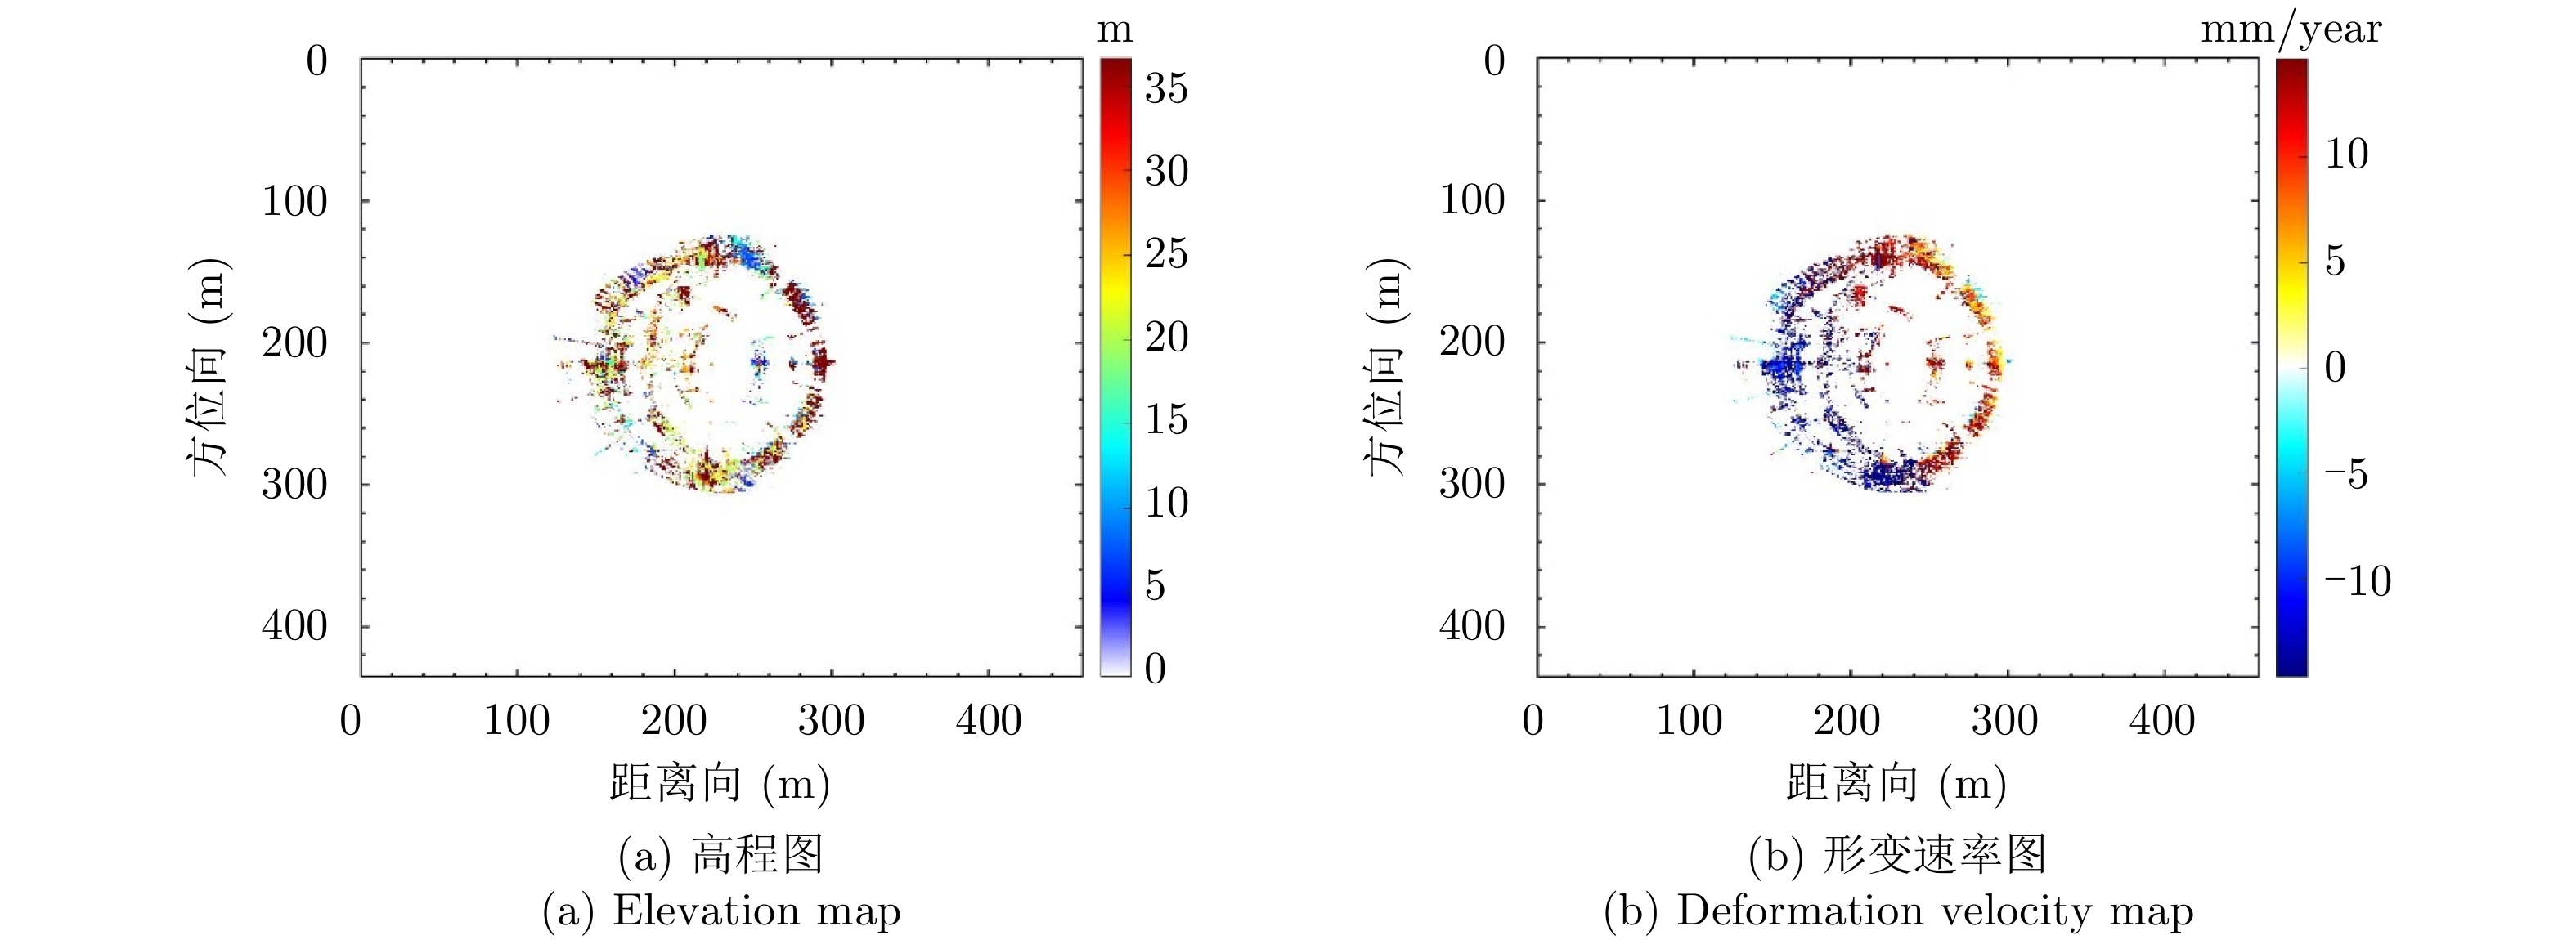
- Figure 10. Elevation and deformation velocity maps of Beijing Yanqi lake international convention and exhibition center
- Figure 11. 3-D point cloud of Beijing Yanqi lake international convention and exhibition center
- Figure 12. Dingxiumeiquan town
- Figure 13. Elevation and deformation velocity maps of Dingxiumeiquan town
- Figure 1.
- Figure 2.
- Figure 3.
- Figure 4.
- Figure 5.
- Figure 6.
- Figure 7.
- Figure 8.
- Figure 9.
- Figure 10.
- Figure 11.
- Figure 12.
- Figure 13.