
 Submit Manuscript
 Peer Review
 Editor Work
- Home
- Articles & Issues
-
Data
- Dataset of Radar Detecting Sea
- SAR Dataset
- SARGroundObjectsTypes
- SARMV3D
- AIRSAT Constellation SAR Land Cover Classification Dataset
- 3DRIED
- UWB-HA4D
- LLS-LFMCWR
- FAIR-CSAR
- MSAR
- SDD-SAR
- FUSAR
- SpaceborneSAR3Dimaging
- Sea-land Segmentation
- SAR Multi-domain Ship Detection Dataset
- SAR-Airport
- Hilly and mountainous farmland time-series SAR and ground quadrat dataset
- SAR images for interference detection and suppression
- HP-SAR Evaluation & Analytical Dataset
- GDHuiYan-ATRNet
- Multi-System Maritime Low Observable Target Dataset
- DatasetinthePaper
- DatasetintheCompetition
- Report
- Course
- About
- Publish
- Editorial Board
- Chinese
| Citation: | REN Zhenyu, JI Chenqing, YU Chao, et al. Computer vision-assisted wireless channel simulation for millimeter wave human motion recognition[J]. Journal of Radars, 2025, 14(1): 90–102. doi: 10.12000/JR24101

|
Computer Vision-assisted Wireless Channel Simulation for Millimeter Wave Human Motion Recognition
DOI: 10.12000/JR24101 CSTR: 32380.14.JR24101
More Information-
Abstract
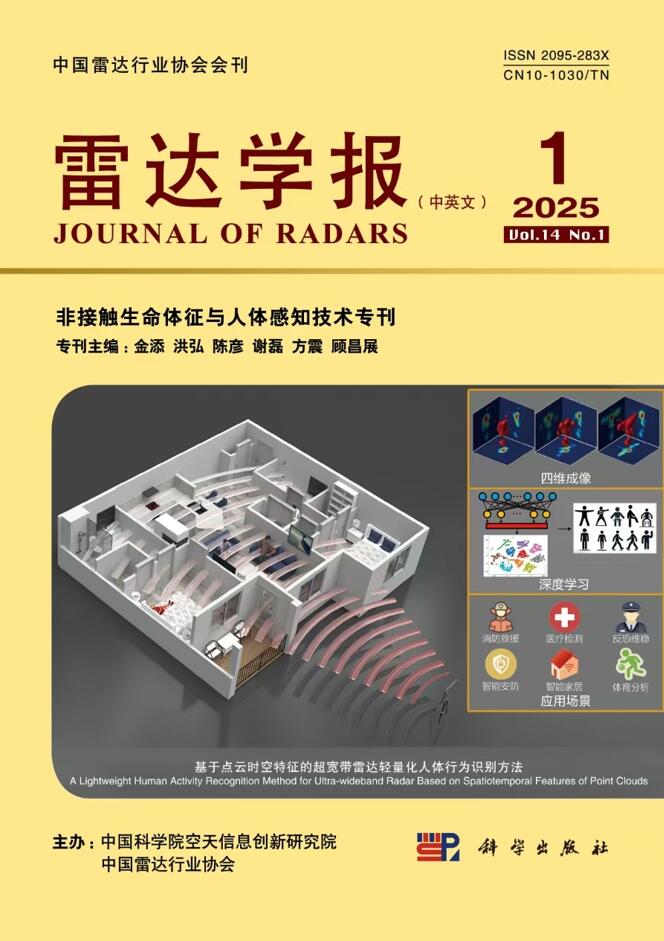
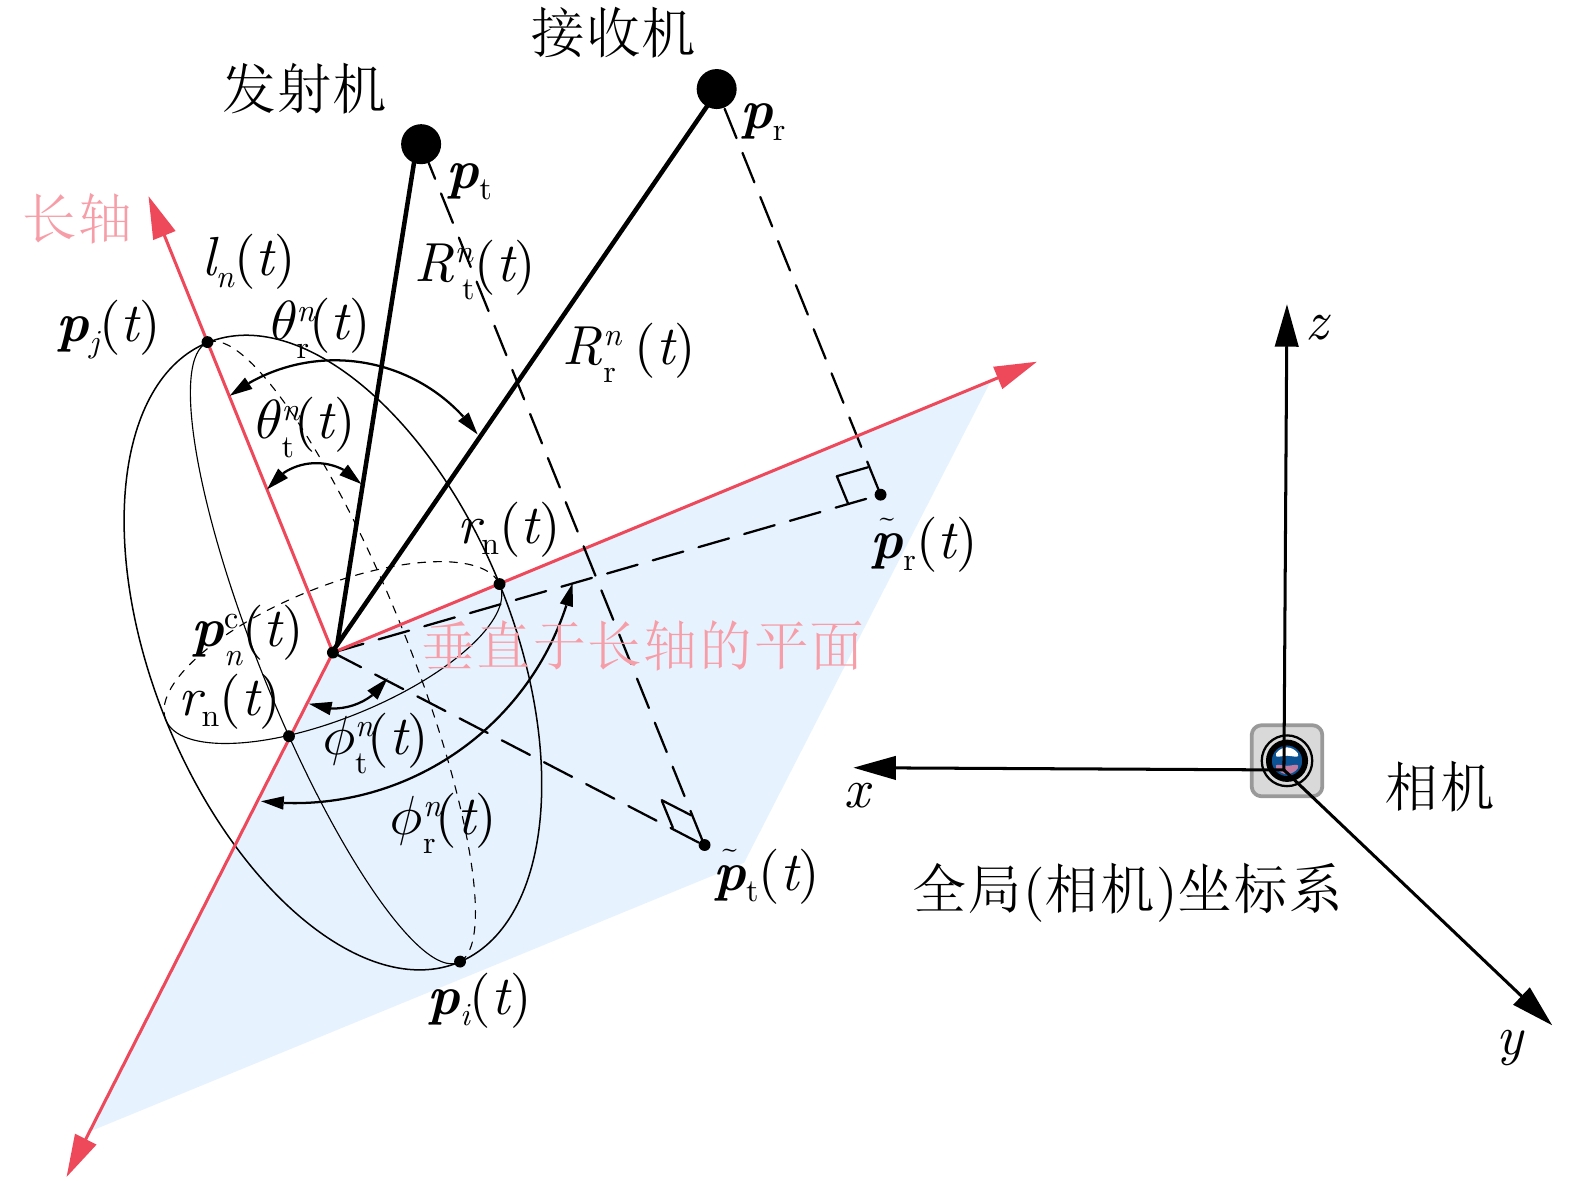
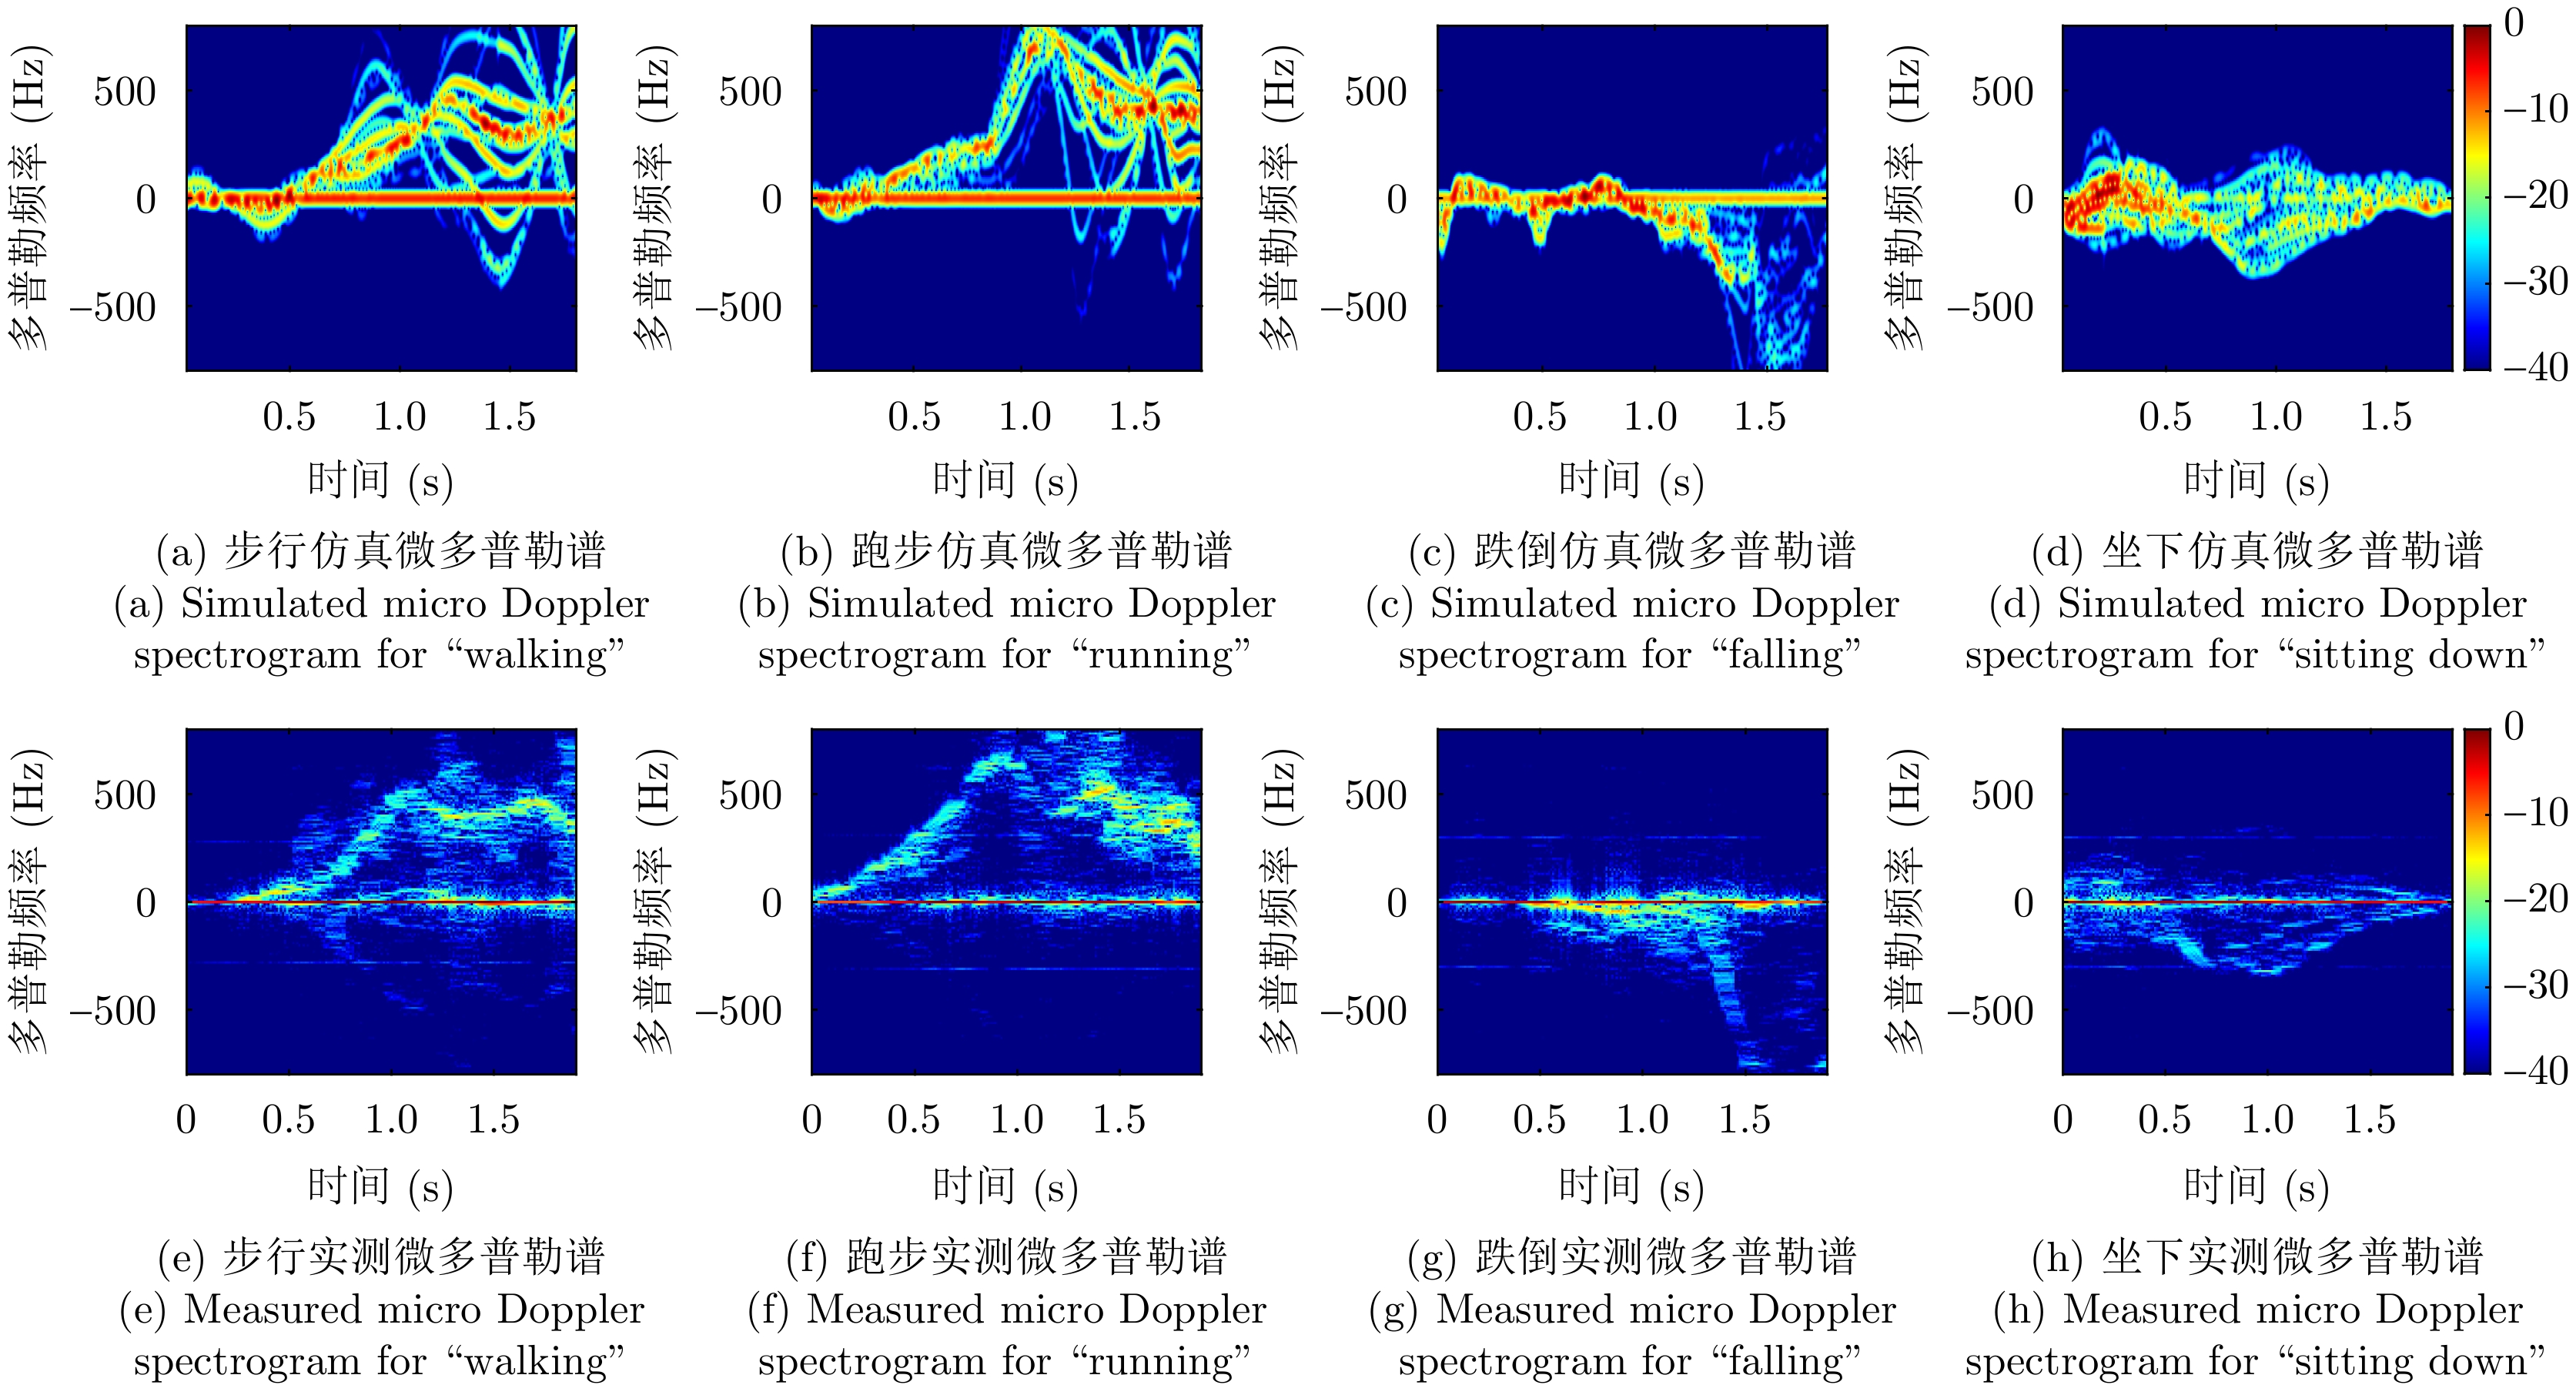
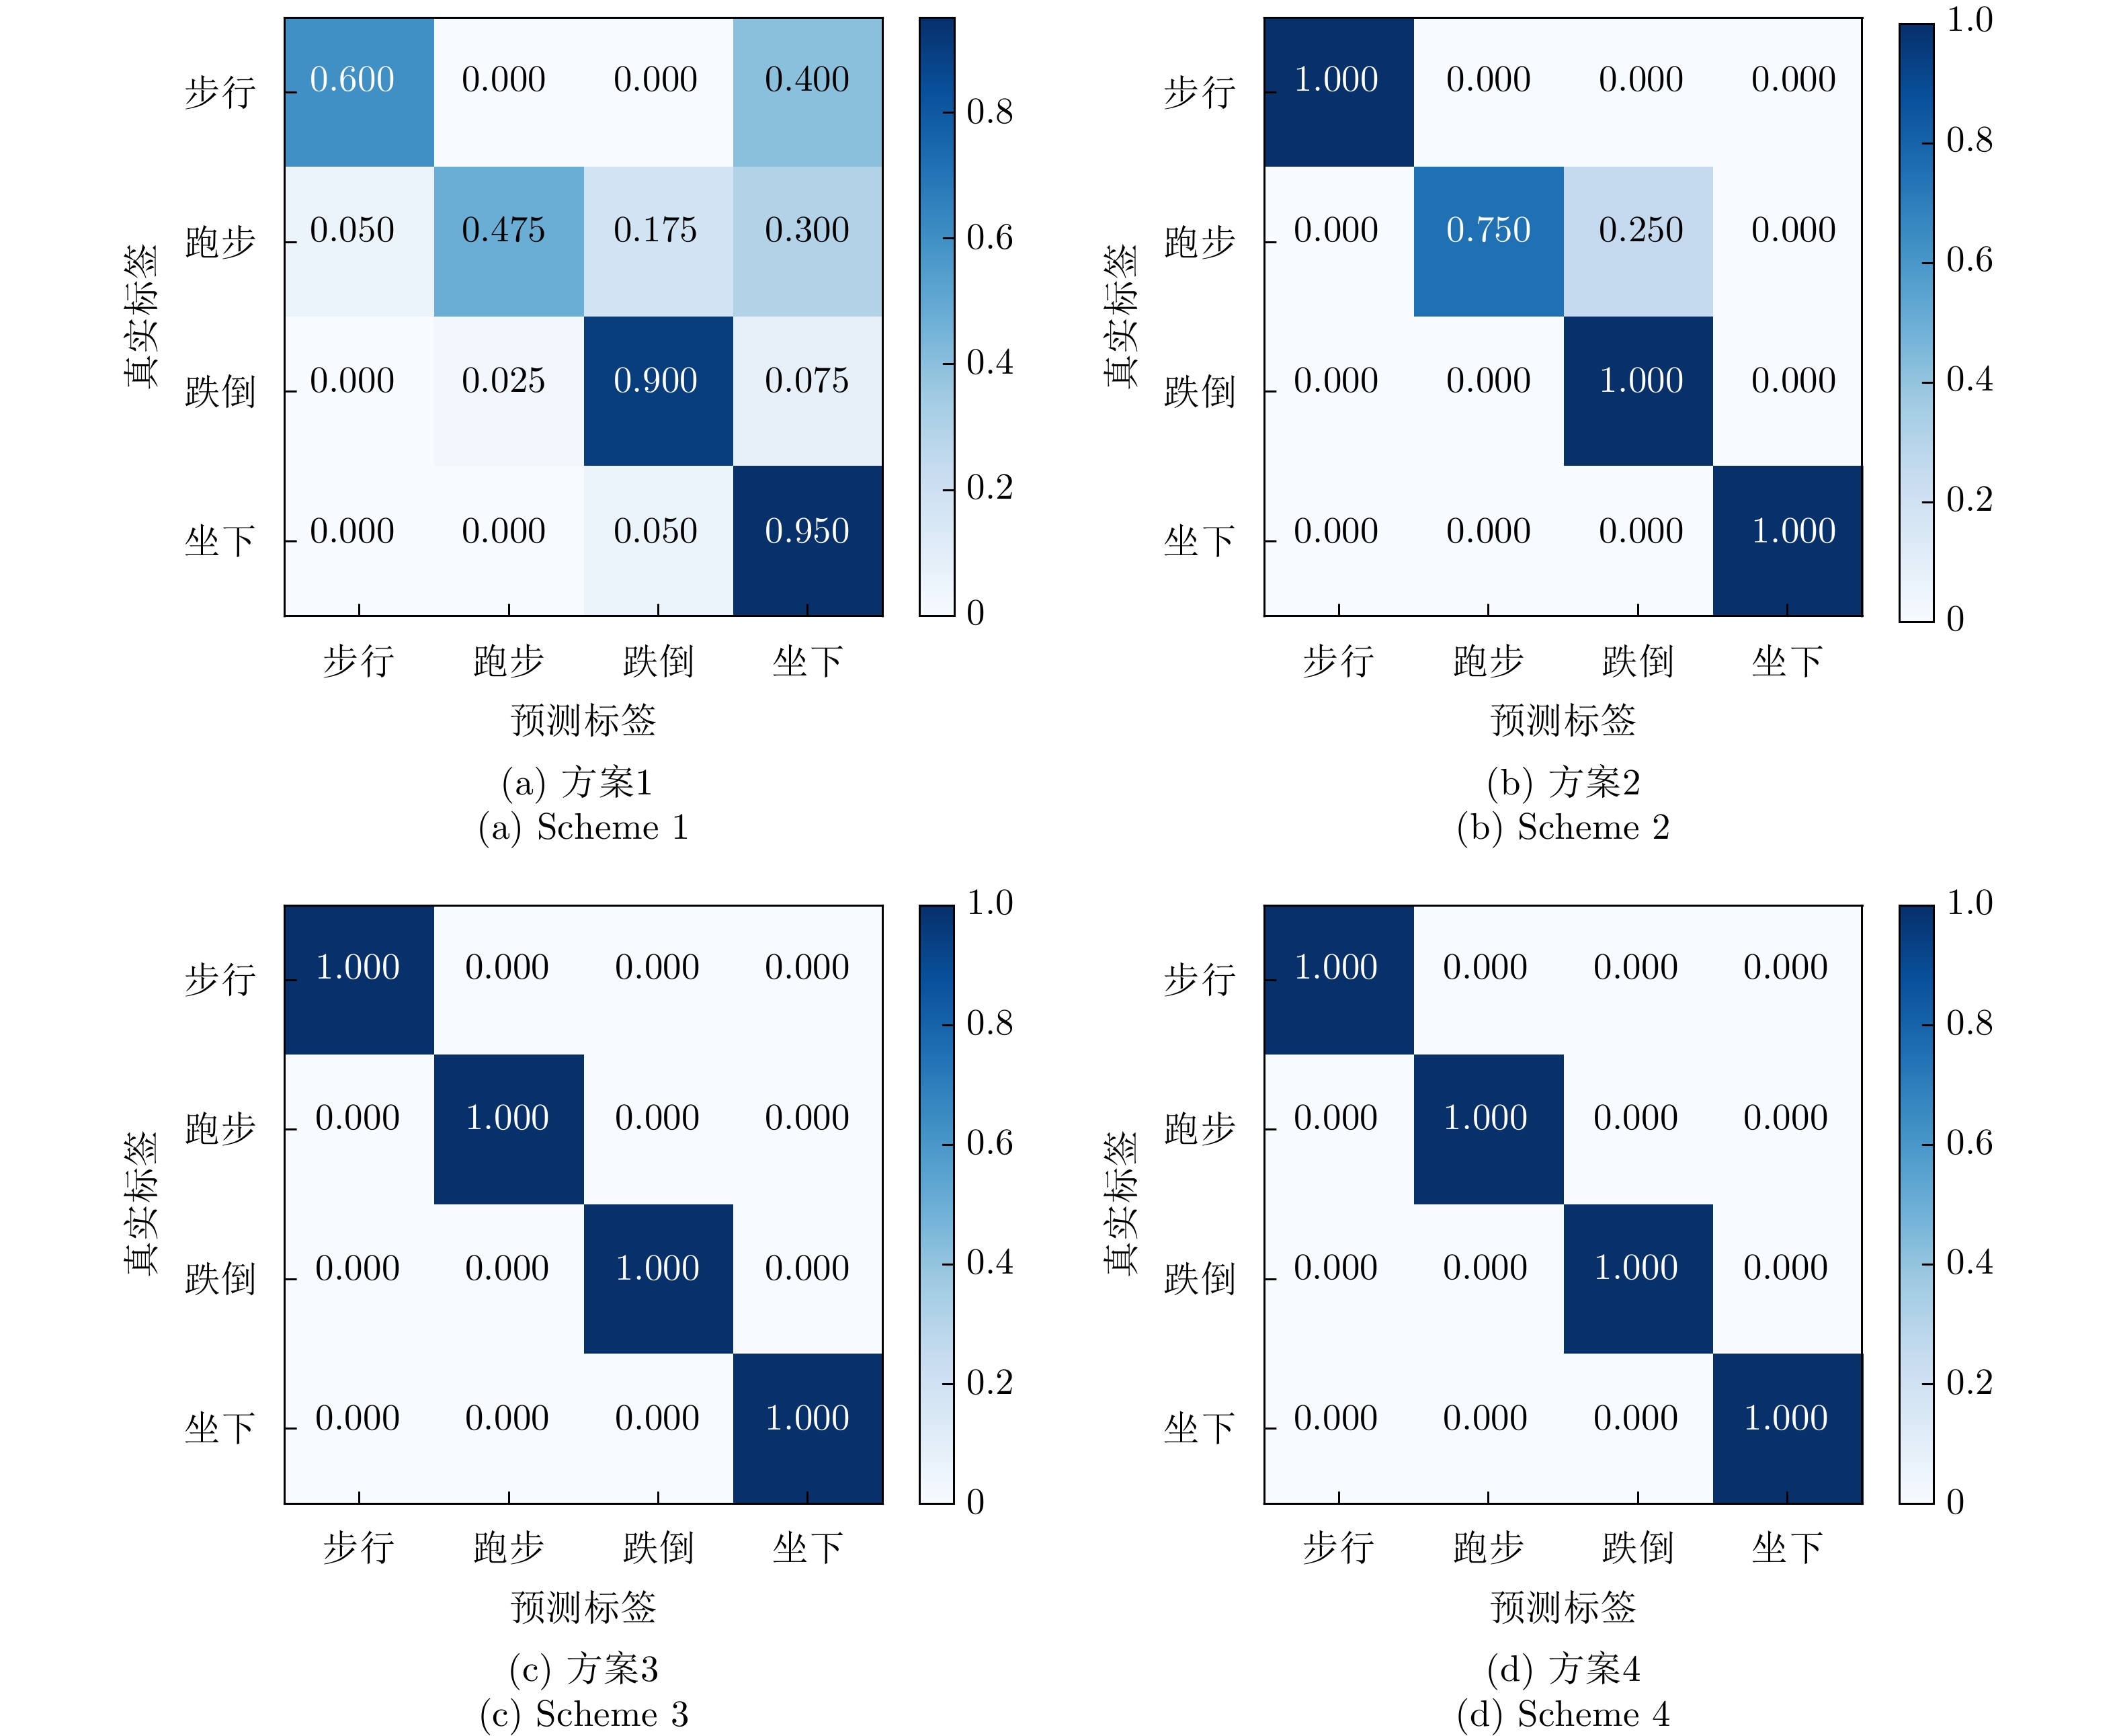
This study proposes a computer vision-assisted millimeter wave wireless channel simulation method incorporating the scattering characteristics of human motions. The aim is to rapidly and cost-effectively generate a training dataset for wireless human motion recognition, thereby avoiding the laborious and cost-intensive efforts associated with physical measurements. Specifically, the simulation process includes the following steps. First, the human body is modeled as 35 interconnected ellipsoids using a primitive-based model, and motion data of these ellipsoids are extracted from videos of human motion. A simplified ray tracing method is then used to obtain the channel response for each snapshot of the primitive model during the motion process. Finally, Doppler analysis is performed on the channel responses of the snapshots to obtain the Doppler spectrograms. The Doppler spectrograms obtained from the simulation can be used to train deep neural network for real wireless human motion recognition. This study examines the channel simulation and action recognition results for four common human actions (“walking” “running” “falling” and “sitting down”) in the 60 GHz band. Experimental results indicate that the deep neural network trained with the simulated dataset achieves an average recognition accuracy of 73.0% in real-world wireless motion recognition. Furthermore, he recognition accuracy can be increased to 93.75% via unlabeled transfer learning and fine-tuning with a small amount of actual data. -

-
References
[1] LI Chenning, CAO Zhichao, and LIU Yunhao. Deep AI enabled ubiquitous wireless sensing: A survey[J]. ACM Computing Surveys (CSUR), 2022, 54(2): 32. doi: 10.1145/3436729.[2] LIU Jian, LIU Hongbo, CHEN Yingying, et al. Wireless sensing for human activity: A survey[J]. IEEE Communications Surveys & Tutorials, 2020, 22(3): 1629–1645. doi: 10.1109/COMST.2019.2934489.[3] ZHANG Yi, ZHENG Yue, QIAN Kun, et al. Widar3.0: Zero-effort cross-domain gesture recognition with Wi-Fi[J]. IEEE Transactions on Pattern Analysis and Machine Intelligence, 2022, 44(11): 8671–8688. doi: 10.1109/TPAMI.2021.3105387.[4] 元志安, 周笑宇, 刘心溥, 等. 基于RDSNet的毫米波雷达人体跌倒检测方法[J]. 雷达学报, 2021, 10(4): 656–664. doi: 10.12000/JR21015.YUAN Zhian, ZHOU Xiaoyu, LIU Xinpu, et al. Human fall detection method using millimeter-wave radar based on RDSNet[J]. Journal of Radars, 2021, 10(4): 656–664. doi: 10.12000/JR21015.[5] 金添, 何元, 李新羽, 等. 超宽带雷达人体行为感知研究进展[J]. 电子与信息学报, 2022, 44(4): 1147–1155. doi: 10.11999/JEIT211044.JIN Tian, HE Yuan, LI Xinyu, et al. Advances in human activity sensing using ultra-wide band radar[J]. Journal of Electronics & Information Technology, 2022, 44(4): 1147–1155. doi: 10.11999/JEIT211044.[6] SUN Hongbo, CHIA L G, and RAZUL S G. Through-wall human sensing with WiFi passive radar[J]. IEEE Transactions on Aerospace and Electronic Systems, 2021, 57(4): 2135–2148. doi: 10.1109/TAES.2021.3069767.[7] LI Jie, YU Chao, LUO Yan, et al. Passive motion detection via mmWave communication system[C]. IEEE 95th Vehicular Technology Conference: (VTC2022-Spring), Helsinki, Finland, 2022: 1–6. doi: 10.1109/VTC2022-Spring54318.2022.9860809.[8] DU Rui, HUA Haocheng, XIE Hailiang, et al. An overview on IEEE 802.11bf: WLAN sensing[J]. IEEE Communications Surveys & Tutorials, 2024. doi: 10.1109/COMST.2024.3408899.[9] ZHANG Meihong, DU Rui, PENG Xiaohui, et al. Channel models for WLAN sensing systems[R]. IEEE 802.11-21/0782r5, 2021.[10] LI Guoliang, WANG Shuai, LI Jie, et al. Wireless sensing with deep spectrogram network and primitive based autoregressive hybrid channel model[C]. IEEE 22nd International Workshop on Signal Processing Advances in Wireless Communications (SPAWC), Lucca, Italy, 2021: 481–485. doi: 10.1109/SPAWC51858.2021.9593198.[11] ZHOU Pei, CHENG Kaijun, HAN Xiao, et al. IEEE 802.11ay-based mmWave WLANs: Design challenges and solutions[J]. IEEE Communications Surveys & Tutorials, 2018, 20(3): 1654–1681. doi: 10.1109/COMST.2018.2816920.[12] ASSASA Hany, et al. A collection of open-source tools to simulate IEEE 802.11ad/ay WLAN networks in network simulator ns-3[EB/OL]. https://github.com/wigig-tools.[13] LI Guoliang, WANG Shuai, LI Jie, et al. Integrated sensing and communication from learning perspective: An SDP3 approach[J]. IEEE Internet of Things Journal, 2024, 11(4): 5589–5603. doi: 10.1109/JIOT.2023.3309837.[14] VISHWAKARMA S, LI Wenda, TANG Chong, et al. SimHumalator: An open-source end-to-end radar simulator for human activity recognition[J]. IEEE Aerospace and Electronic Systems Magazine, 2022, 37(3): 6–22. doi: 10.1109/MAES.2021.3138948.[15] BOULIC R, THALMANN N M, and THALMANN D. A global human walking model with real-time kinematic personification[J]. The Visual Computer, 1990, 6(6): 344–358. doi: 10.1007/BF01901021.[16] LI Jiamu, ZHANG Dongheng, CHEN Qi, et al. SIMFALL: A data generator for RF-based fall detection[C]. ICASSP 2024 - 2024 IEEE International Conference on Acoustics, Speech and Signal Processing (ICASSP), Seoul, Korea, 2024: 8165–8169. doi: 10.1109/ICASSP48485.2024.10446234.[17] CHI Guoxuan, YANG Zheng, WU Chenshu, et al. RF-diffusion: Radio signal generation via time-frequency diffusion[C]. The 30th Annual International Conference on Mobile Computing and Networking, Washington, USA, 2024: 77–92. doi: 10.1145/3636534.3649348.[18] REN Zhenyu, LI Guoliang, JI Chenqing, et al. CASTER: A computer-vision-assisted wireless channel simulator for gesture recognition[J]. IEEE Open Journal of the Communications Society, 2024, 5: 3185–3195. doi: 10.1109/OJCOMS.2024.3398016.[19] WANG Jinbao, TAN Shujie, ZHEN Xiaotong, et al. Deep 3D human pose estimation: A review[J]. Computer Vision and Image Understanding, 2021, 210: 103225. doi: 10.1016/j.cviu.2021.103225.[20] StereoLabs. Stereolabs docs: API reference, tutorials, and integration[EB/OL]. https://www.stereolabs.com/docs.[21] ZHENG Ce, WU Wenhan, CHEN Chen, et al. Deep learning-based human pose estimation: A survey[J]. ACM Computing Surveys, 2024, 56(1): 11. doi: 10.1145/3603618.[22] TROTT K D. Stationary phase derivation for RCS of an ellipsoid[J]. IEEE Antennas and Wireless Propagation Letters, 2007, 6: 240–243. doi: 10.1109/LAWP.2007.891521.[23] DE BOOR C. A Practical Guide to Splines[M]. New York, USA: Springer, 1978: 40–48.[24] ZHUANG Fuzhen, QI Zhiyuan, DUAN Keyu, et al. A comprehensive survey on transfer learning[J]. Proceedings of the IEEE, 2021, 109(1): 43–76. doi: 10.1109/JPROC.2020.3004555.[25] HE Kaiming, ZHANG Xiangyu, REN Shaoqing, et al. Deep residual learning for image recognition[C]. 2016 IEEE Conference on Computer Vision and Pattern Recognition (CVPR), Las Vegas, USA, 2016: 770–778. doi: 10.1109/CVPR.2016.90.[26] TZENG E, HOFFMAN J, SAENKO K, et al. Adversarial discriminative domain adaptation[C]. 2017 IEEE Conference on Computer Vision and Pattern Recognition (CVPR), Honolulu, USA, 2017: 2962–2971. doi: 10.1109/CVPR.2017.316.[27] National Instruments. USRP-2954[EB/OL]. https://www.ni.com/en-us/shop/model/usrp-2954.html.[28] Sivers IMA. EVK 06002/00[EB/OL]. https://www.siversima.com/product/evk-06002-00/.[29] WANG Zhou, BOVIK A C, SHEIKH H R, et al. Image quality assessment: From error visibility to structural similarity[J]. IEEE Transactions on Image Processing, 2004, 13(4): 600–612. doi: 10.1109/TIP.2003.819861. -
Proportional views

- Publishing Ethics
- Journal Insights
- Abstracting & Indexing
- Peer Review Policies
- Guide for Authors
- Conference
- ISSN 2095-283X (Print)ISSN 2097-339X (Online)
- CN 10-1030/TN
- CODEN LXEUAO
About Journal
- Sponsor: China Radio Detection and Ranging Industry Association (CRIA)
- Phone: 010-58887062
- Email:radars@aircas.ac.cn
- Publisher: Leida Xuebao Bianjibu (Editorial office of the Journal of Radars)
Contacts Us

京ICP备20021838号-14
Supported by: Beijing Renhe Information Technology Co. Ltd

Export File
Citation
Format
Content
 DownLoad:


- Figure 1. Illustration of channel simulation scenario and primitive-based human model with 34 keypoints and 35 primitives
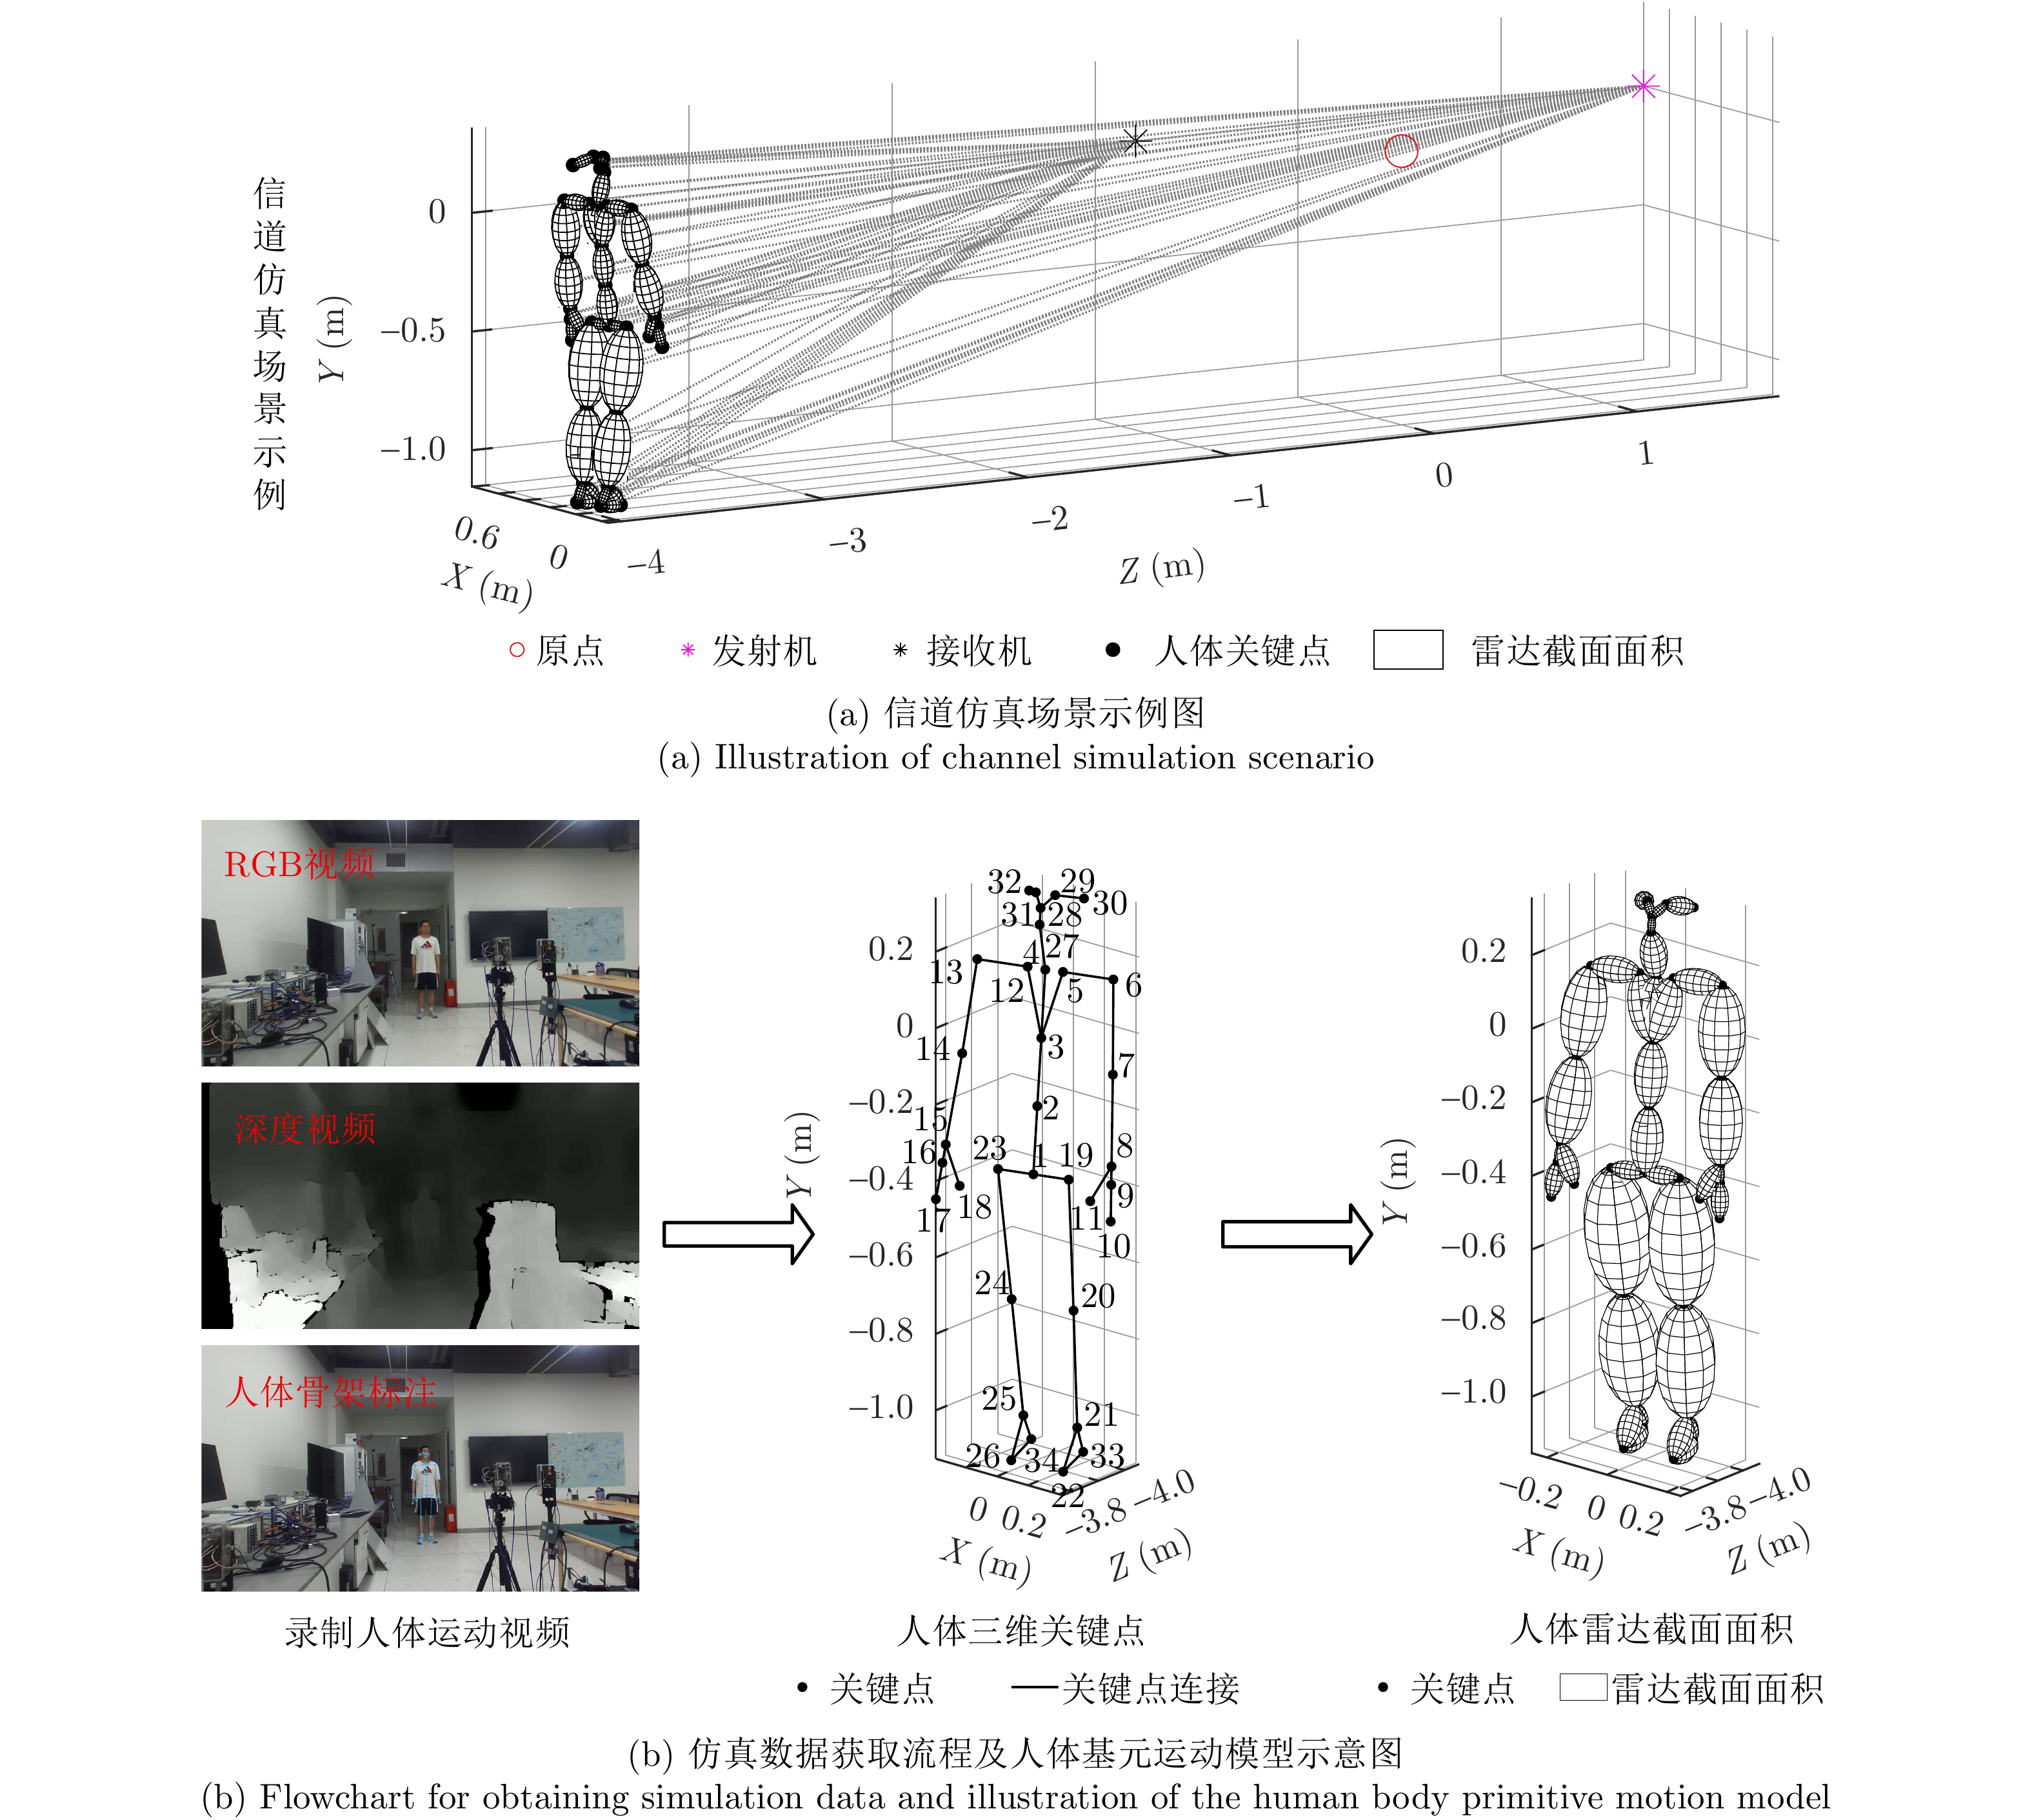
- Figure 2. Illustration of bistatic Radar Cross Section (RCS) calculation parameters for n-th ellipsoid
- Figure 3. An overview of unsupervised transfer learning (dashed boxes represent the neural network parameters that remain unchanged during training or testing phases, while solid boxes indicate neural network parameters that are continuously updated throughout the training process)
- Figure 4. Illustration of facilities and scenario of experiment
- Figure 5. Illustration of the simulated and experimental spectrogram datasets
- Figure 6. Spectrogram comparison of four human motions generated by simulation and experiment
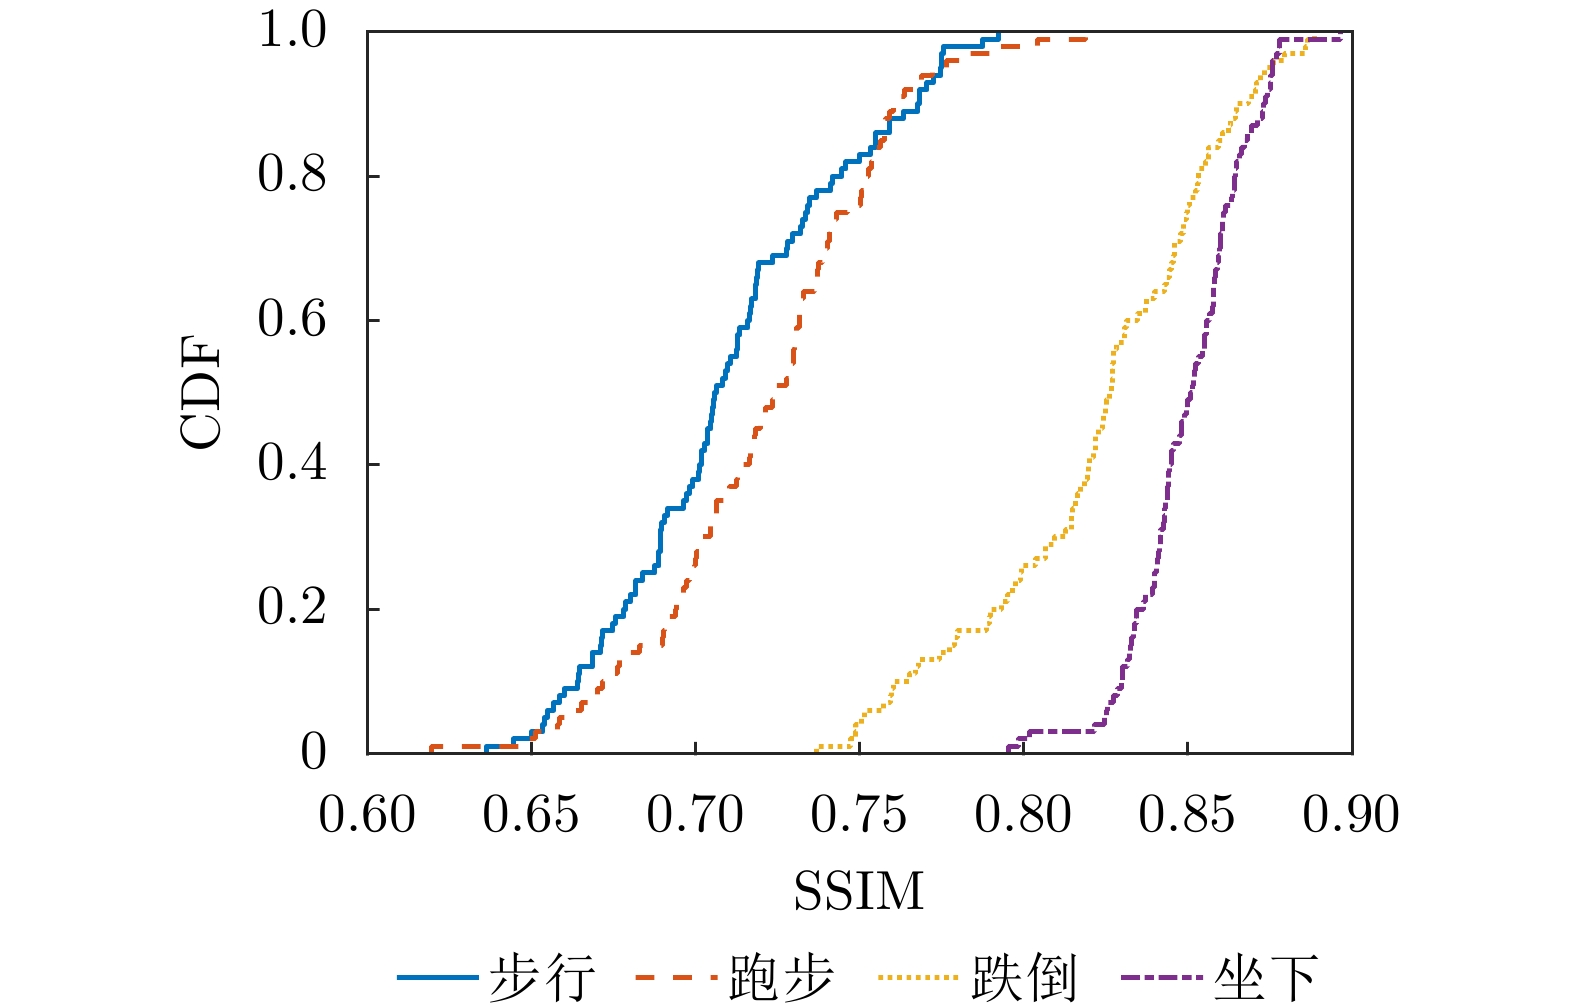
- Figure 7. The CDF curves of SSIM values between simulated and measured samples for different human motions
- Figure 8. Human motion recognition result
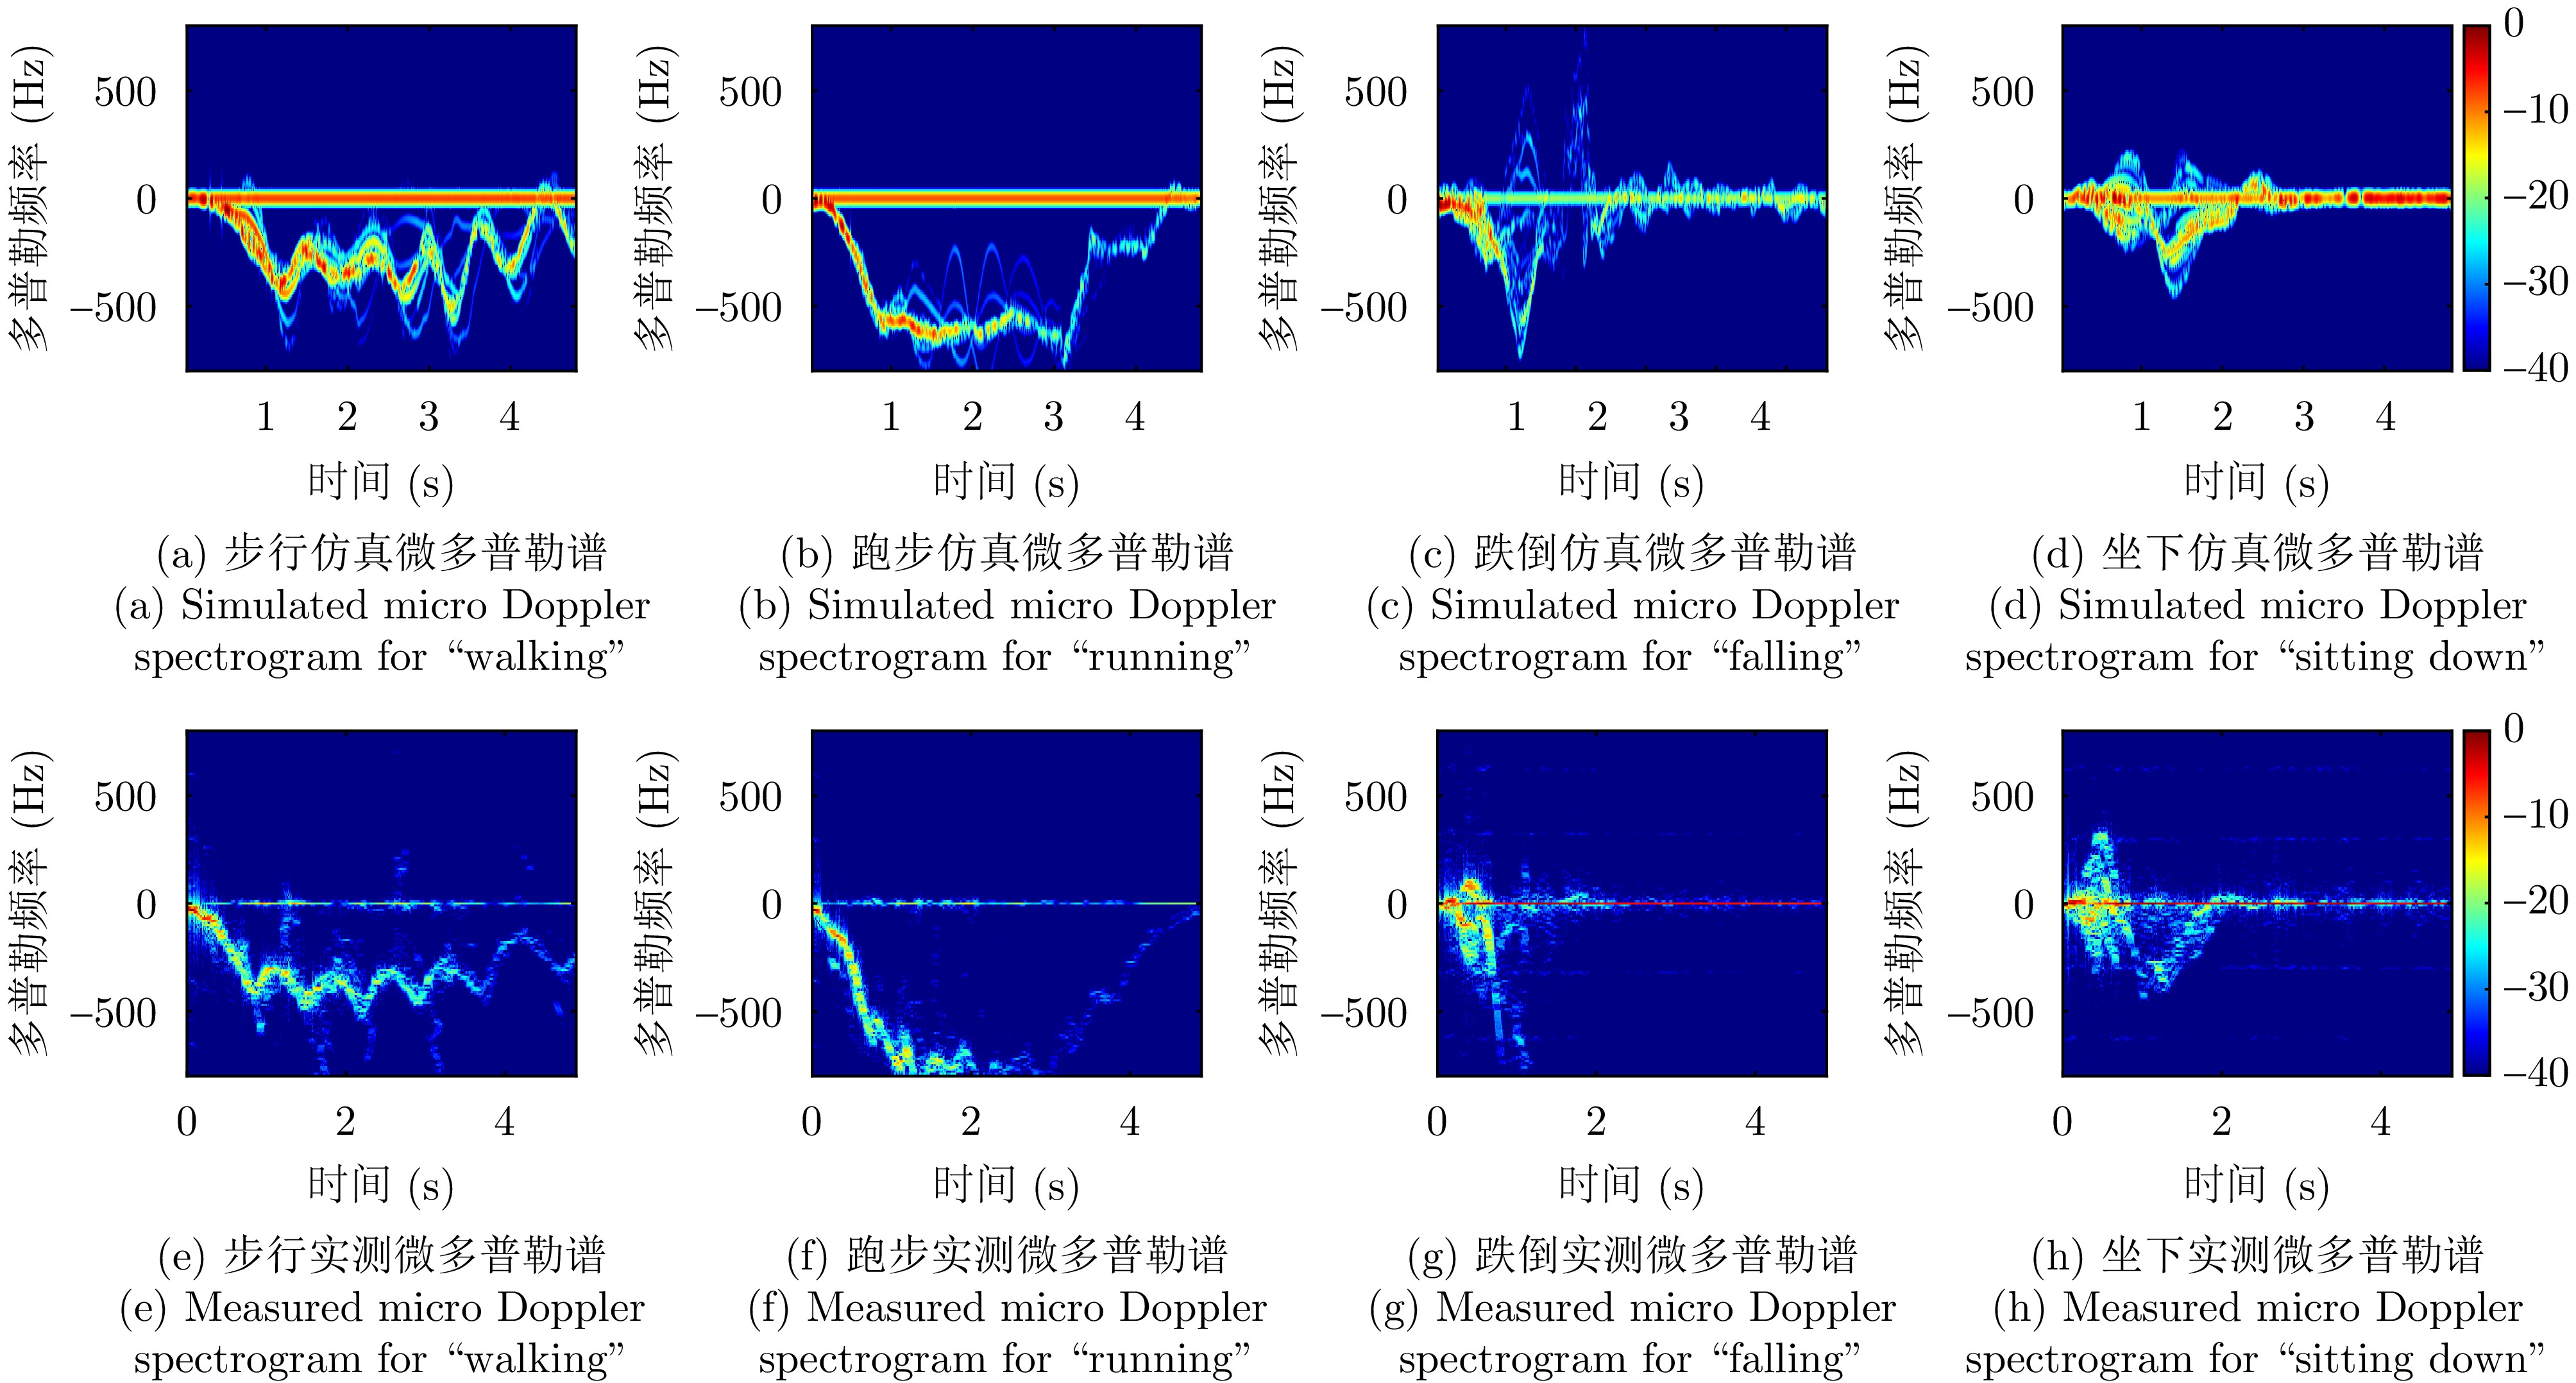
- Figure 9. Spectrogram comparison of four human motions generated by simulation (experiment for 5 seconds)