
 作者中心
作者中心 专家审稿
专家审稿 责编办公
责编办公 编辑办公
编辑办公
Estimation of the Minimum Number of Acquisitions for Coprime Tomographic Synthetic Aperture Radar
-
摘要: 在层析SAR技术的实际应用中,航过数量通常受高昂成本等因素的限制。互质层析SAR技术通过稀疏分布航过位置、延长基线孔径长度,可以降低所需的航过数量。当采用子空间方法开展互质层析SAR重构处理时,为了获得可靠的层析图,研究最少航过数量估计问题。考虑到子空间方法的重构性能受多个参数的影响,因此航过数量的选择必须综合考虑所有相关参数对重构结果的影响。为此,通过样本特征值分析方式建立子空间方法的可靠性保证条件。根据这个可靠性保证条件,提出了一种估计最少航过数量的方法。与传统的最少航过数量估计方法相比,所提方法的优势在于:同时考虑所有的相关参数,且具有解析的数学描述式。最后,仿真实验证实由所提方法估算的航过数量确实接近最小,且能够保证重构结果可靠。
-
关键词:
- 层析合成孔径雷达 /
- 互质阵列 /
- 最少航过数量 /
- 样本协方差矩阵的特征值 /
- 散射点数量估计
Abstract: In the practical application of Tomographic Synthetic Aperture Radar (TomoSAR), the number of acquisitions is usually restricted due to their expensive cost. A coprime TomoSAR technique was proposed to reduce the required number of acquisitions by sparsely distributing acquisitions and elongating baseline aperture. To guarantee a reliable tomogram, this study aims to determine the minimum number of acquisitions for the coprime TomoSAR when adopting a subspace method for performing the tomographic reconstruction. However, the performance of the subspace method depends on multiple parameters. In light of this, the selection of acquisition times has to comprehensively weigh the effects of all these parameters on the reconstruction performance. To this end, a prerequisite for reliable reconstruction is established by quantifying the relationship between the sample eigenvalues and all related parameters. Compared with conventional estimation approaches for the minimum number of acquisitions, the proposed approach has twofold advantages of containing all related parameters and of having a closed-form expression. Finally, the simulation experiments verify that the number of acquisitions estimated by our approach is close to the minimum and can guarantee reconstruction reliability. -

图 2 本文提出的最少航过数量估计方法的流程图
Figure 2. The flow chart for the propose approach to estimate the minimum number of acquisitions
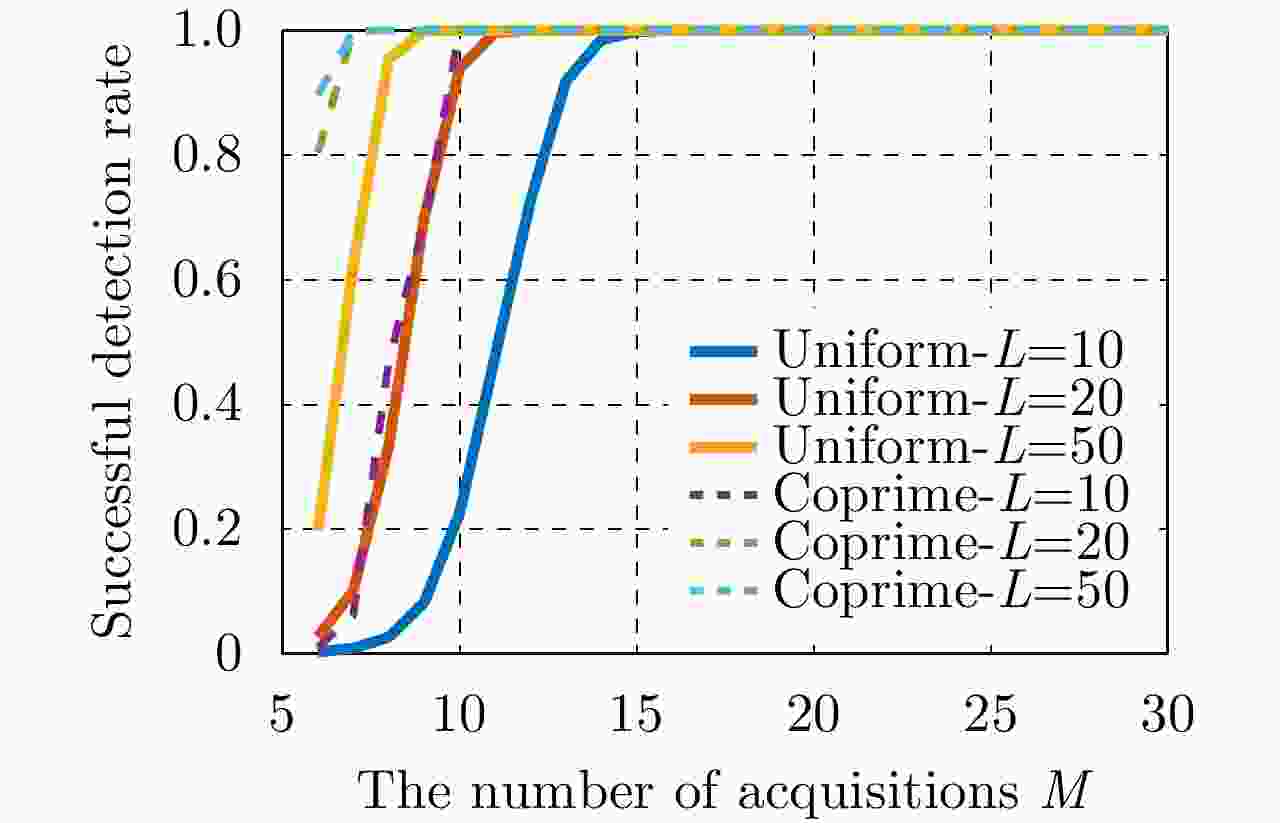
图 3 基于样本特征值检测方法的正确检测概率随航过数量的变化曲线(K=2; SNR1=0 dB, SNR2=10 dB; Δh=1 m)
Figure 3. Successful detection rate varies with the number of acquisitions (K=2; SNR1=0 dB, SNR2=10 dB; Δh=1 m)
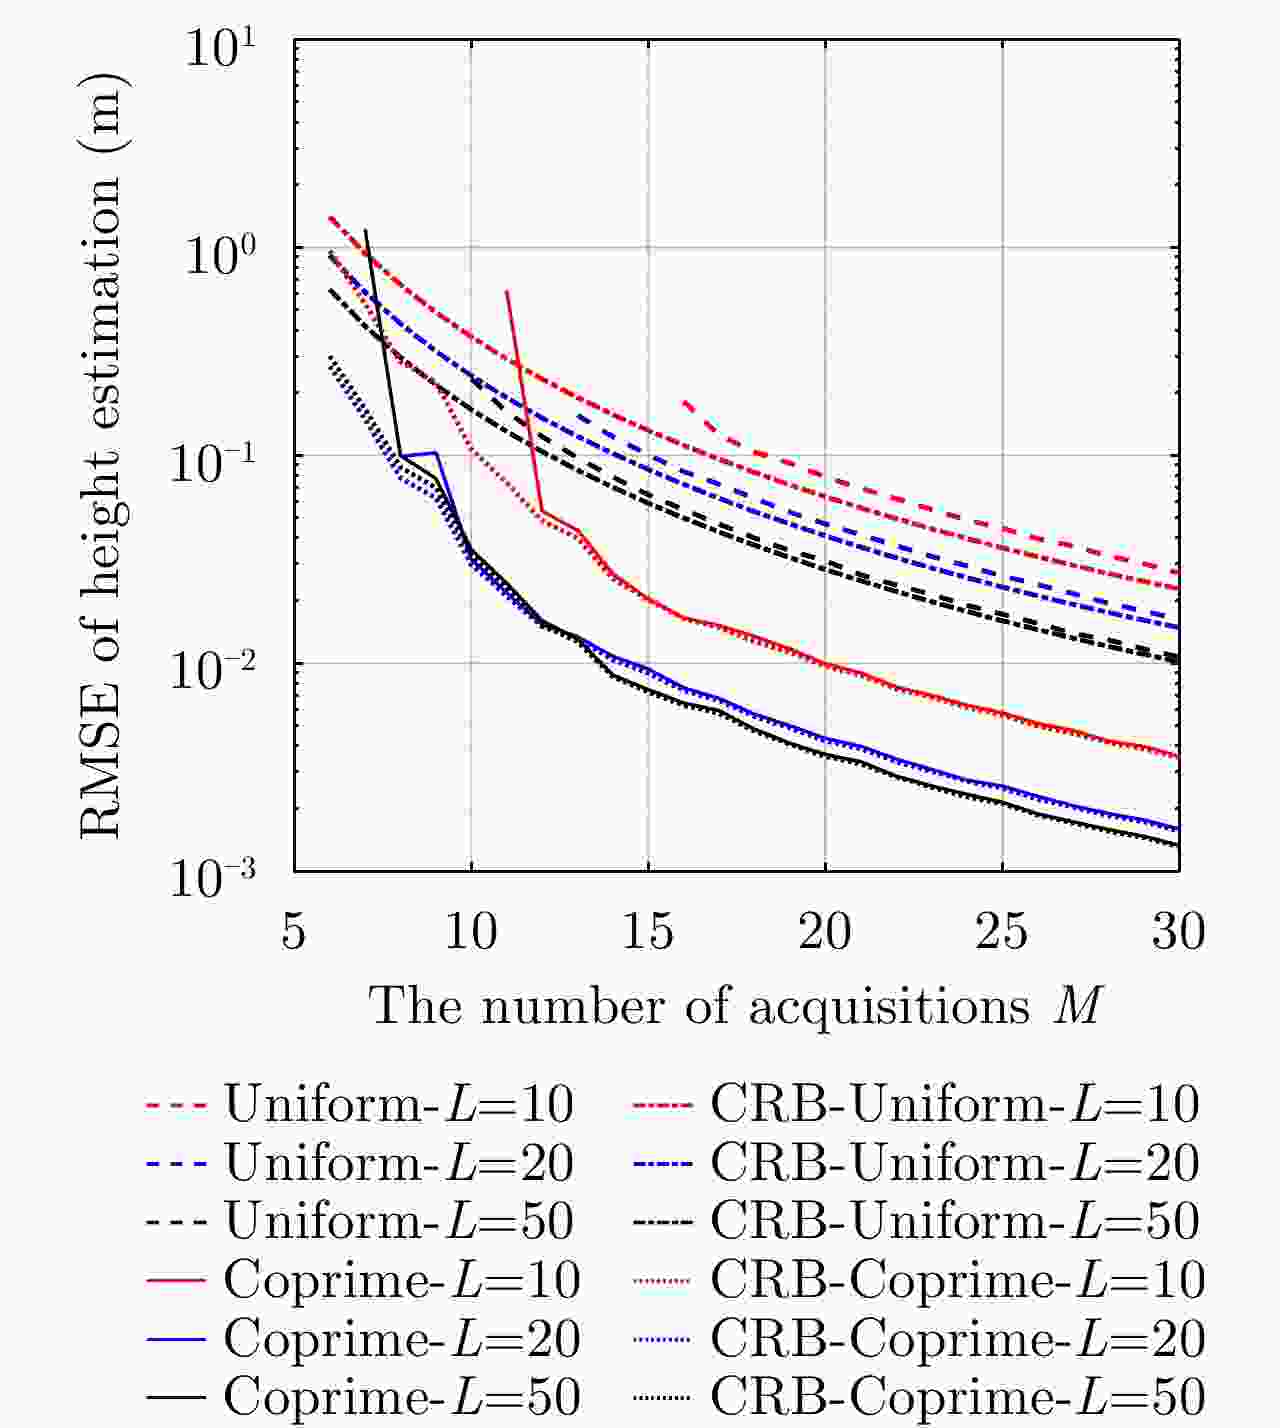
图 4 高度估计的RMSE随航过数量的变化(K=2; SNR1=0 dB, SNR2=10 dB; Δh=1 m)
Figure 4. The RMSE of the height estimation varies with the number of acquisitions (K=2; SNR1=0 dB, SNR2=10 dB; Δh=1 m)
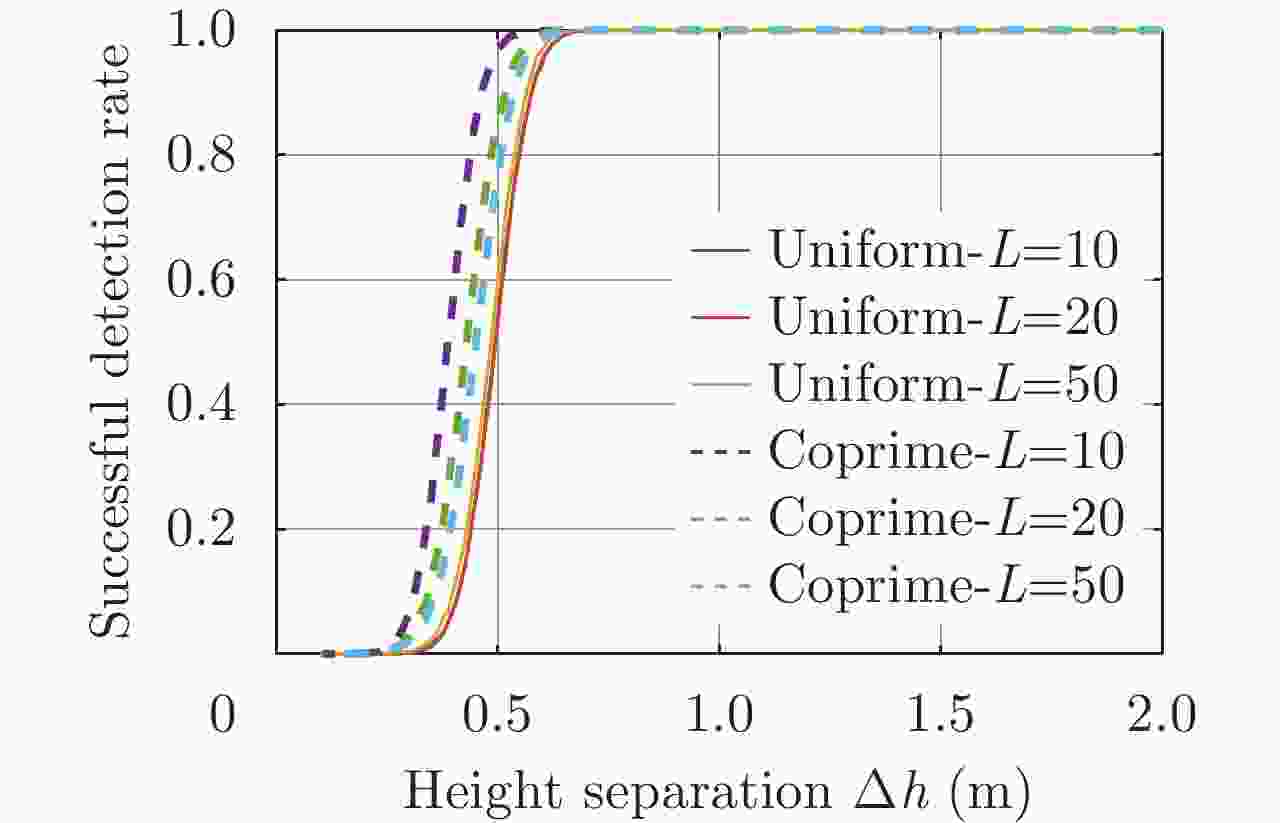
图 5 基于样本特征值的信号检测方法的正确检测概率随高度间隔的变化曲线(K=2; SNR1=0 dB, SNR2=10 dB; ρh=1 m)
Figure 5. Successful detection rate varies with the height separation (K=2; SNR1=0 dB, SNR2=10 dB; ρh=1 m)

图 6 高度估计的RMSE随高度间隔的变化曲线(K=2; SNR1=0 dB, SNR2=10 dB; ρh=1 m)
Figure 6. The RMSE of the height estimation varies with the height separation (K=2; SNR1=0 dB, SNR2=10 dB; ρh=1 m)
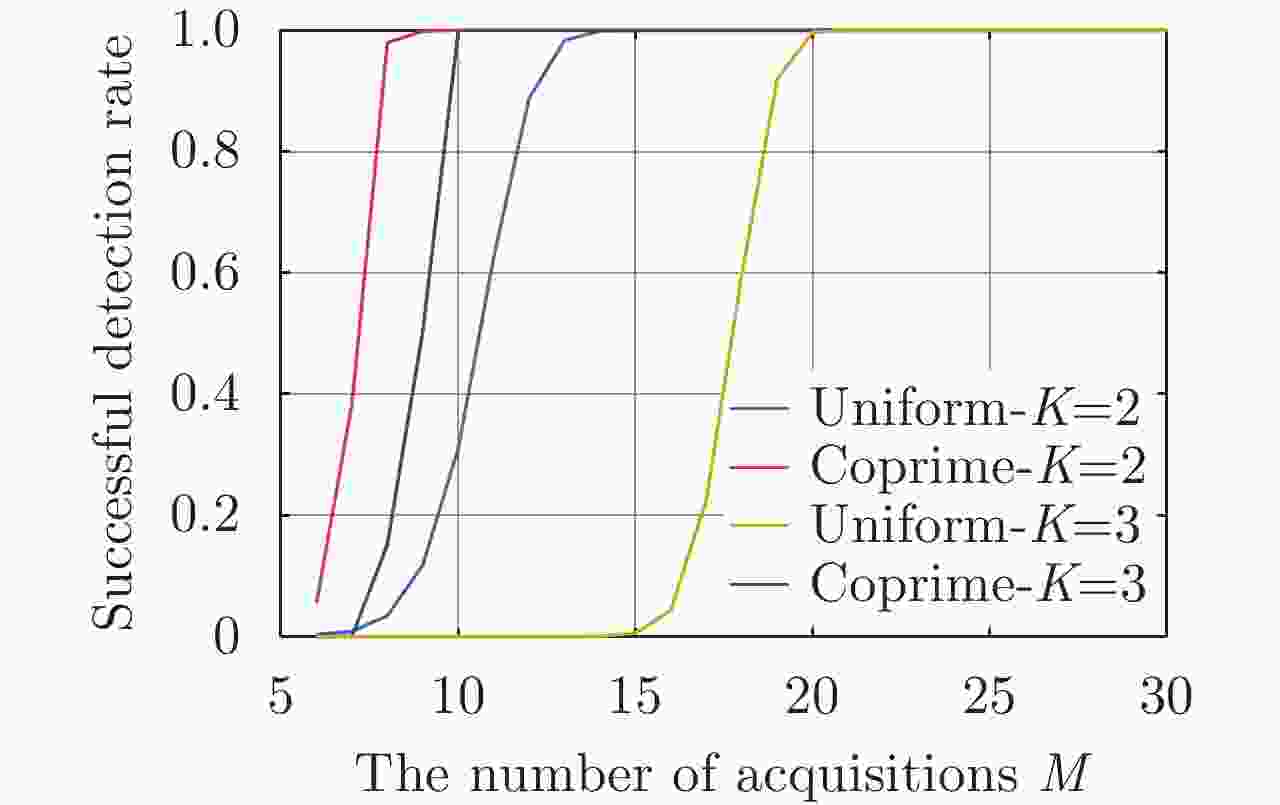
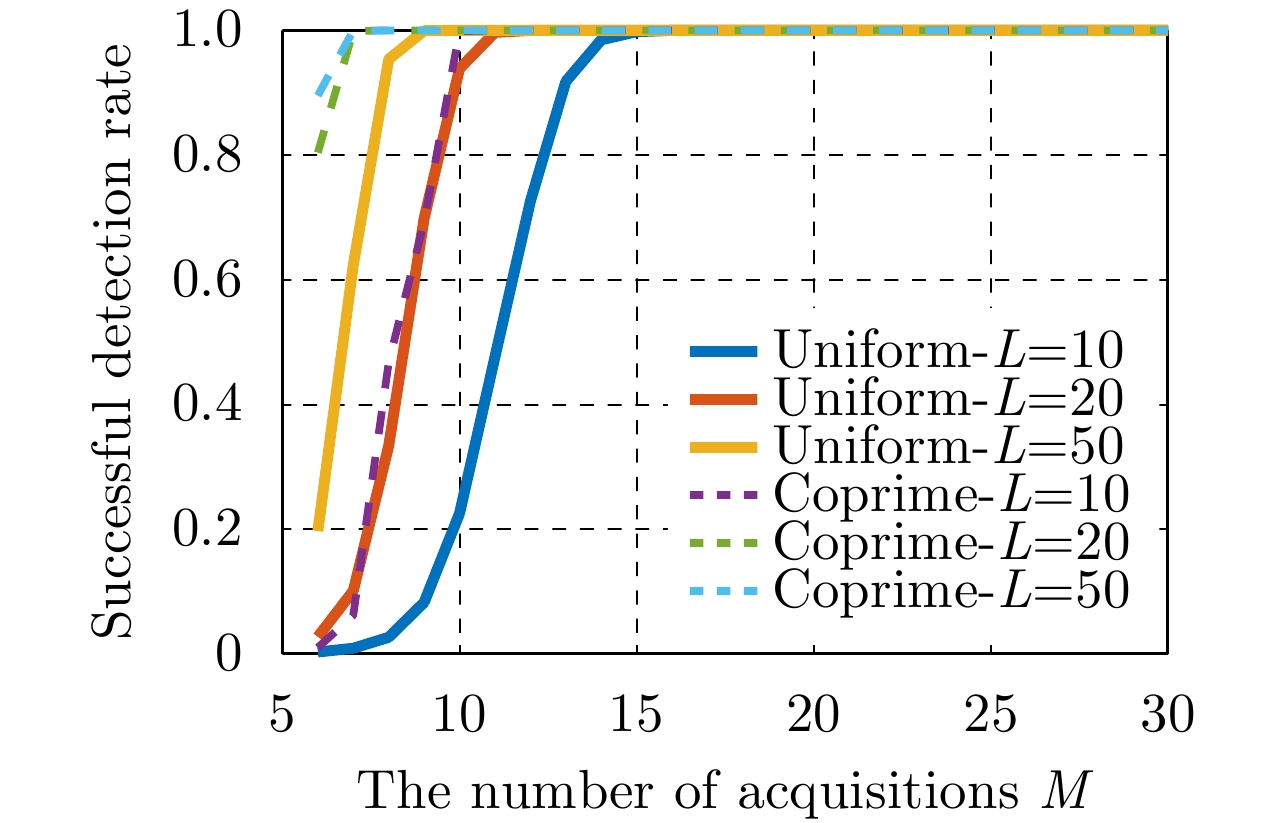
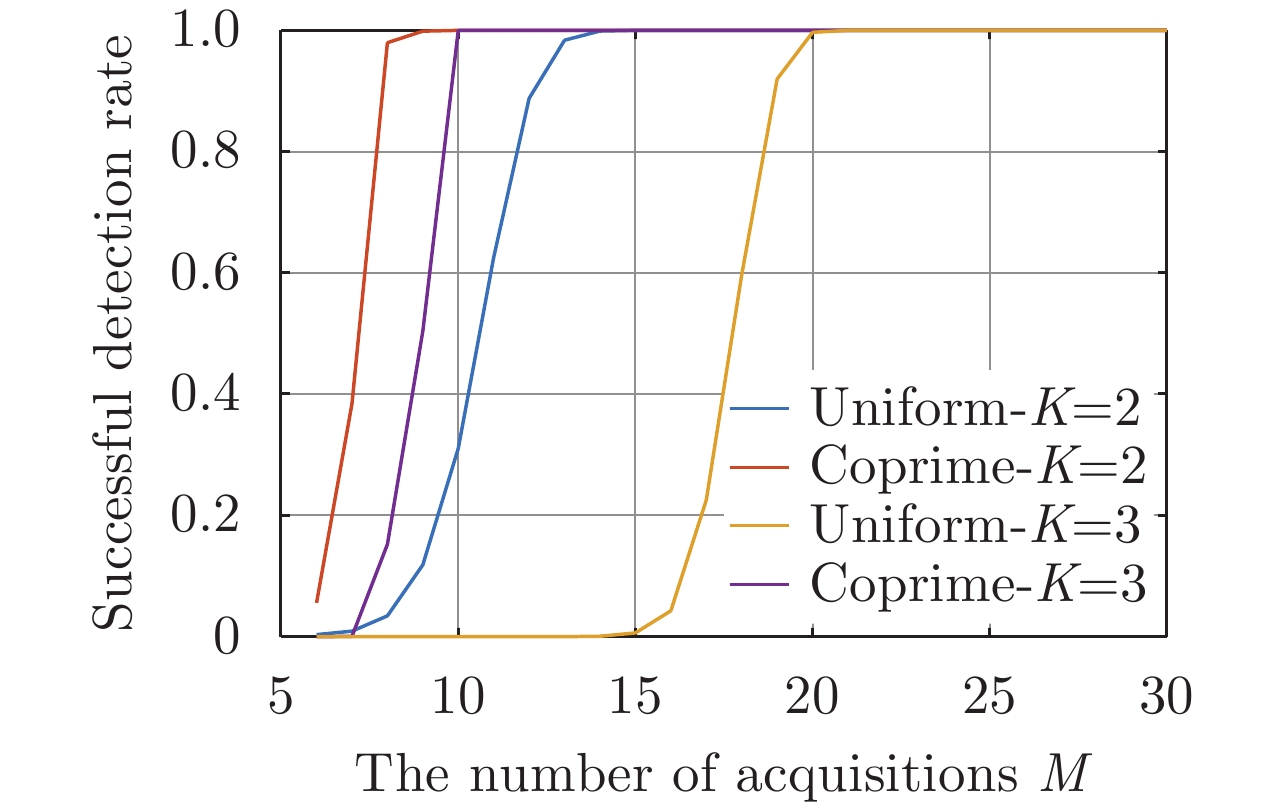
图 7 基于样本特征值检测方法的正确检测概率随航过数量的变化曲线(Δh=1 m; L=20;所有散射点信噪比均等于0 dB)
Figure 7. Successful detection rate varies with the number of acquisitions (Δh=1 m; L=20; all the SNRs=0 dB)

图 8 高度估计的RMSE随航过数量的变化曲线(Δh=1 m; L=20;所有散射点信噪比均等于0 dB)
Figure 8. The RMSE of the height estimation varies with the number of acquisitions (Δh=1 m; L=20; all the SNRs=0 dB)

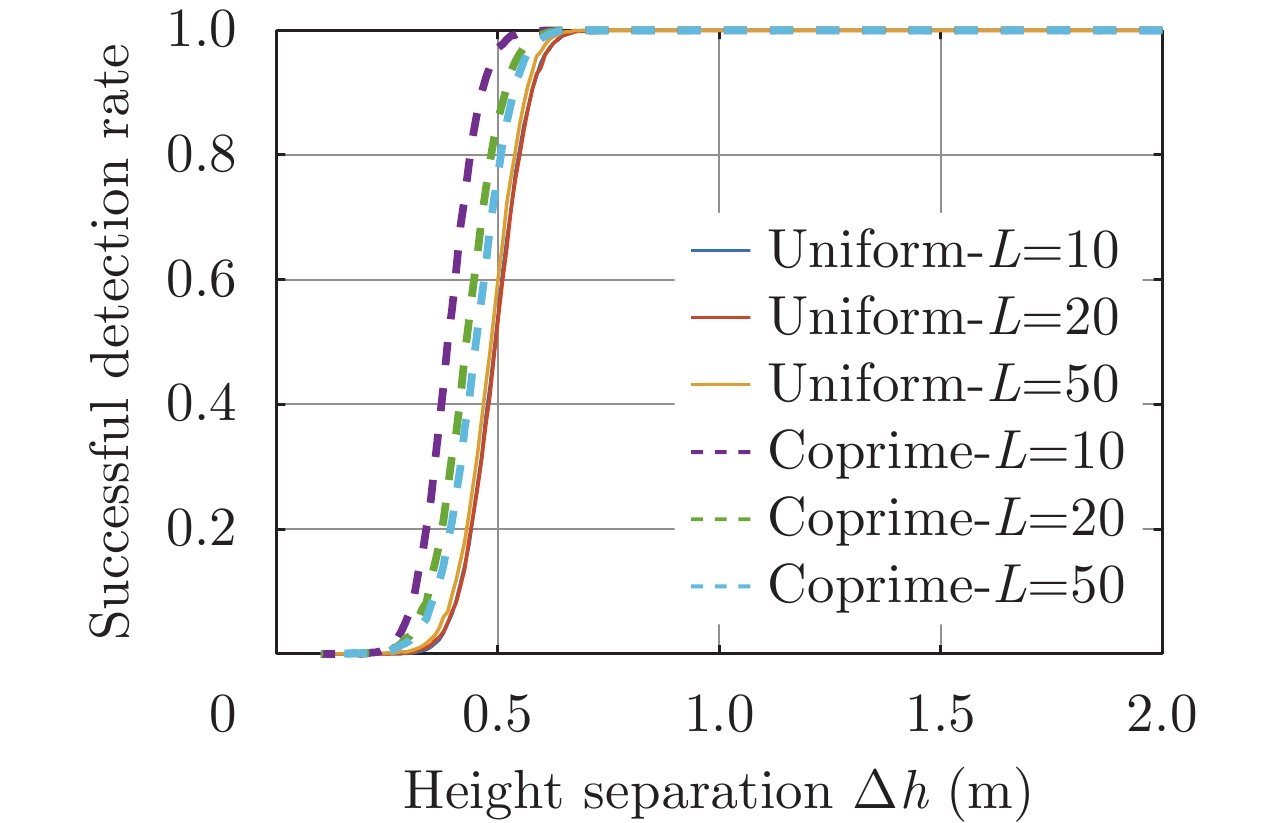
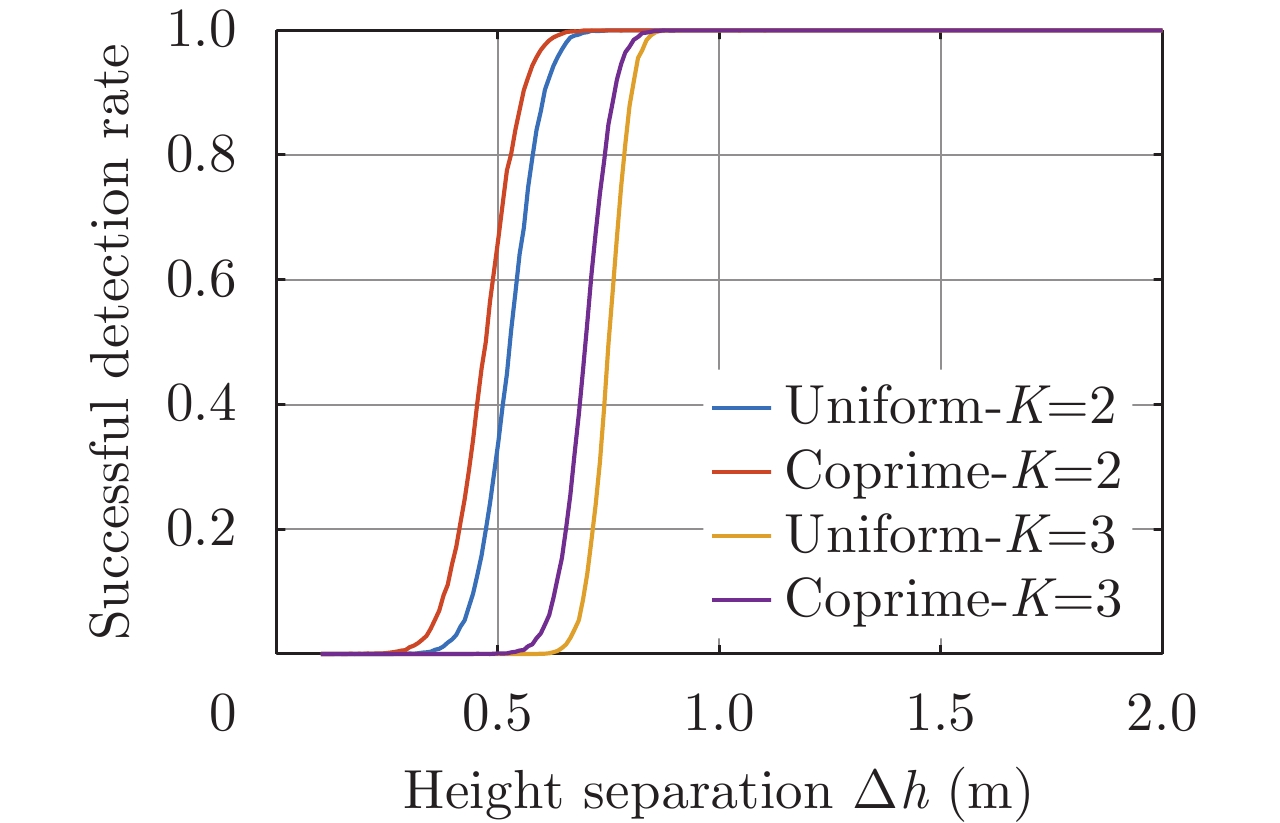
图 9 基于样本特征值检测方法的正确检测概率随高度间隔的变化曲线(L=20;所有散射点信噪比均等于0 dB;ρh=1 m)
Figure 9. Successful detection rate varies with the height separation (L=20; all the SNRs=0 dB; ρh=1 m)

图 10 高度估计的RMSE随高度间隔的变化曲线(L=20;所有散射点信噪比均等于0 dB;ρh=1 m)
Figure 10. The RMSE of the height estimation varies with the height separation (L=20; all the SNRs=0 dB; ρh=1 m)
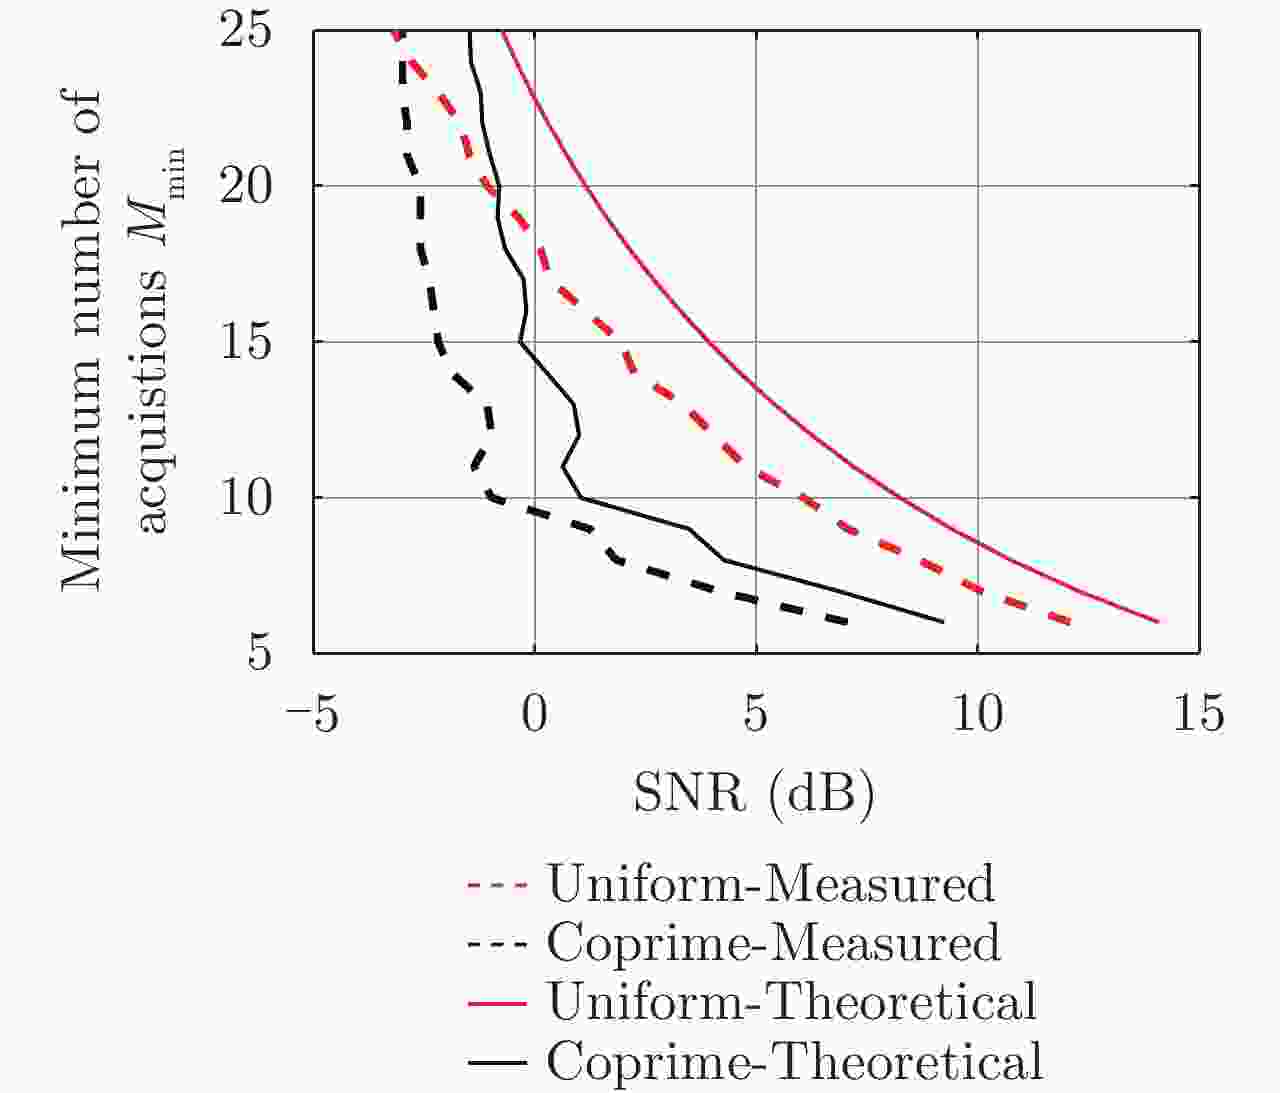
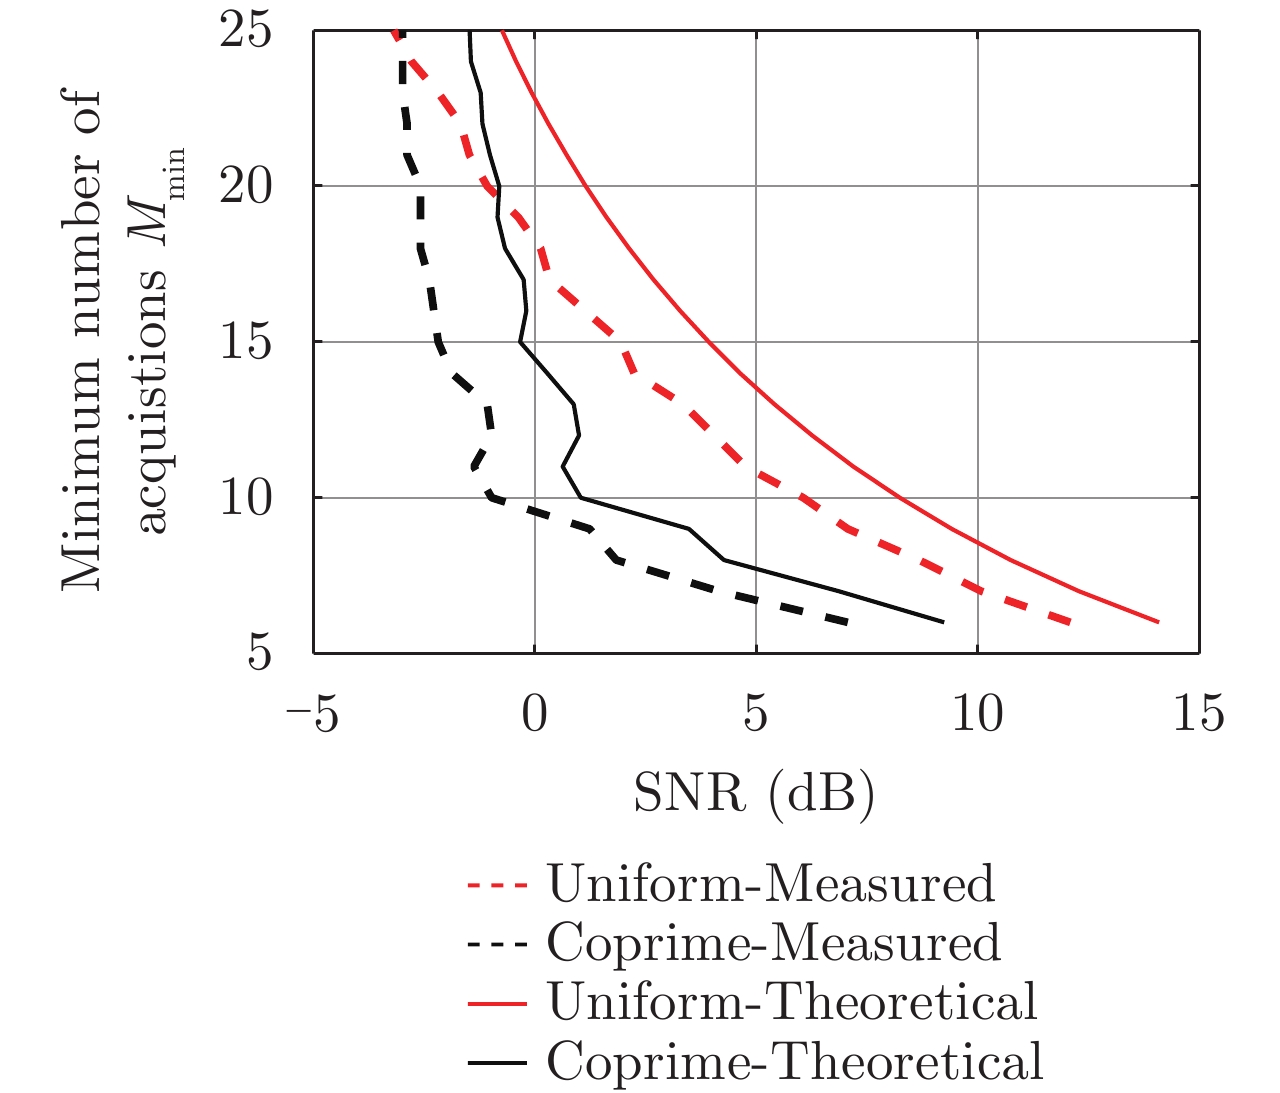
图 11 最少航过数量与信噪比之间的约束关系(K=2; Δh=1 m; L=10)
Figure 11. The constraint relationship between the minimum number of acquisitions and the SNR (K=2; Δh=1 m; L=10)

图 12 |<a1, a2>|/M随航过数量的变化(d=7.5 m; K=2; Δh=1 m)
Figure 12. |<a1, a2>|/M varies with the number of acquisitions (d=7.5 m; K=2; Δh=1 m)

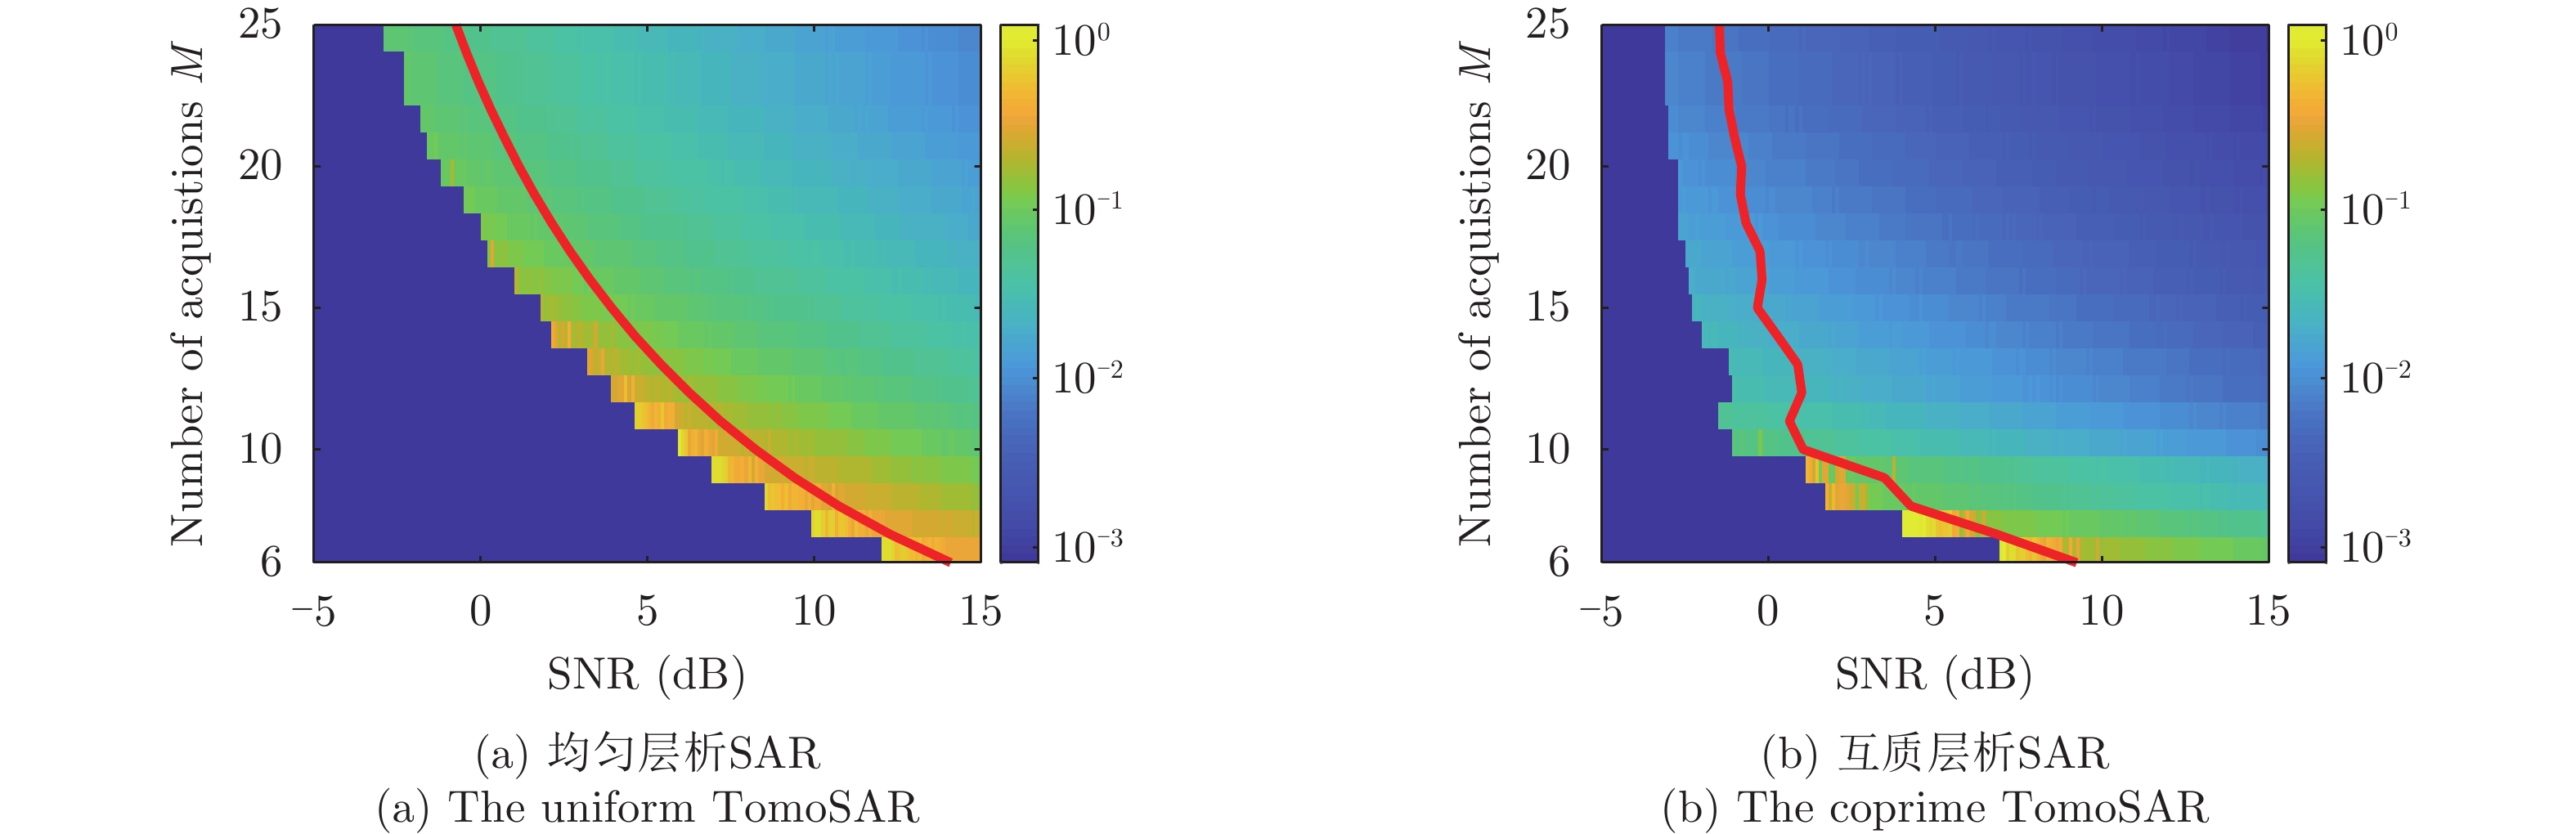
图 13 高度估计RMSE随航过数量和信噪比的相变图(K=2; Δh=1 m; L=10)
Figure 13. The phase transition of the RMSE as a function of the number of acquisitions and the SNR (K=2; Δh=1 m; L=10)
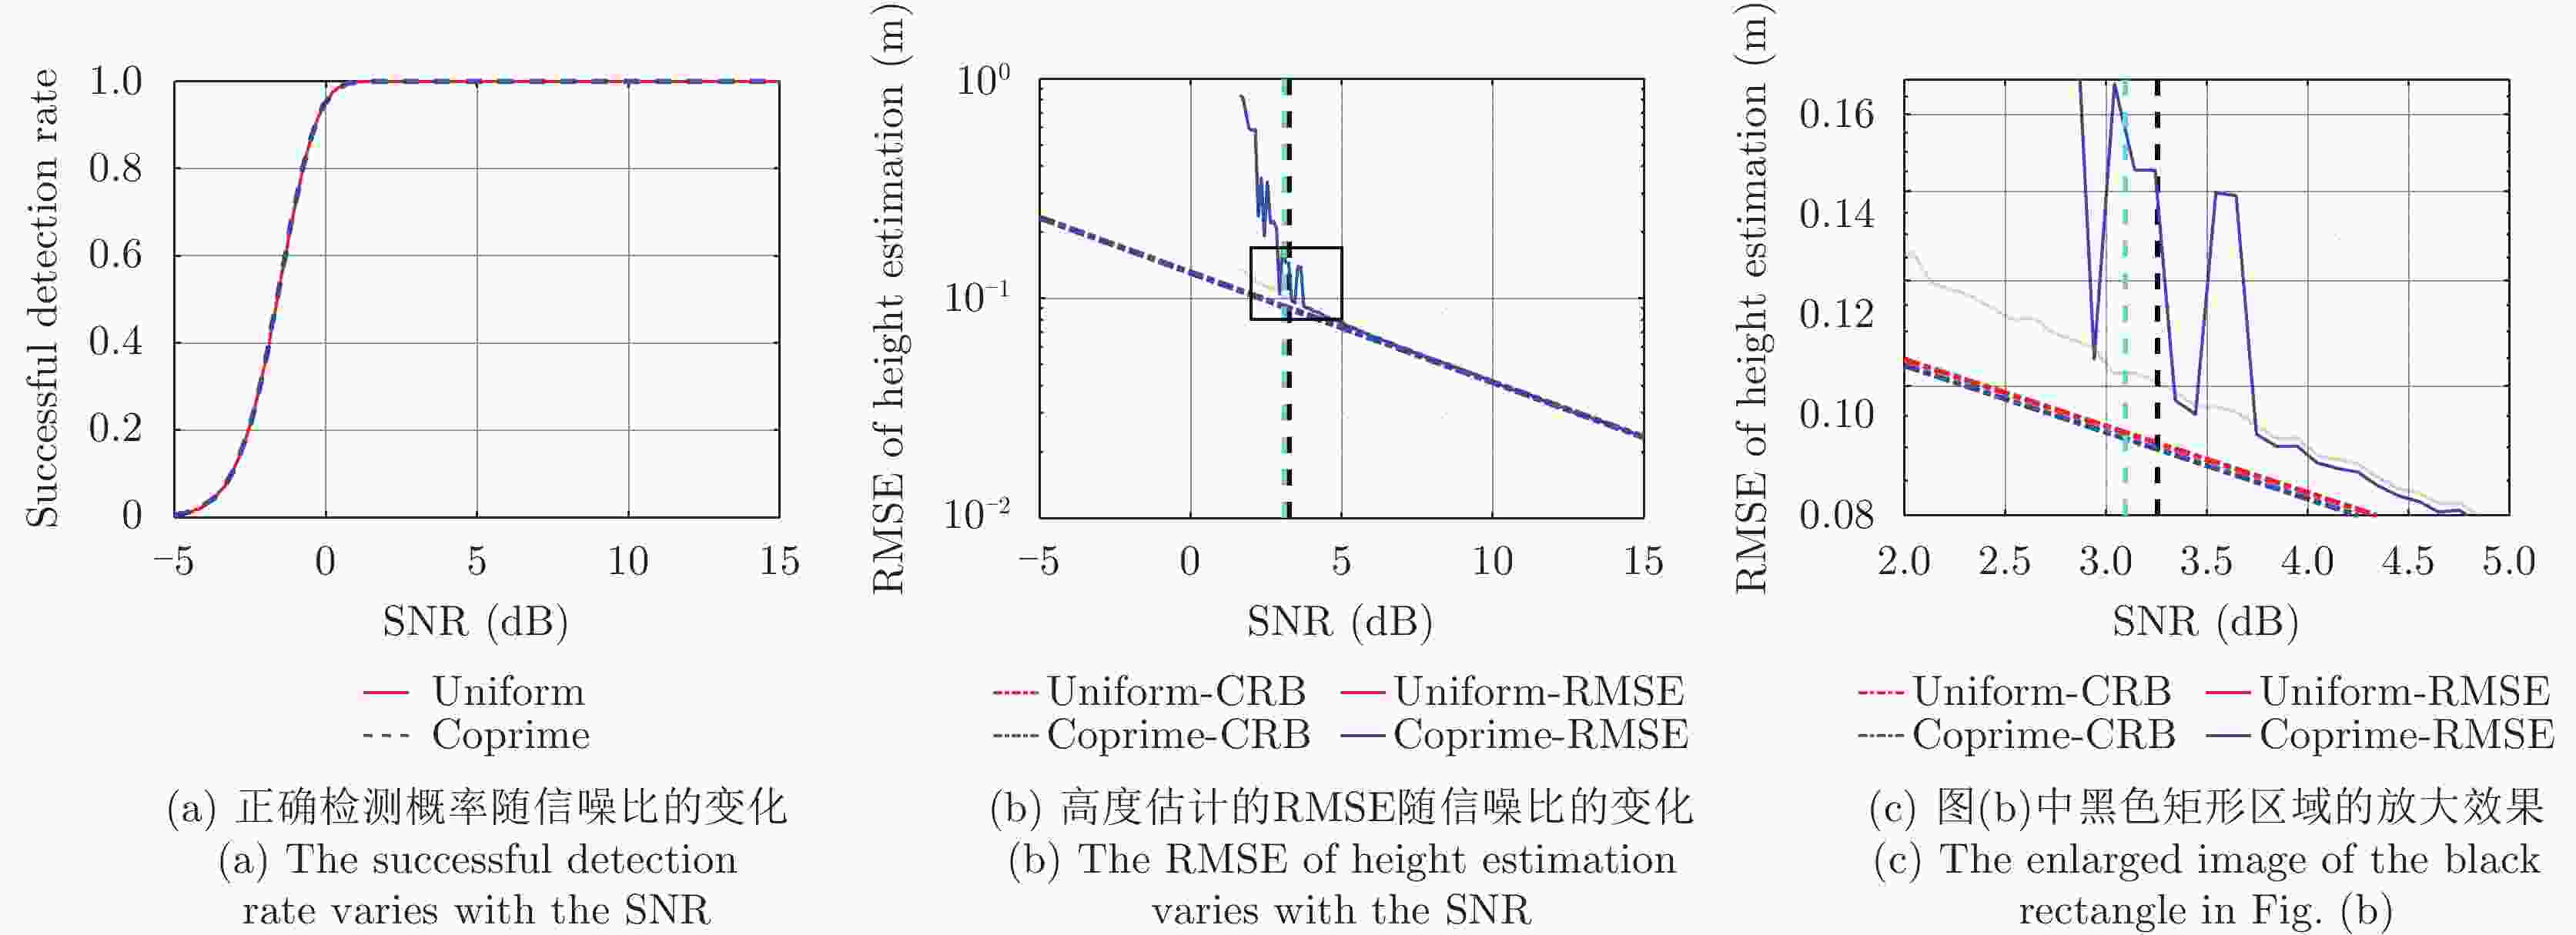
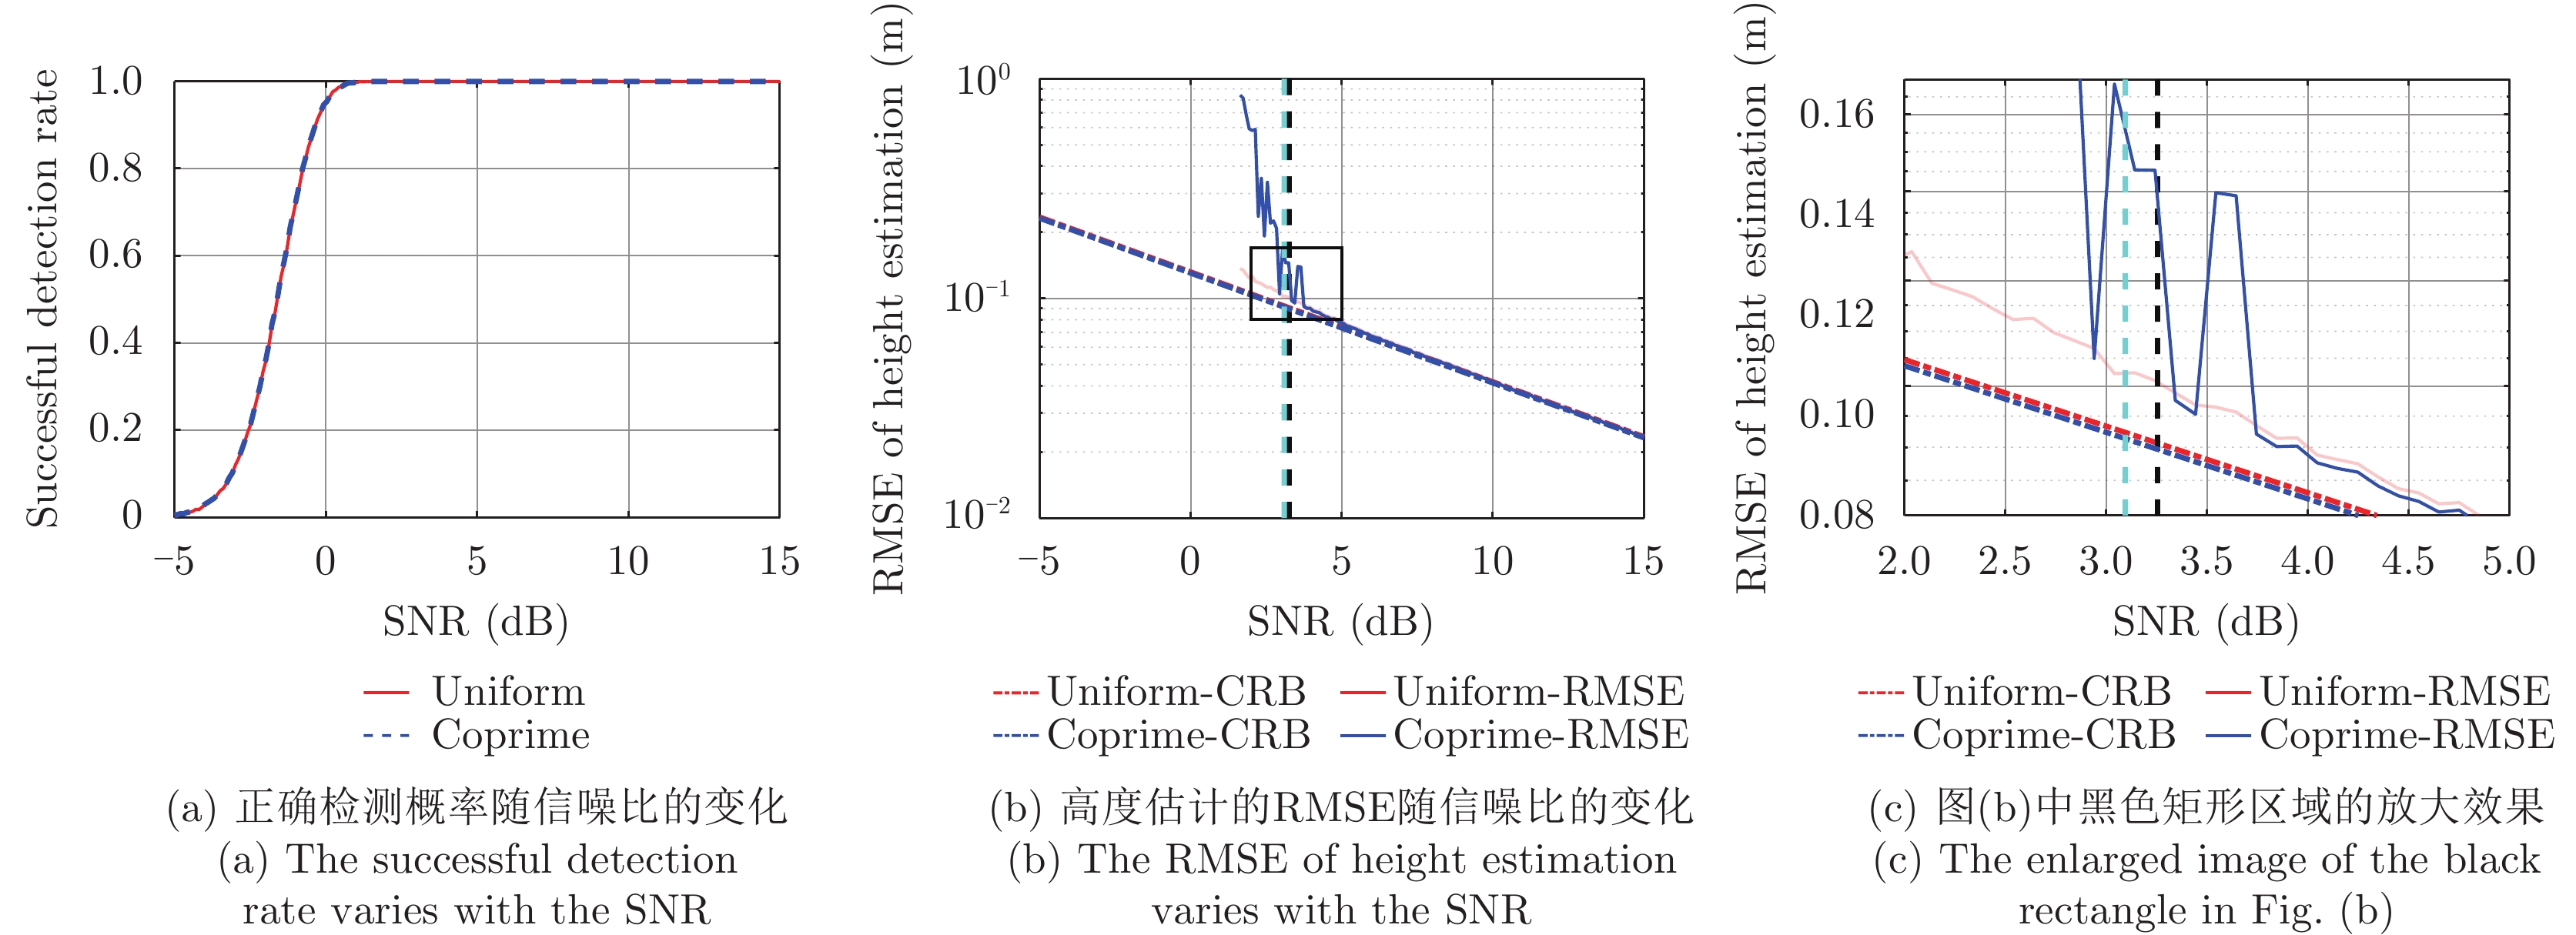
图 14 由文献[9]方法设计的均匀层析SAR和互质层析SAR的重构结果[均匀层析SAR (M=16; d=7.5 m; B=112 m);互质层析SAR (M1=9, M2=8; d=1.8 m; B=112 m)]
Figure 14. The reconstruction results from the uniform TomoSAR and the coprime TomoSAR which are designed by Ref. [9] vary with the SNR [the uniform TomoSAR (M=16; d=7.5 m; B=112 m); the coprime TomoSAR (M1=9, M2=8; d=1.8 m; B=112 m)]

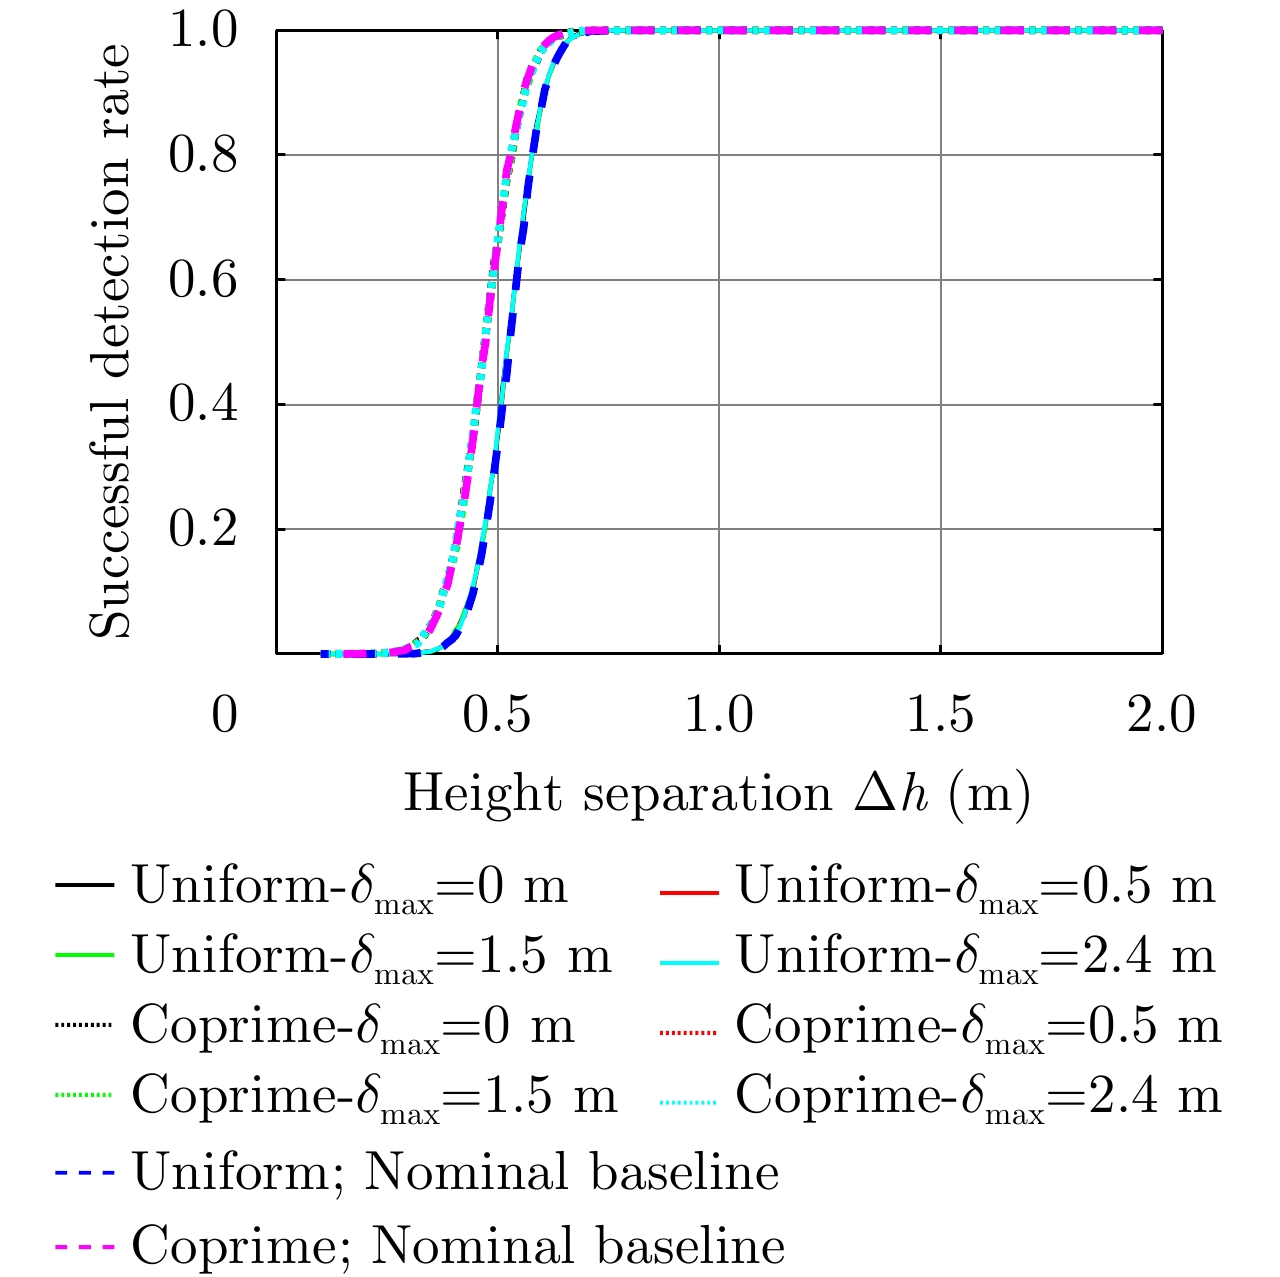
图 15 存在基线偏差情况下和理想情况下的正确检测概率(K=2;所有散射点的信噪比均等于0 dB;L=20;ρh=1 m)
Figure 15. Successful detection rate calculated from the deviated tracks and the nominal tracks (K=2; all the SNRs=0 dB; L=20; ρh=1 m)
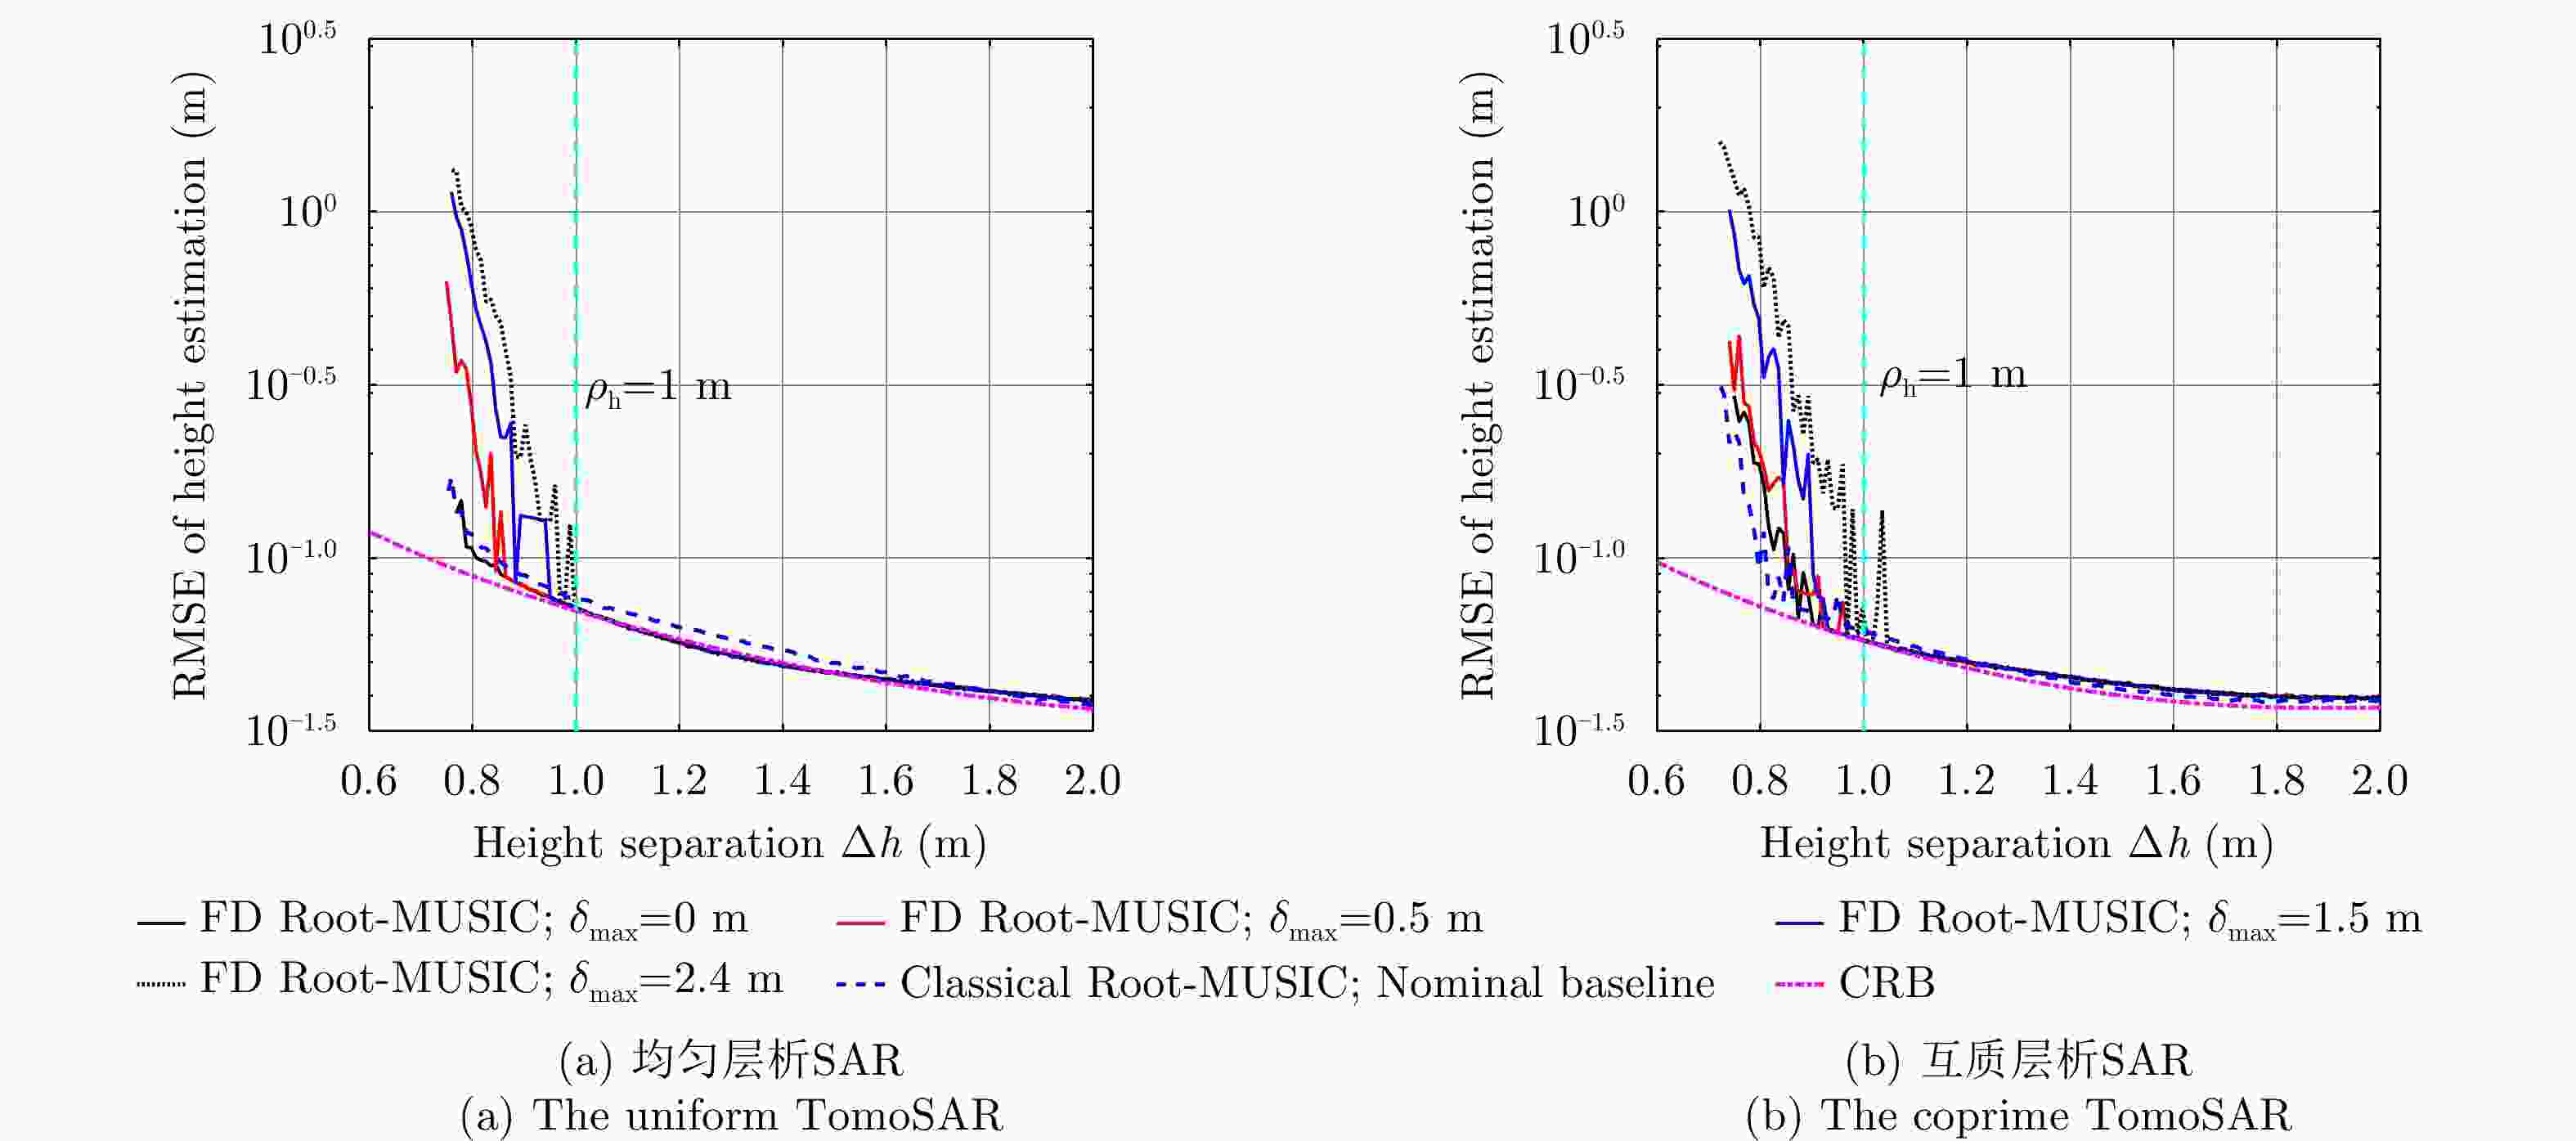
图 16 存在基线偏差情况下和理想情况下的高度估计的RMSE(实验参数的设置与图 15中的参数相等)
Figure 16. RMSE of the height estimation calculated from the deviated tracks and the nominal tracks (the simulation parmeters are seted as the same as in Fig. 15)
表 1 由本文方法计算得到的最少航过数量和最小航过间隔(K=2; SNR1=0 dB, SNR2=10 dB; Δh=1 m)
Table 1. The minimum number of acquisitions and the minimum inter-acquisition spacing calculated by the proposed approach (K=2; SNR1=0 dB, SNR2=10 dB; Δh=1 m)
视数 均匀层析SAR 互质层析SAR L=10 Mmin=20; dM=7.0 m Mmin=13;dM=4.6 m L=20 Mmin=15; dM=7.3 m Mmin=9; dM=7.3 m L=50 Mmin=12; dM=7.0 m Mmin=8; dM=5.5 m  下载: 导出CSV
表 2 基于样本特征值检测方法所需的最少航过数量的理论估计值和实测估计值(K=2; SNR1=0 dB, SNR2=10 dB; Δh=1 m)
Table 2. The theoretical estimate and the measured estimate of the minimum number of acquisitions in the sense of the sample-eigenvalue-based detection (K=2; SNR1=0 dB, SNR2=10 dB; Δh=1 m)
视数 均匀层析SAR 互质层析SAR 理论值 实测值 理论值 实测值 L=10 20 16 13 11 L=20 15 13 9 8 L=50 12 10 8 7
下载: 导出CSV
表 3 基于样本特征值检测方法的实测分辨率(K=2; SNR1=0 dB, SNR2=10 dB; ρh=1 m)
Table 3. The measured tomographic resolution of the sample-eigenvalue-based detection (K=2; SNR1=0 dB, SNR2=10 dB; ρh=1 m)
实验参数 分辨的实测值(m) 瑞利分辨率(m) L=10;均匀层析SAR
(Mmin=20, dM=7.0 m)0.73 1.69 L=10;互质层析SAR
(Mmin=13; dM=4.6 m)0.64 1.22 L=20;均匀层析SAR
(Mmin=15; dM=7.3 m)0.73 2.19 L=20;互质层析SAR
(Mmin=9; dM=7.3 m)0.69 1.71 L=50;均匀层析SAR
(Mmin=12; dM=7.0 m)0.70 2.91 L=50;互质层析SAR
(Mmin=8; dM=5.5 m)0.69 2.55
下载: 导出CSV
表 4 本文方法计算所得的最少航过数量和最小航过间隔(Δh=1 m; L=20;所有散射点信噪比均等于0 dB)
Table 4. The minimum number of acquisitions and the minimum inter-acquisition spacing calculated by the proposed approach (Δh=1 m; L=20; all the SNRs=0 dB)
散射点数量 均匀层析SAR 互质层析SAR K=2 Mmin=18; dM=7.4 m Mmin=10; dM=6.1 m K=3 Mmin=23; dM=7.2 m Mmin=10; dM=7.1 m
下载: 导出CSV
表 5 基于样本特征值检测方法所需的最少航过数量的理论估计值和实测估计值(Δh=1 m; L=20;所有散射点信噪比均等于0 dB)
Table 5. The theoretical estimate and the measured estimate of the minimum number of acquisitions in the sense of the sample-eigenvalue-based detection (Δh=1 m; L=20; all the SNRs=0 dB)
视数 均匀层析SAR 互质层析SAR 理论值 实测值 理论值 实测值 K=2 18 15 10 10 K=3 23 21 10 10
下载: 导出CSV
表 6 基于样本特征值检测方法的实测分辨率(L=20;所有散射点信噪比均等于0 dB;ρh=1 m)
Table 6. The measured tomographic resolution of the sample-eigenvalue-based detection (L=20; all the SNRs=0 dB; ρh=1 m)
实验参数 分辨的实测值(m) 瑞利分辨率(m) K=2;均匀层析SAR
(Mmin=18;dM=7.4 m)0.75 1.78 K=2;互质层析SAR
(Mmin=10; dM=6.1 m)0.72 1.47 K=3;均匀层析SAR
(Mmin=23; dM=7.2 m)0.90 1.42 K=3;互质层析SAR
(Mmin=10; dM=7.1 m)0.88 1.26
下载: 导出CSV
-
[1] RAMBOUR C, BUDILLON A, JOHNSY A C, et al. From interferometric to tomographic SAR: A review of synthetic aperture radar tomography-processing techniques for scatterer unmixing in urban areas[J]. IEEE Geoscience and Remote Sensing Magazine, 2020, 8(2): 6–29. doi: 10.1109/MGRS.2019.2957215 [2] REIGBER A and MOREIRA A. First demonstration of airborne SAR tomography using multibaseline L-band data[J]. IEEE Transactions on Geoscience and Remote Sensing, 2000, 38(5): 2142–2152. doi: 10.1109/36.868873 [3] YU Longlong, HUANG Xiaotao, FENG Dong, et al. Coprime synthetic aperture radar tomography[C]. 2021 2nd China International SAR Symposium (CISS), Shanghai, China, 2021: 1–6. [4] YU Longlong, FENG Dong, WANG Jian, et al. An efficient reconstruction approach based on atomic norm minimization for coprime tomographic SAR[J]. IEEE Geoscience and Remote Sensing Letters, 2022, 19: 4503705. doi: 10.1109/LGRS.2022.3143662 [5] VAIDYANATHAN P P and PAL P. Sparse sensing with Co-prime samplers and arrays[J]. IEEE Transactions on Signal Processing, 2011, 59(2): 573–586. doi: 10.1109/TSP.2010.2089682 [6] LOMBARDINI F and PARDINI M. 3-D SAR tomography: The multibaseline sector interpolation approach[J]. IEEE Geoscience and Remote Sensing Letters, 2008, 5(4): 630–634. doi: 10.1109/LGRS.2008.2001283 [7] NANNINI M, REIGBER A, and SCHEIBER R. A study on irregular baseline constellations in SAR tomography[C]. 8th European Conference on Synthetic Aperture Radar, Aachen, Germany, 2010: 1–4. [8] WEI Lianhuan, FENG Qiuyue, LIU Shanjun, et al. Minimum redundancy array—A baseline optimization strategy for urban SAR tomography[J]. Remote Sensing, 2020, 12(18): 3100. doi: 10.3390/rs12183100 [9] NANNINI M, SCHEIBER R, and MOREIRA A. Estimation of the minimum number of tracks for SAR tomography[J]. IEEE Transactions on Geoscience and Remote Sensing, 2009, 47(2): 531–543. doi: 10.1109/TGRS.2008.2007846 [10] ZHU Xiaoxiang and BAMLER R. Super-resolution power and robustness of compressive sensing for spectral estimation with application to spaceborne tomographic SAR[J]. IEEE Transactions on Geoscience and Remote Sensing, 2012, 50(1): 247–258. doi: 10.1109/TGRS.2011.2160183 [11] ZHU Xiaoxiang, GE Nan, and SHAHZAD M. Joint sparsity in SAR tomography for urban mapping[J]. IEEE Journal of Selected Topics in Signal Processing, 2015, 9(8): 1498–1509. doi: 10.1109/JSTSP.2015.2469646 [12] NADLER B. Finite sample approximation results for principal component analysis: A matrix perturbation approach[J]. The Annals of Statistics, 2008, 36(6): 2791–2817. doi: 10.1214/08-aos618 [13] NADAKUDITI R R and EDELMAN A. Sample eigenvalue based detection of high-dimensional signals in white noise using relatively few samples[J]. IEEE Transactions on Signal Processing, 2008, 56(7): 2625–2638. doi: 10.1109/TSP.2008.917356 [14] FORNARO G, VERDE S, REALE D, et al. CAESAR: An approach based on covariance matrix decomposition to improve multibaseline-multitemporal interferometric SAR processing[J]. IEEE Transactions on Geoscience and Remote Sensing, 2015, 53(4): 2050–2065. doi: 10.1109/TGRS.2014.2352853 [15] NAVNEET S, KIM J W, and LU Zhong. A new InSAR persistent scatterer selection technique using top eigenvalue of coherence matrix[J]. IEEE Transactions on Geoscience and Remote Sensing, 2018, 56(4): 1969–1978. doi: 10.1109/TGRS.2017.2771386 [16] PAUCIULLO A, REALE D, FRANZÉ W, et al. Multi-look in GLRT-based detection of single and double persistent scatterers[J]. IEEE Transactions on Geoscience and Remote Sensing, 2018, 56(9): 5125–5137. doi: 10.1109/TGRS.2018.2809538 [17] D’HONDT O, LÓPEZ-MARTÍNEZ C, GUILLASO S, et al. Nonlocal filtering applied to 3-D reconstruction of tomographic SAR data[J]. IEEE Transactions on Geoscience and Remote Sensing, 2018, 56(1): 272–285. doi: 10.1109/TGRS.2017.2746420 [18] ZHU Xiaoxiang and BAMLER R. Superresolving SAR tomography for multidimensional imaging of urban areas: Compressive sensing-based TomoSAR inversion[J]. IEEE Signal Processing Magazine, 2014, 31(4): 51–58. doi: 10.1109/MSP.2014.2312098 [19] JOHNSON B A, ABRAMOVICH Y I, and MESTRE X. MUSIC, G-MUSIC, and maximum-likelihood performance breakdown[J]. IEEE Transactions on Signal Processing, 2008, 56(8): 3944–3958. doi: 10.1109/TSP.2008.921729 [20] SHAGHAGHI M and VOROBYOV S A. Subspace leakage analysis and improved DOA estimation with small sample size[J]. IEEE Transactions on Signal Processing, 2015, 63(12): 3251–3265. doi: 10.1109/TSP.2015.2422675 [21] FRIEDLANDER B. The root-MUSIC algorithm for direction finding with interpolated arrays[J]. Signal Processing, 1993, 30(1): 15–29. doi: 10.1016/0165-1684(93)90048-F [22] RUBSAMEN M and GERSHMAN A B. Direction-of-arrival estimation for nonuniform sensor arrays: From manifold separation to fourier domain MUSIC methods[J]. IEEE Transactions on Signal Processing, 2009, 57(2): 588–599. doi: 10.1109/TSP.2008.2008560 [23] STOICA P and NEHORAI A. MUSIC, maximum likelihood, and Cramer-Rao bound[J]. IEEE Transactions on Acoustics, Speech, and Signal Processing, 1989, 37(5): 720–741. doi: 10.1109/29.17564 -


计量
- 文章访问数:
- HTML全文浏览量:
- PDF下载量:
- 被引次数: 0

