PolSAR Image Classification Method Based on Markov Discriminant Spectral Clustering
-
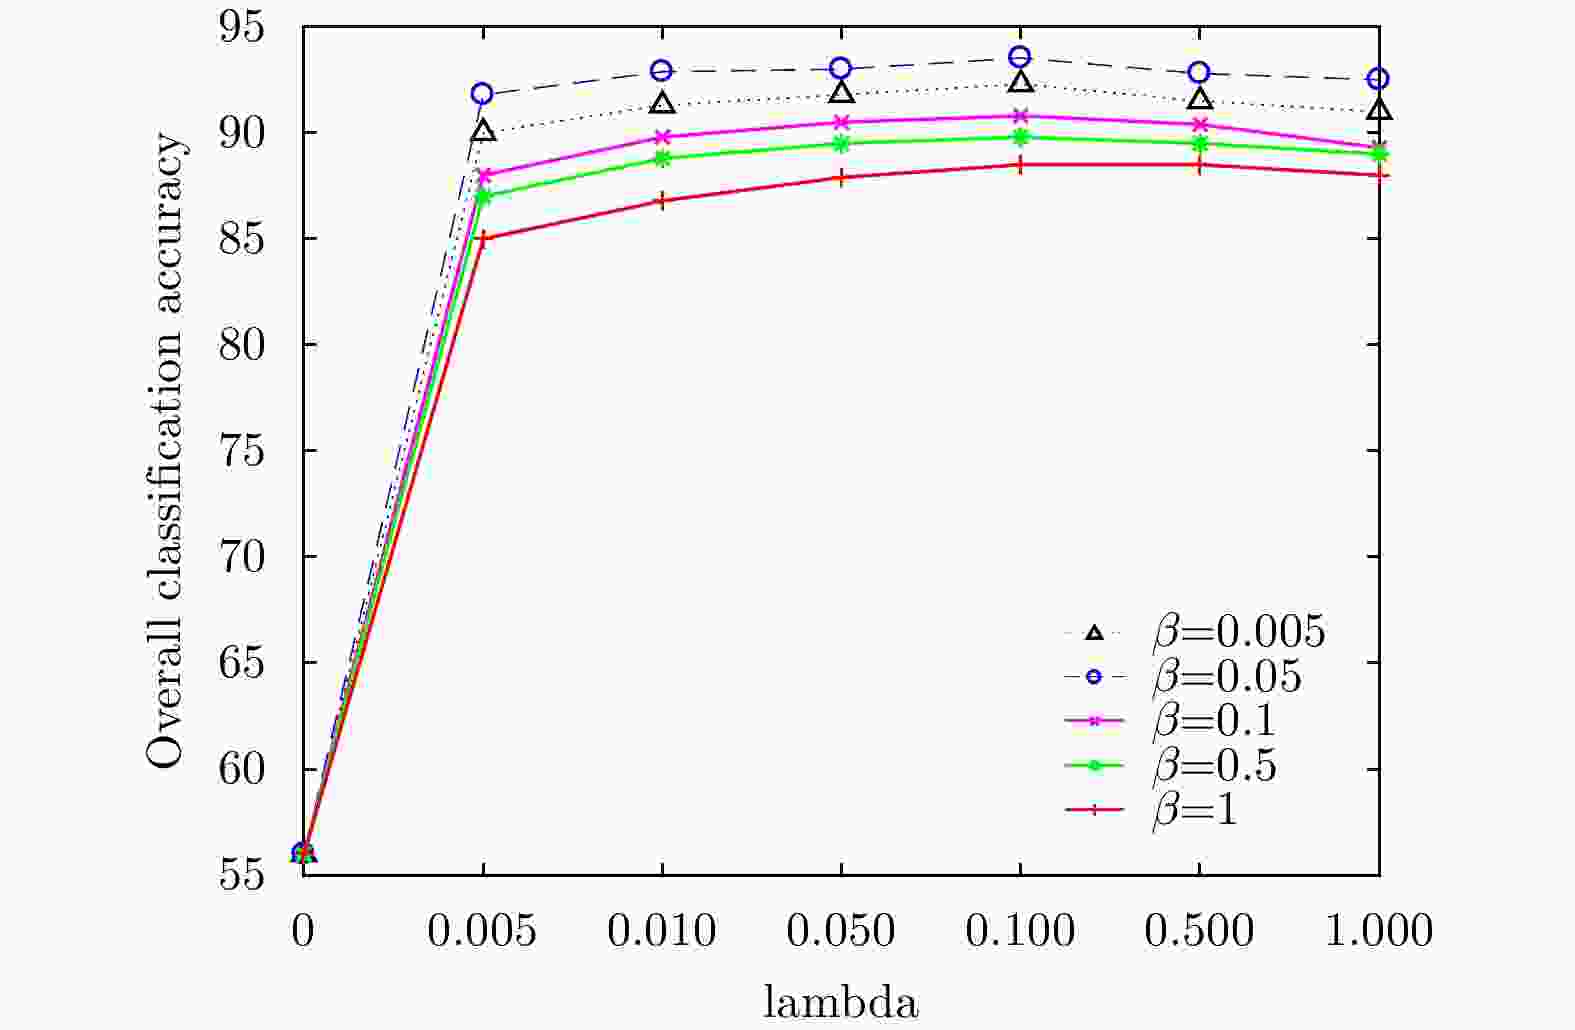
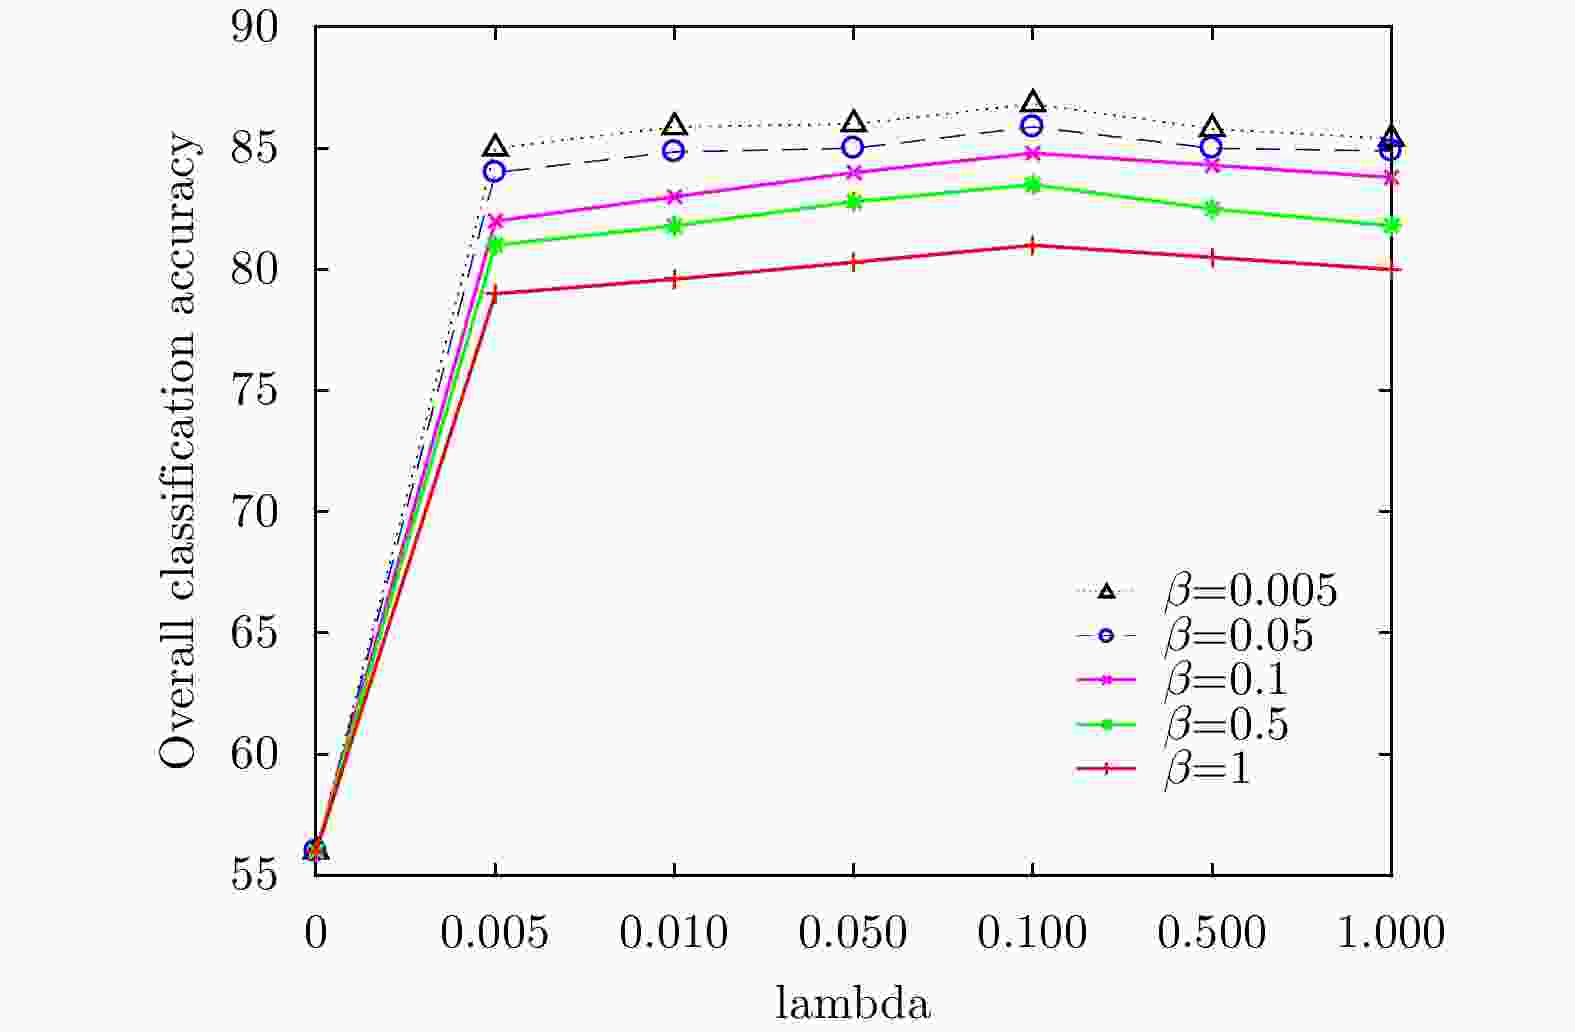
摘要: 该文针对现有的谱聚类方法用于极化SAR图像分类时精度较低的问题,提出一种基于马尔科夫的判别谱聚类方法(MDSC),具有低秩和稀疏分解的特点。该方法首先恢复一个真实的低秩概率转移矩阵,将其作为标准马尔科夫谱聚类方法的输入,以减少噪声对分类结果的影响;然后在目标函数中引入判别信息,使极化SAR图像的数据信息能够得到更加充分地利用;最后采用增广拉格朗日乘子法来解决低秩和概率单纯形约束下的目标函数优化问题。在荷兰小农田、德国、西安和荷兰大农田4个不同数据集上的实验证明,该方法具有较好的准确率,且参数敏感性较低,表现出了良好的分类性能。Abstract: Due to the existing spectral clustering methods have low accuracy for PolSAR image classification, a Markov-based Discriminative Spectral Clustering(MDSC) method is proposed, which has the characteristics of low-rank and sparse decomposition. Firstly, a real low-rank probability transfer matrix is restored as an input to the standard Markov spectral clustering method to reduce the influence of noise on the classification result. Then the discriminative information is introduced into the objective function to make the polarimetric SAR image data can be more fully used. Finally, the augmented Lagrangian multiplier method is used to solve the objective function optimization problem under low-rank and probability simplex constraints. Experiments on three different data sets of Flevoland, Oberpfaffenhofen, and Xi’an show that our method has good accuracy and low sensitivity, which having a good classification performance.
-
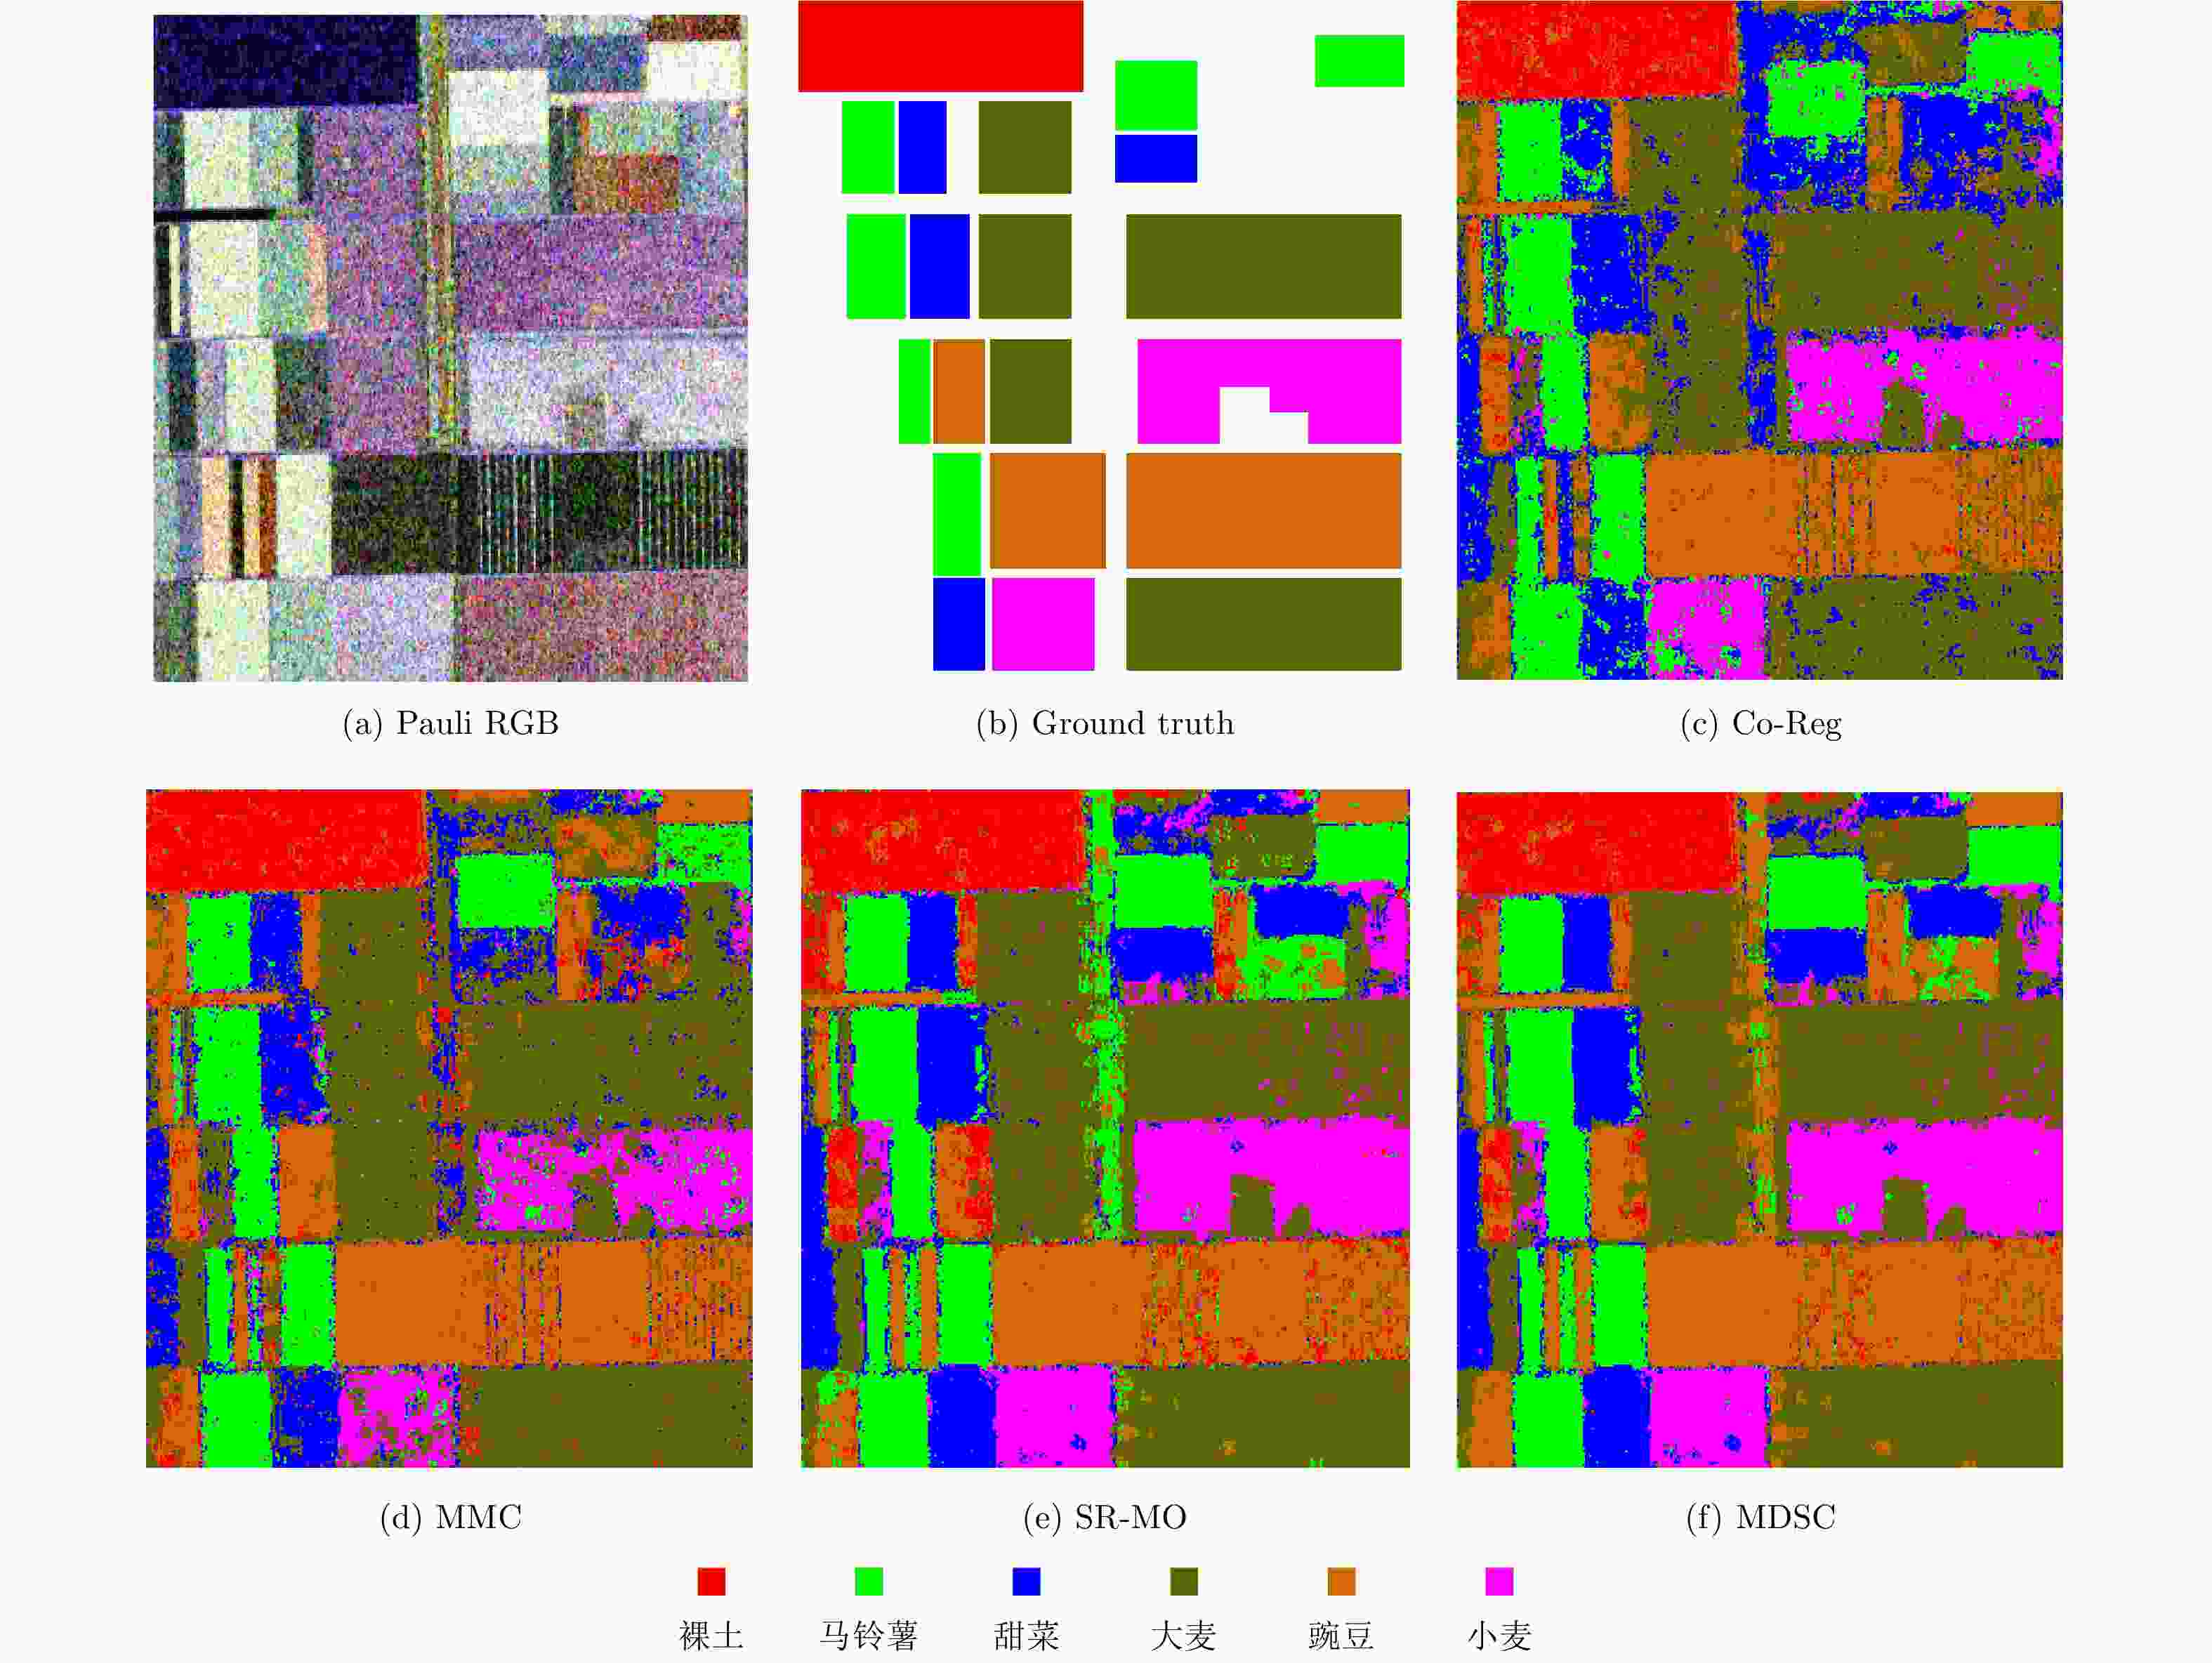
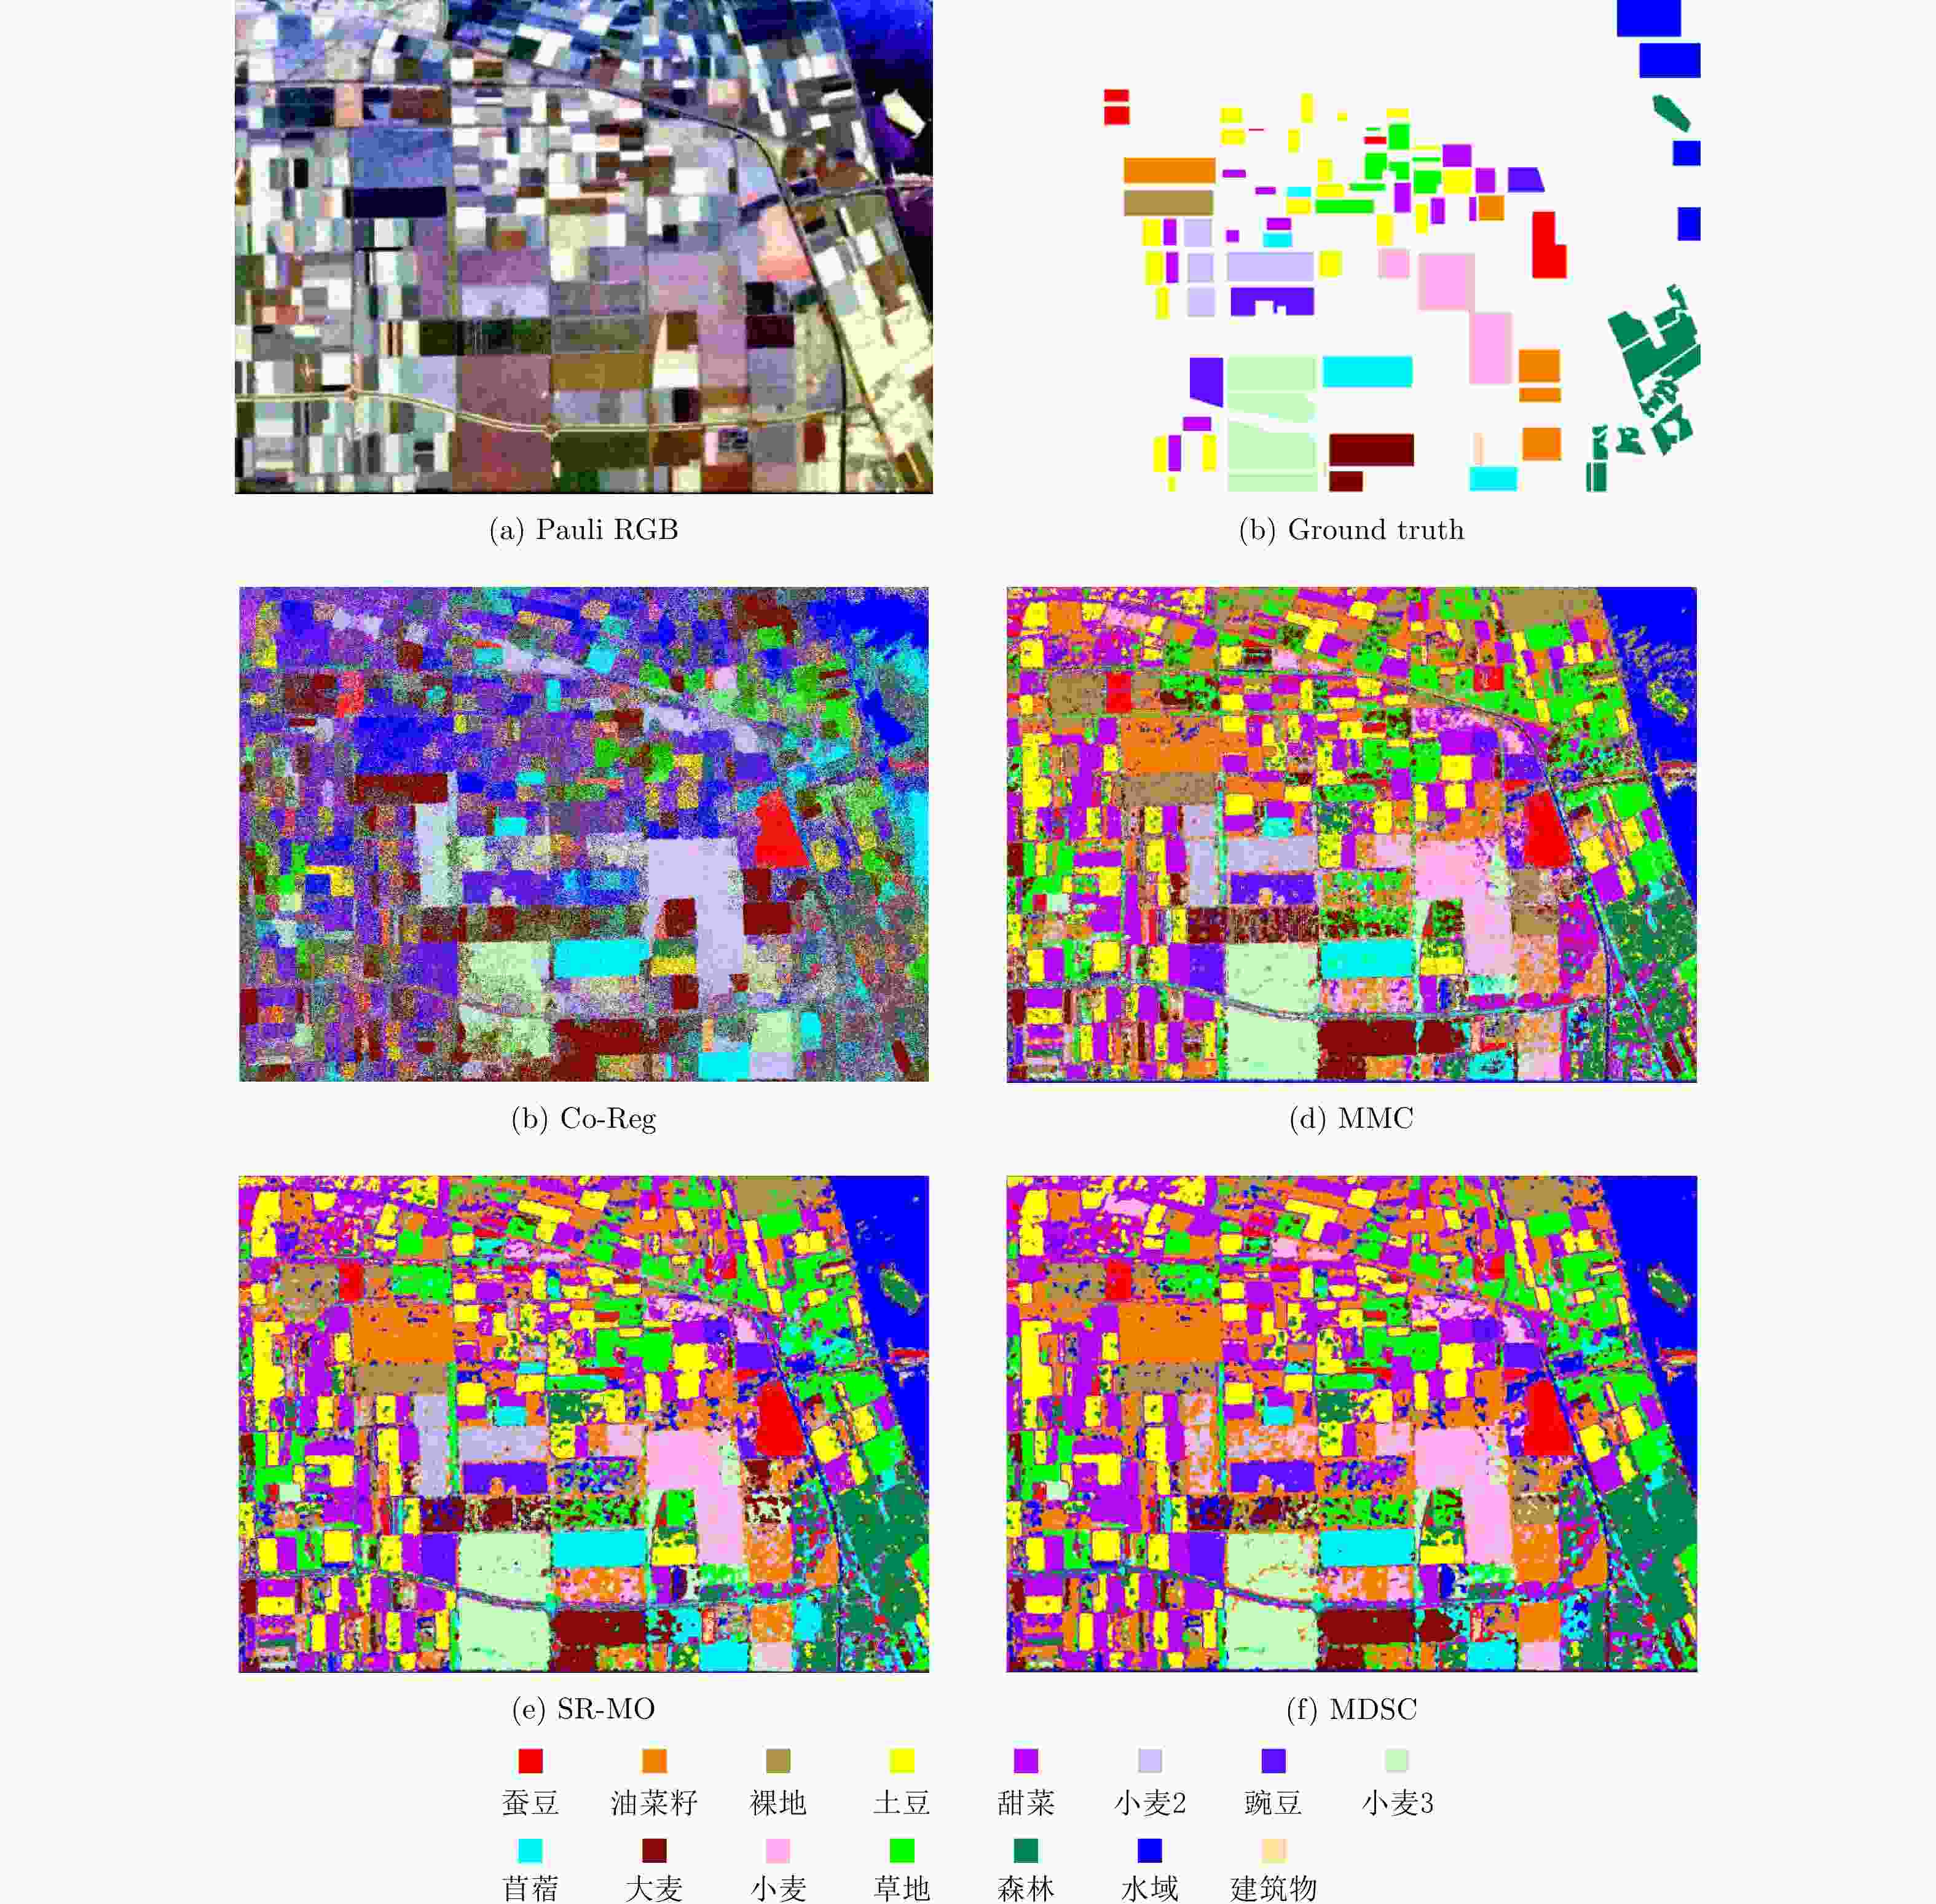
表 1 4种算法对Flevoland小农田图的分类结果
Table 1. Classification results of four algorithms for Flevoland small farmland map
裸土 土豆 甜菜 大麦 豌豆 小麦 OA AA Kappa Co-Reg 0.8860 0.9452 0.7551 0.7906 0.8262 0.8960 0.8400 0.8498 0.8775 MMC 0.9180 0.9580 0.7242 0.9623 0.8756 0.6994 0.8708 0.8396 0.9005 SR-MO 0.9034 0.9049 0.8845 0.9561 0.8362 0.9554 0.9130 0.9067 0.9331 本文算法 0.9048 0.9088 0.8834 0.9604 0.8920 0.9382 0.9243 0.9146 0.9418 表 2 4种算法对德国Oberpfaffenhofen地区的分类结果
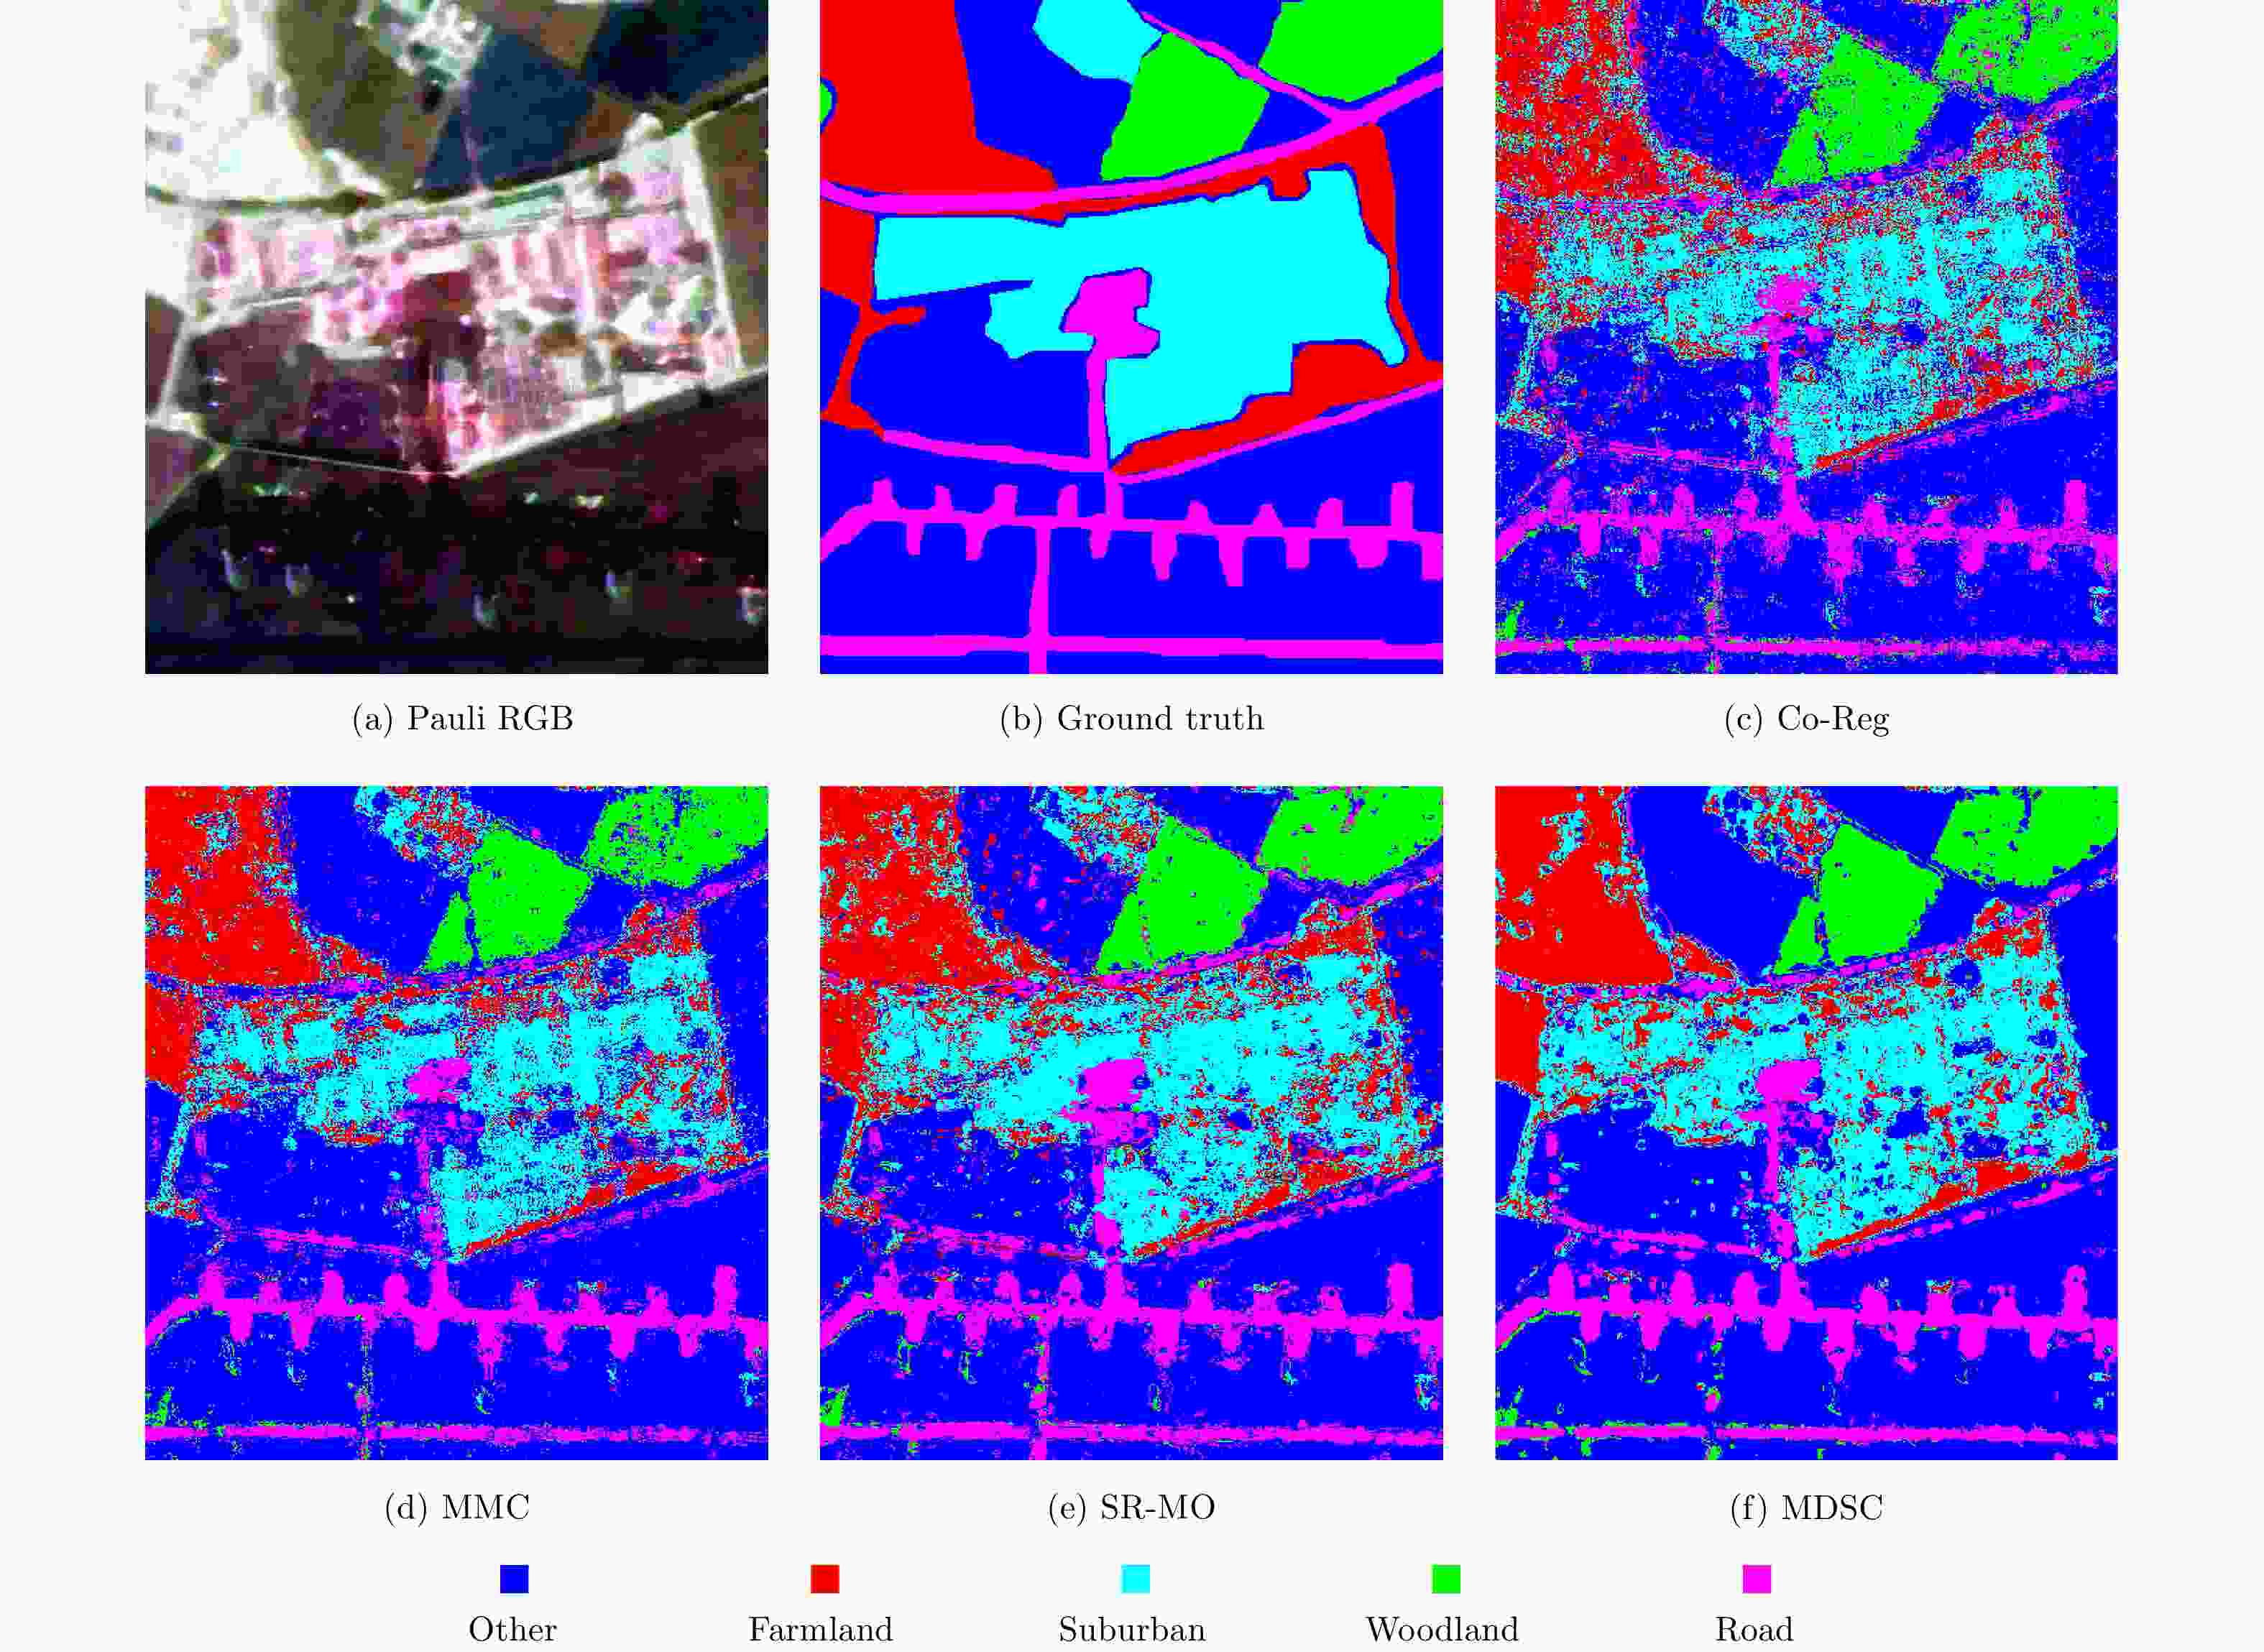
Table 2. Classification results of four algorithms for the Oberpfaffenhofen region of Germany
Co-Reg MMC SR-MO 本文算法 农田 0.6111 0.6018 0.6859 0.7016 居民区 0.6072 0.6521 0.7336 0.7389 林地 0.8162 0.7993 0.9055 0.9108 道路 0.5311 0.5681 0.6049 0.6418 其他 0.8791 0.8789 0.8673 0.8814 OA 0.7363 0.7471 0.7822 0.7974 AA 0.6889 0.7000 0.7594 0.7749 Kappa 0.6170 0.6348 0.6920 0.7205 表 3 4种算法对西安地区的分类结果
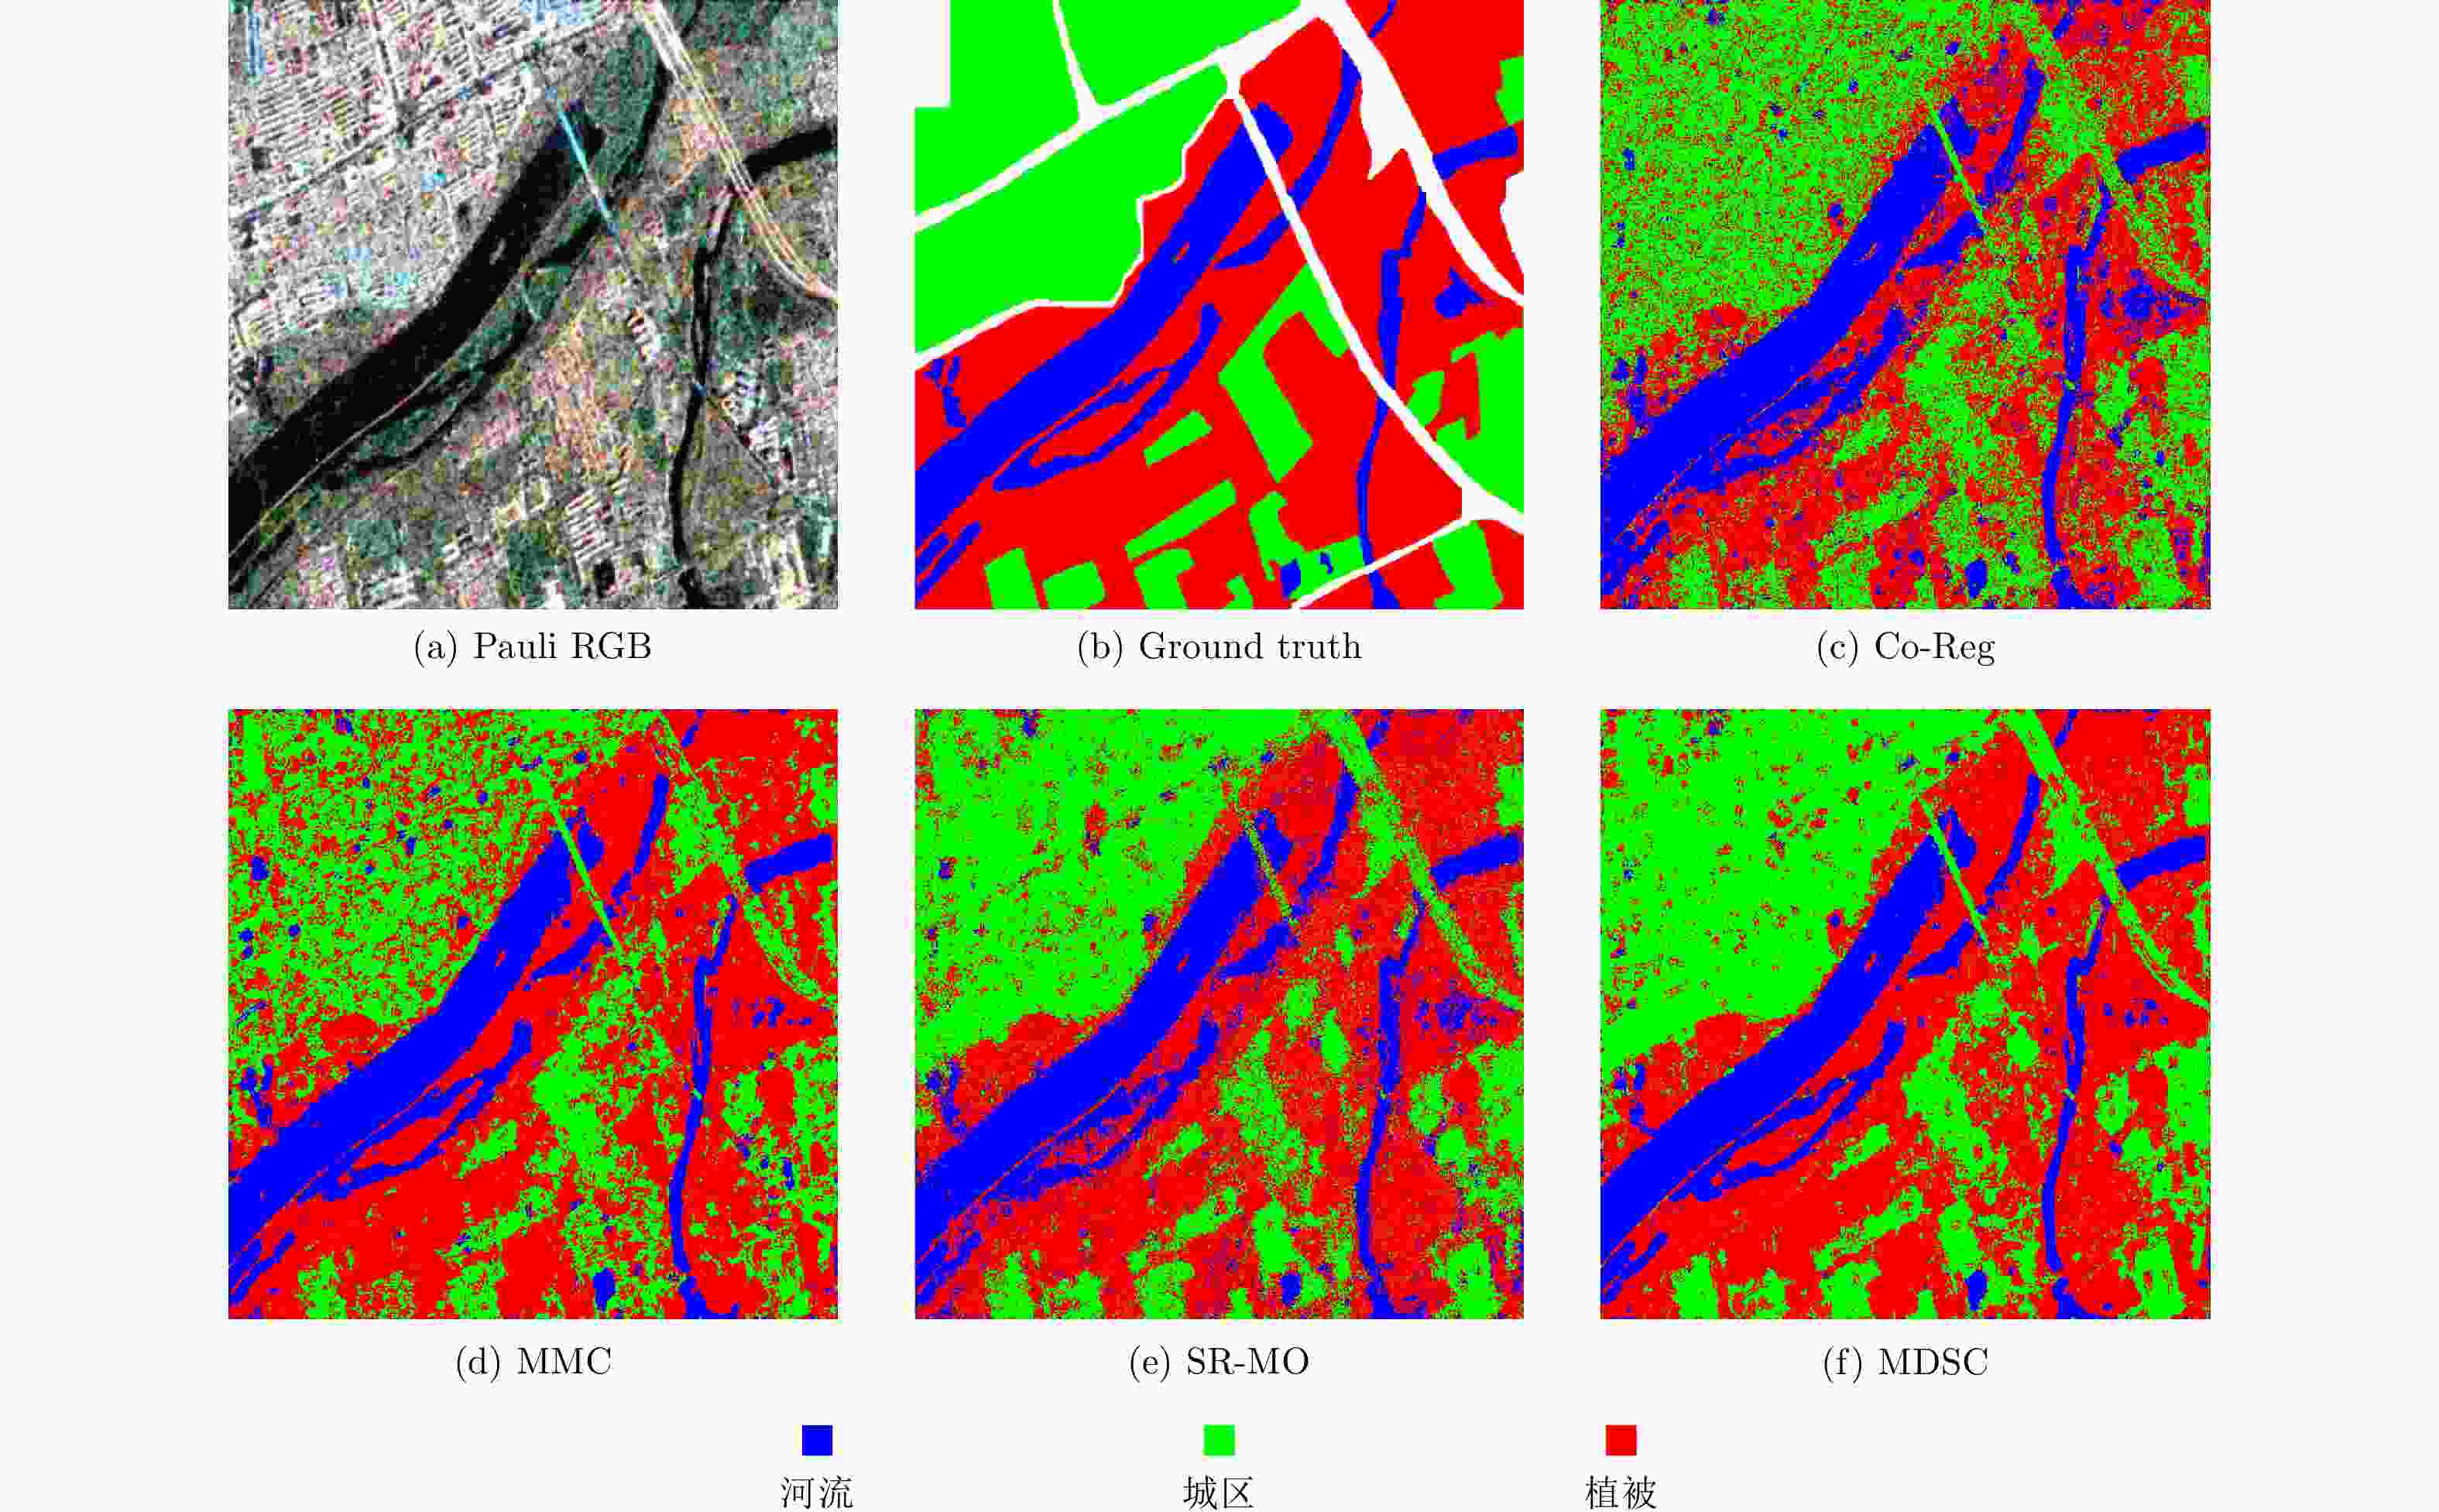
Table 3. Classification results of four algorithms for Xi’an area
Co-Reg MMC SR-MO 本文算法 河流 0.9372 0.8876 0.9189 0.8890 城区 0.7300 0.6622 0.8128 0.8550 植被 0.6876 0.8052 0.8006 0.8555 OA 0.7400 0.7670 0.8227 0.8503 AA 0.7259 0.7584 0.8136 0.8436 Kappa 0.7341 0.7710 0.8071 0.8471 表 4 4种算法对荷兰 Flevoland 地区大农田图的分类结果
Table 4. Classification results of four algorithms for large farmland maps in the Flevoland region of the Netherlands
Co-Reg MMC SR-MO 本文算法 蚕豆 0.7459 0.8942 0.9614 0.9584 油菜籽 0.1393 0.7194 0.7094 0.8337 裸地 0.2056 0.9616 0.9541 0.9583 土豆 0.2479 0.8912 0.8796 0.9086 甜菜 0.1079 0.9481 0.9656 0.9515 小麦2 0.2427 0.6251 0.8525 0.7941 豌豆 0.7932 0.9517 0.8887 0.9571 小麦3 0.5412 0.9231 0.9180 0.9300 苜蓿 0.9541 0.8940 0.8391 0.9284 大麦 0.9226 0.6311 0.9660 0.8524 小麦 0.1158 0.8458 0.8660 0.8796 草地 0.3944 0.6459 0.7470 0.8773 森林 0.4041 0.8833 0.8329 0.9122 水域 0.5403 0.9757 0.9035 0.9620 建筑物 0.5954 0.7761 0.5865 0.7912 OA 0.4204 0.8441 0.8501 0.8923 AA 0.4165 0.8398 0.8697 0.9043 Kappa 0.4269 0.8409 0.8441 0.9136 -
[1] 邹焕新, 罗天成, 张月, 等. 基于组合条件随机场的极化SAR图像监督地物分类[J]. 雷达学报, 2017, 6(5): 541–553. doi: 10.12000/JR16109ZOU Huanxin, LUO Tiancheng, ZHANG Yue, et al. Combined conditional random fields model for supervised PolSAR images classification[J]. Journal of Radars, 2017, 6(5): 541–553. doi: 10.12000/JR16109 [2] FREEMAN A and DURDEN S L. A three-component scattering model for polarimetric SAR data[J]. IEEE Transactions on Geoscience and Remote Sensing, 1998, 36(3): 963–973. doi: 10.1109/36.673687 [3] BUONO A, NUNZIATA F, MIGLIACCIO M, et al. Classification of the Yellow River delta area using fully polarimetric SAR measurements[J]. International Journal of Remote Sensing, 2017, 38(23): 6714–6734. doi: 10.1080/01431161.2017.1363437 [4] JOULIN A, BACH F, and PONCE J. Discriminative clustering for image co-segmentation[C]. Proceedings of 2010 IEEE Computer Society Conference on Computer Vision and Pattern Recognition, San Francisco, USA, 2010: 1943–1950. [5] HARALICK R M, SHANMUGAM K, and DINSTEIN I. Textural features for image classification[J]. IEEE Transactions on Systems, Man, and Cybernetics, 1973, SMC-3(6): 610–621. doi: 10.1109/TSMC.1973.4309314 [6] RATHA D, BHATTACHARYA A, and FRERY A C. Unsupervised classification of PolSAR data using a scattering similarity measure derived from a geodesic distance[J]. IEEE Geoscience and Remote Sensing Letters, 2018, 15(1): 151–155. doi: 10.1109/LGRS.2017.2778749 [7] AHMED N and CAMPBELL M. Variational Bayesian learning of probabilistic discriminative models with latent softmax variables[J]. IEEE Transactions on Signal Processing, 2011, 59(7): 3143–3153. doi: 10.1109/TSP.2011.2144587 [8] LIN Zhouchen, CHEN Minming, and MA Ya. The augmented Lagrange multiplier method for exact recovery of corrupted low-rank matrices[J]. Eprint Arxiv, 2010(9): 26. [9] XIA Rongkai, PAN Yan, DU Lei, et al. Robust multi-view spectral clustering via low-rank and sparse decomposition[C]. Proceedings of the Twenty-Eighth AAAI Conference on Artificial Intelligence, Québec City, 2014: 2149–2155. [10] CAI Jianfeng, CANDÈS E J, and SHEN Zuowei. A singular value thresholding algorithm for matrix completion[J]. SIAM Journal on Optimization, 2010, 20(4): 1956–1982. doi: 10.1137/080738970 [11] ZHU Ciyou, BYRD R H, LU Peihuang, et al. Algorithm 778: L-BFGS-B: Fortran subroutines for large-scale bound-constrained optimization[J]. ACM Transactions on Mathematical Software, 1997, 23(4): 550–560. doi: 10.1145/279232.279236 [12] KUMAR Y, MULLER U, BEN J, et al. spectral clustering MIT Press[C]. 24th Annual Conference on Neural Information Processing Systems, Vancouver, Canada, 2010. [13] MATSUGU M, MORI K, ISHII M, et al. Convolutional spiking neural network model for robust face detection[C]. Proceedings of the 9th International Conference on Neural Information Processing, Singapore, Singapore, 2002: 660–664. -


 作者中心
作者中心 专家审稿
专家审稿 责编办公
责编办公 编辑办公
编辑办公

 下载:
下载:
