
 作者中心
作者中心 专家审稿
专家审稿 责编办公
责编办公 编辑办公
编辑办公
Geometric Continuity Characterization of Urban Buildings in SAR 3D Imaging Domain and Few-tracks 3D Imaging
-
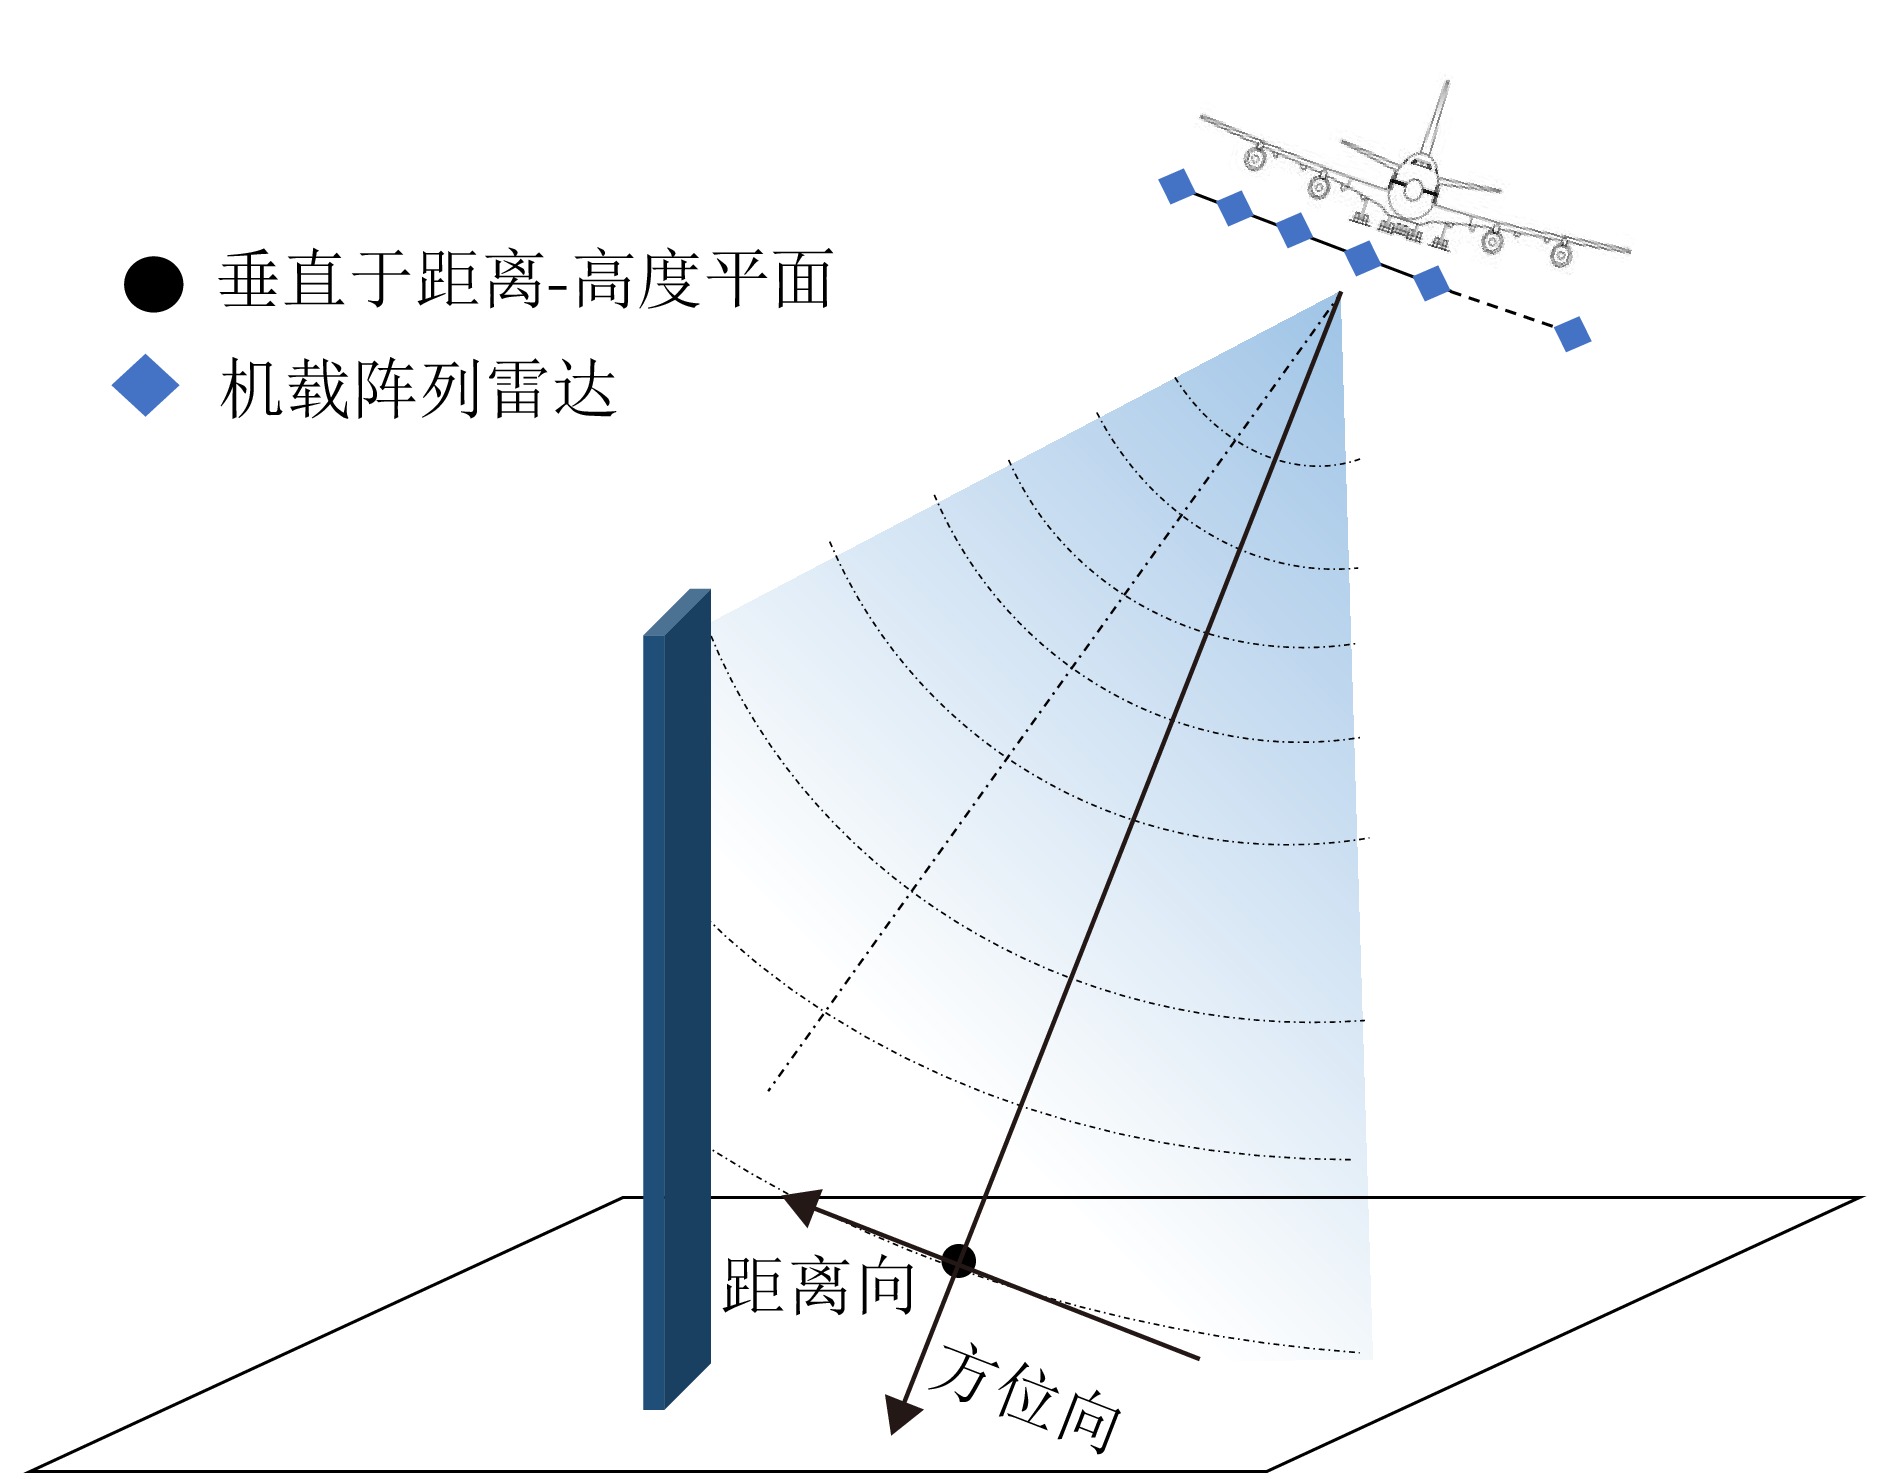
摘要: 合成孔径雷达(SAR)是一种主动式微波传感器,具备全天时、全天候工作的能力,是重要的对地观测数据源。二维SAR图像回波混叠影响其在目标识别等方面的应用,利用多基线观测的SAR三维成像技术能够解决目标叠掩问题,但受限于系统复杂度,当前机载或星载单航过SAR系统仅能获得稀疏采样,无法满足算法对数据量的需求。由此发展的微波视觉三维成像新理论通过挖掘微波视觉语义信息来弥补采样的不足,其关键技术包括视觉信息获取以及信息融合处理。然而,SAR图像的几何连续性表征和应用方式缺乏相关性研究,该文分析了典型目标在SAR三维成像域内几何连续性的表征形式,并分别提出了隐式和显式几何连续性约束的少轨数三维成像方法。最后采用实测机载阵列InSAR数据进行算法验证,表明利用几何连续性约束能够有效提升稀疏采样下的三维成像性能。该文提出的几何连续性表征方法为微波视觉三维成像的具体实现提供了一种有效途径。Abstract: Synthetic Aperture Radar (SAR) is an active microwave sensing technology capable of all-weather, day-and-night operation, making it a critical source of Earth observation data. However, conventional two-dimensional SAR imagery often suffers from echo overlap, limiting its effectiveness for target recognition. Although three-Dimensional (3D) SAR imaging using multibaseline observations can mitigate target occlusion, single-pass airborne or spaceborne SAR systems are typically constrained by system complexity, resulting in sparse track sampling that is inadequate for conventional 3D imaging algorithms. To address this limitation, a novel microwave vision-based 3D imaging framework has recently been proposed, in which visual semantic information is extracted and fused to enhance imaging performance. However, the characterization and application of geometric continuity in SAR imagery remain largely unexplored. This study characterizes the geometric continuity properties of typical urban buildings in the SAR 3D imaging domain and proposes sparse-track 3D imaging methods constrained by both implicit and explicit geometric continuity. Experimental results obtained from measured airborne-array InSAR data demonstrate that incorporating geometric continuity constraints effectively enhances 3D imaging performance under sparse sampling conditions. These findings indicate that geometric continuity-based representations provide a practical and effective pathway toward realizing microwave-vision 3D SAR imaging.
-
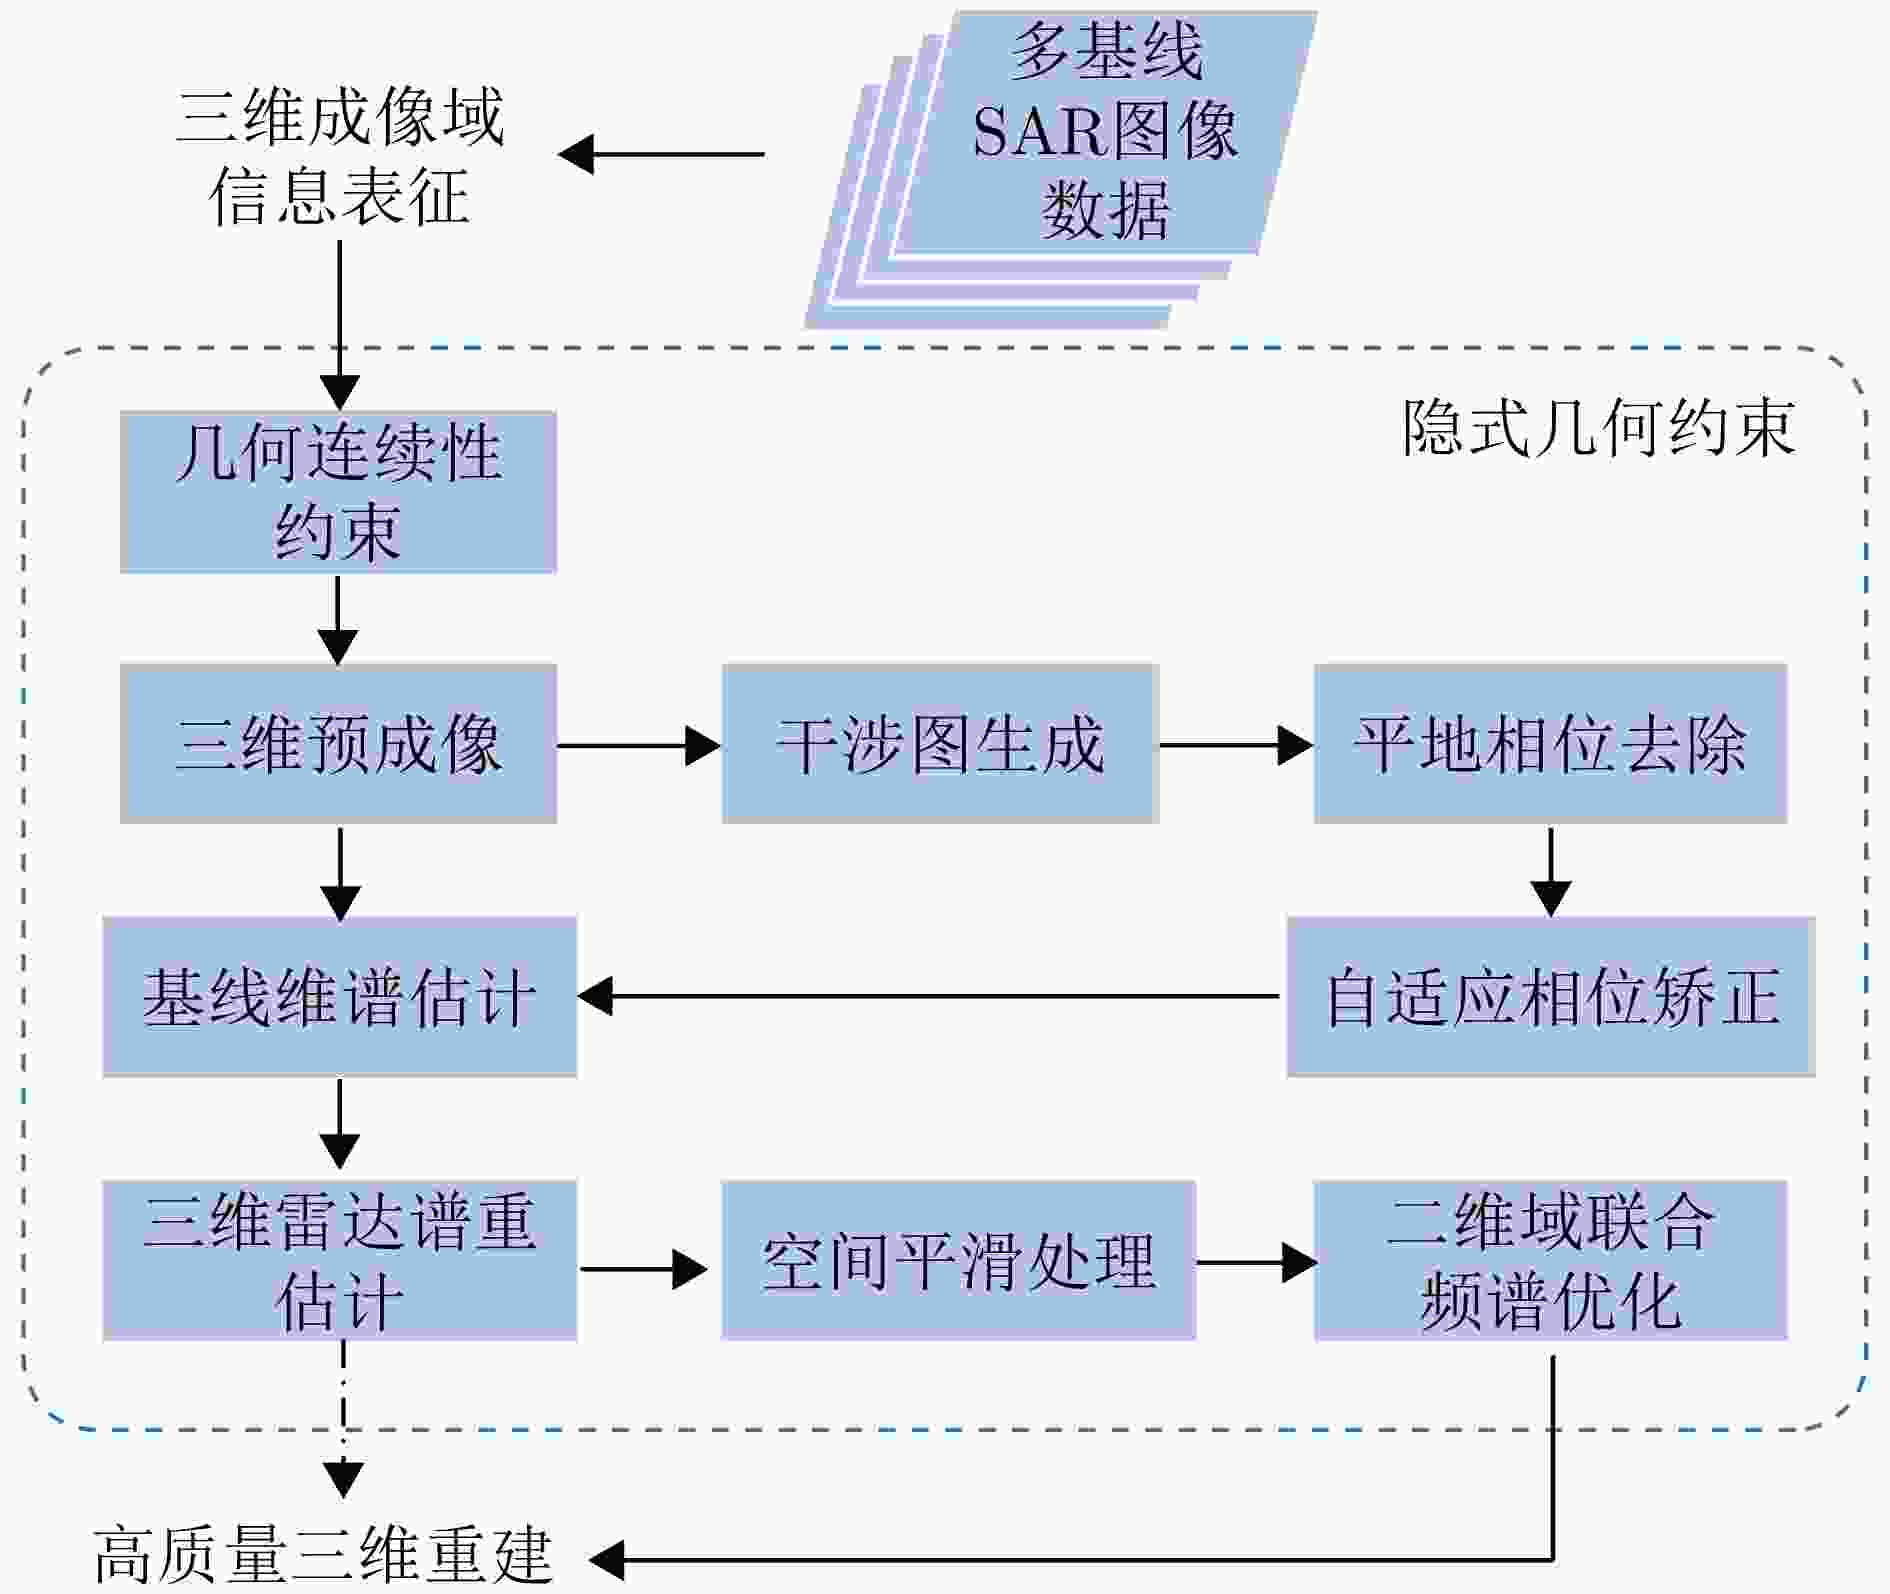
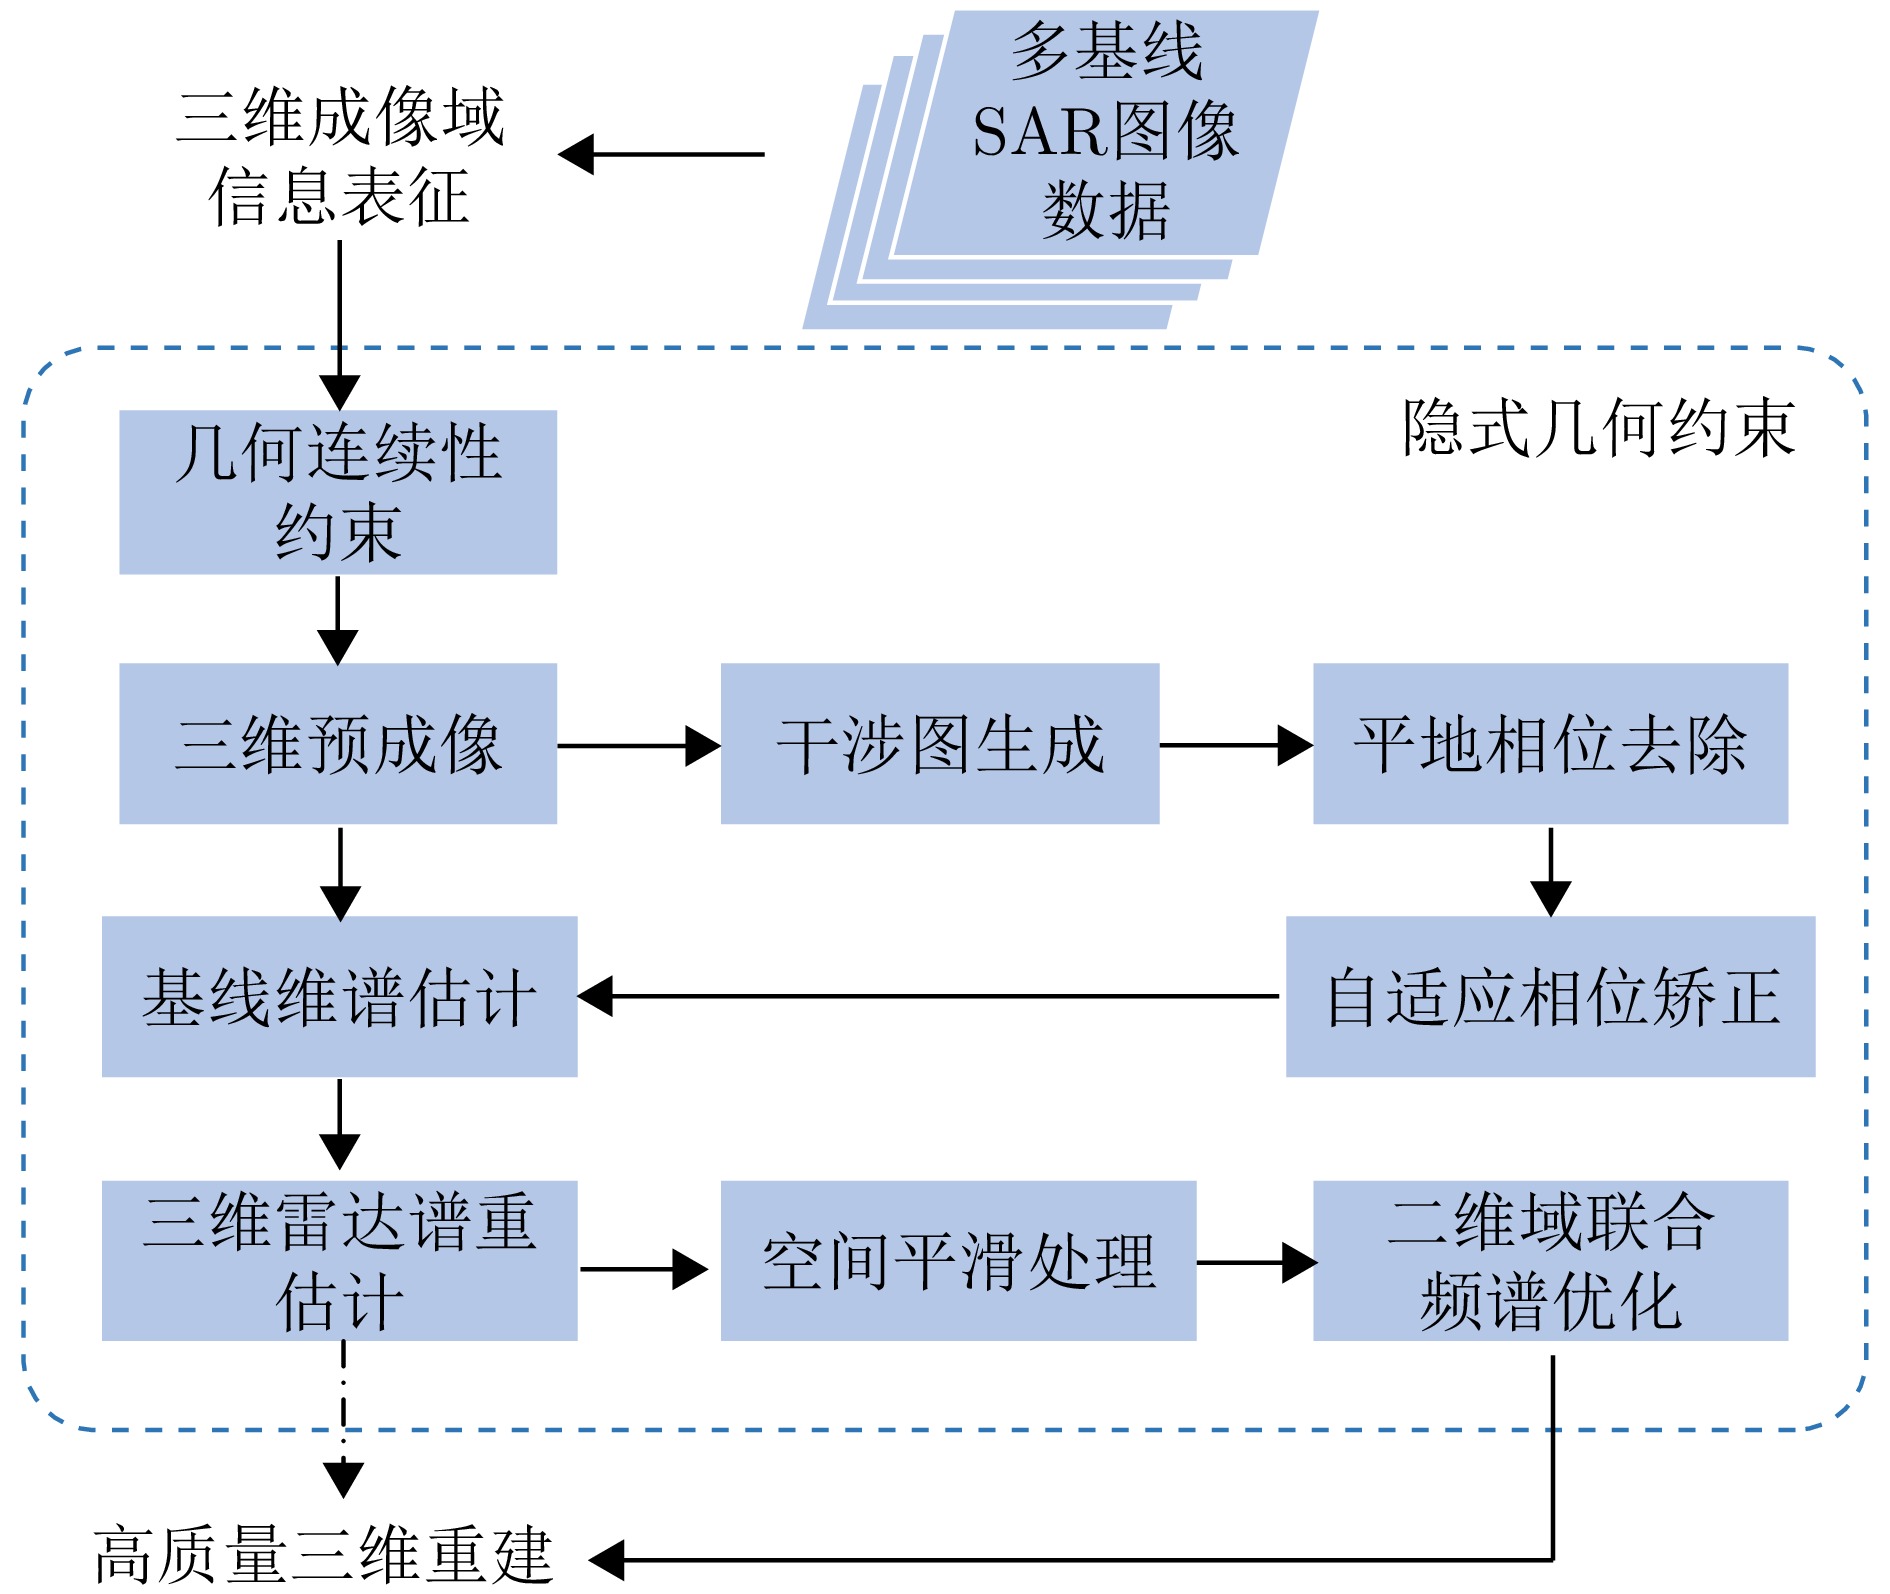
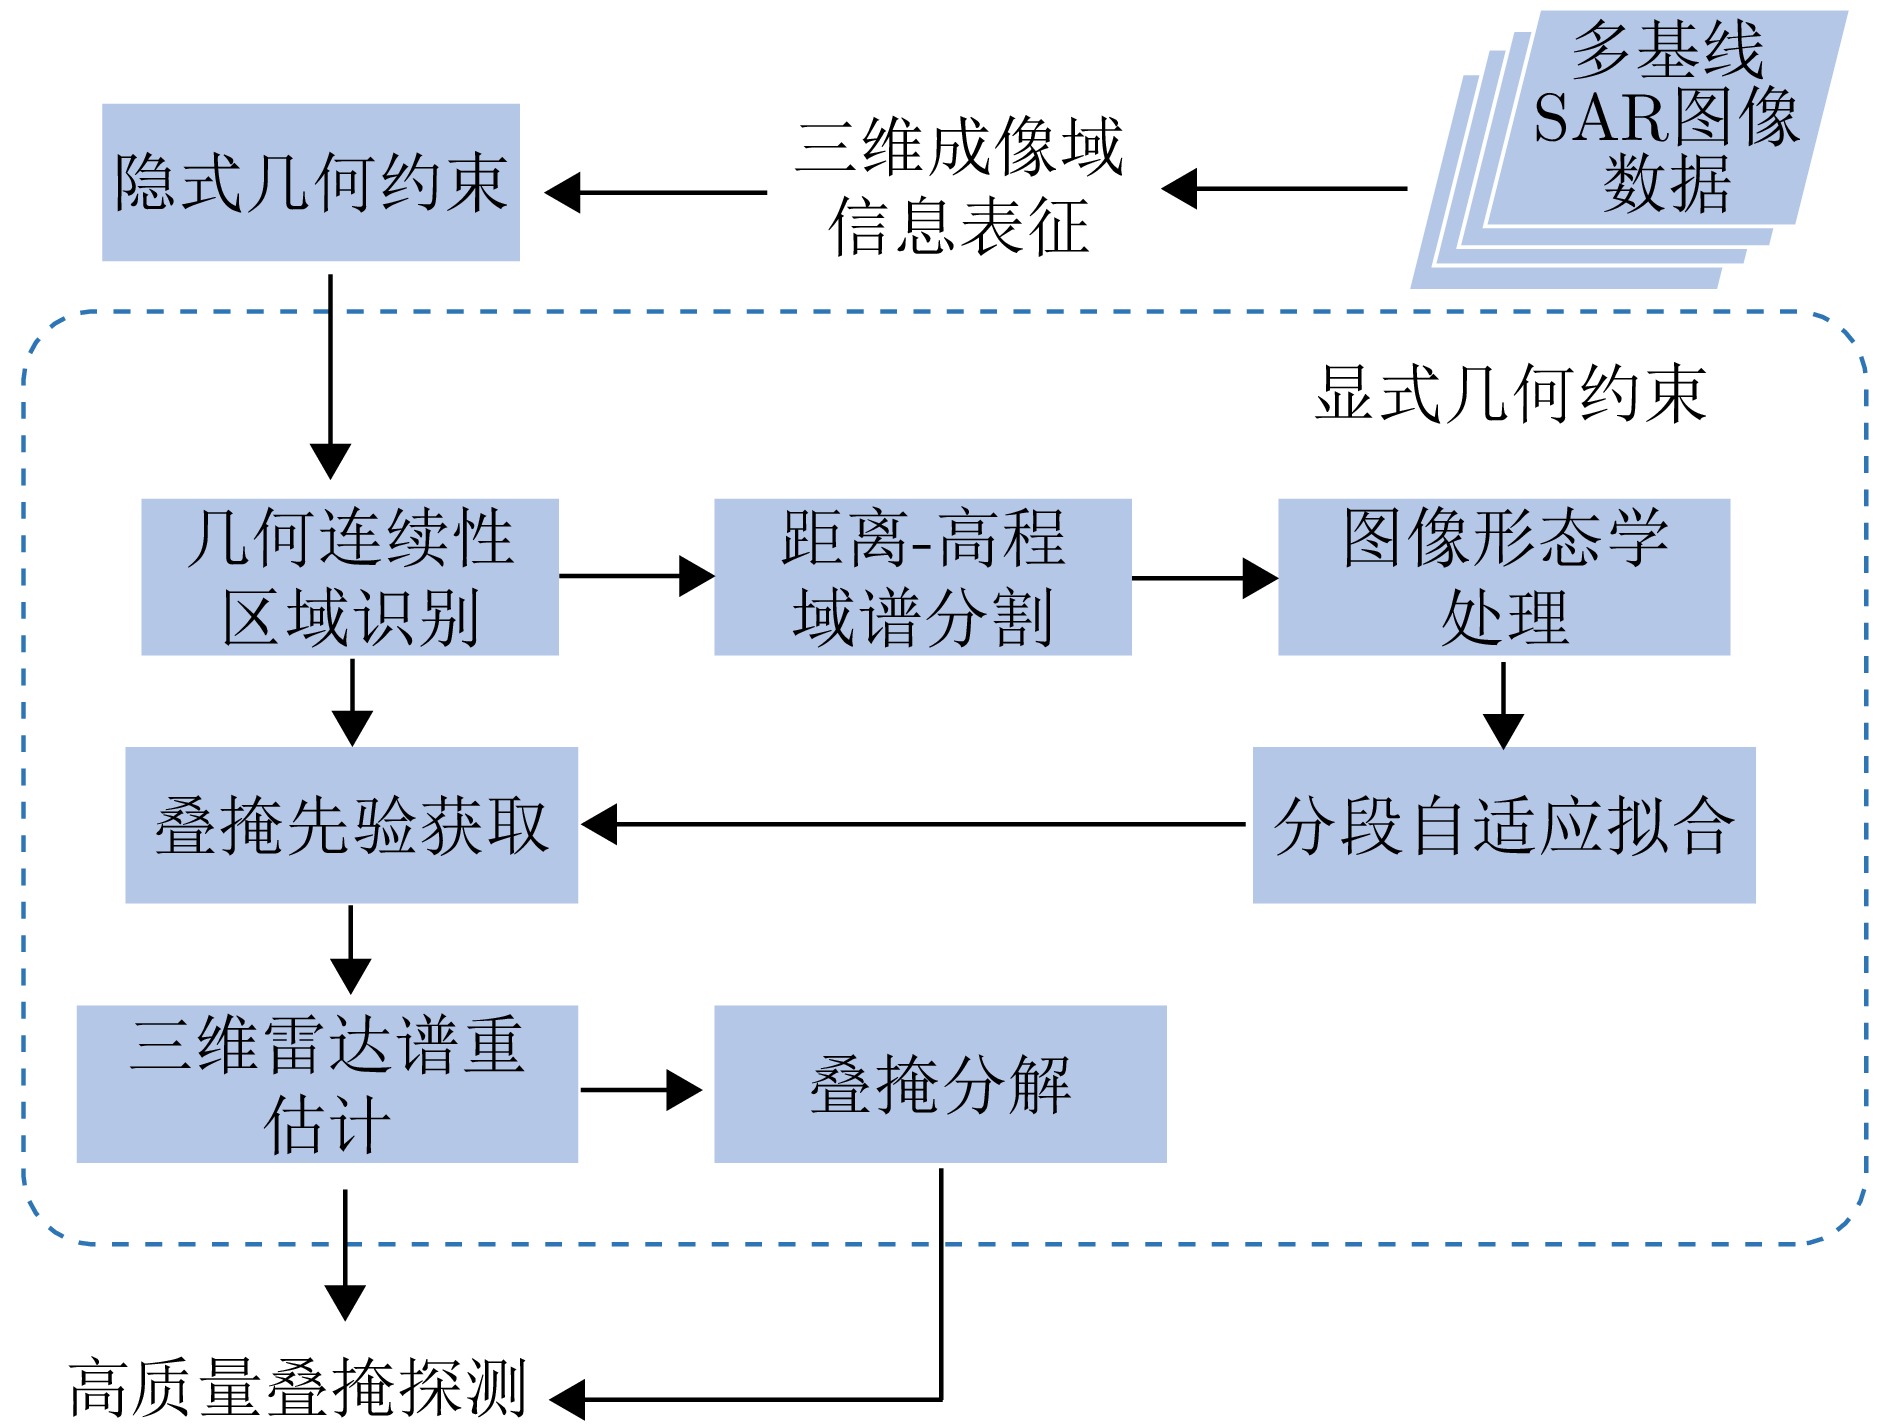
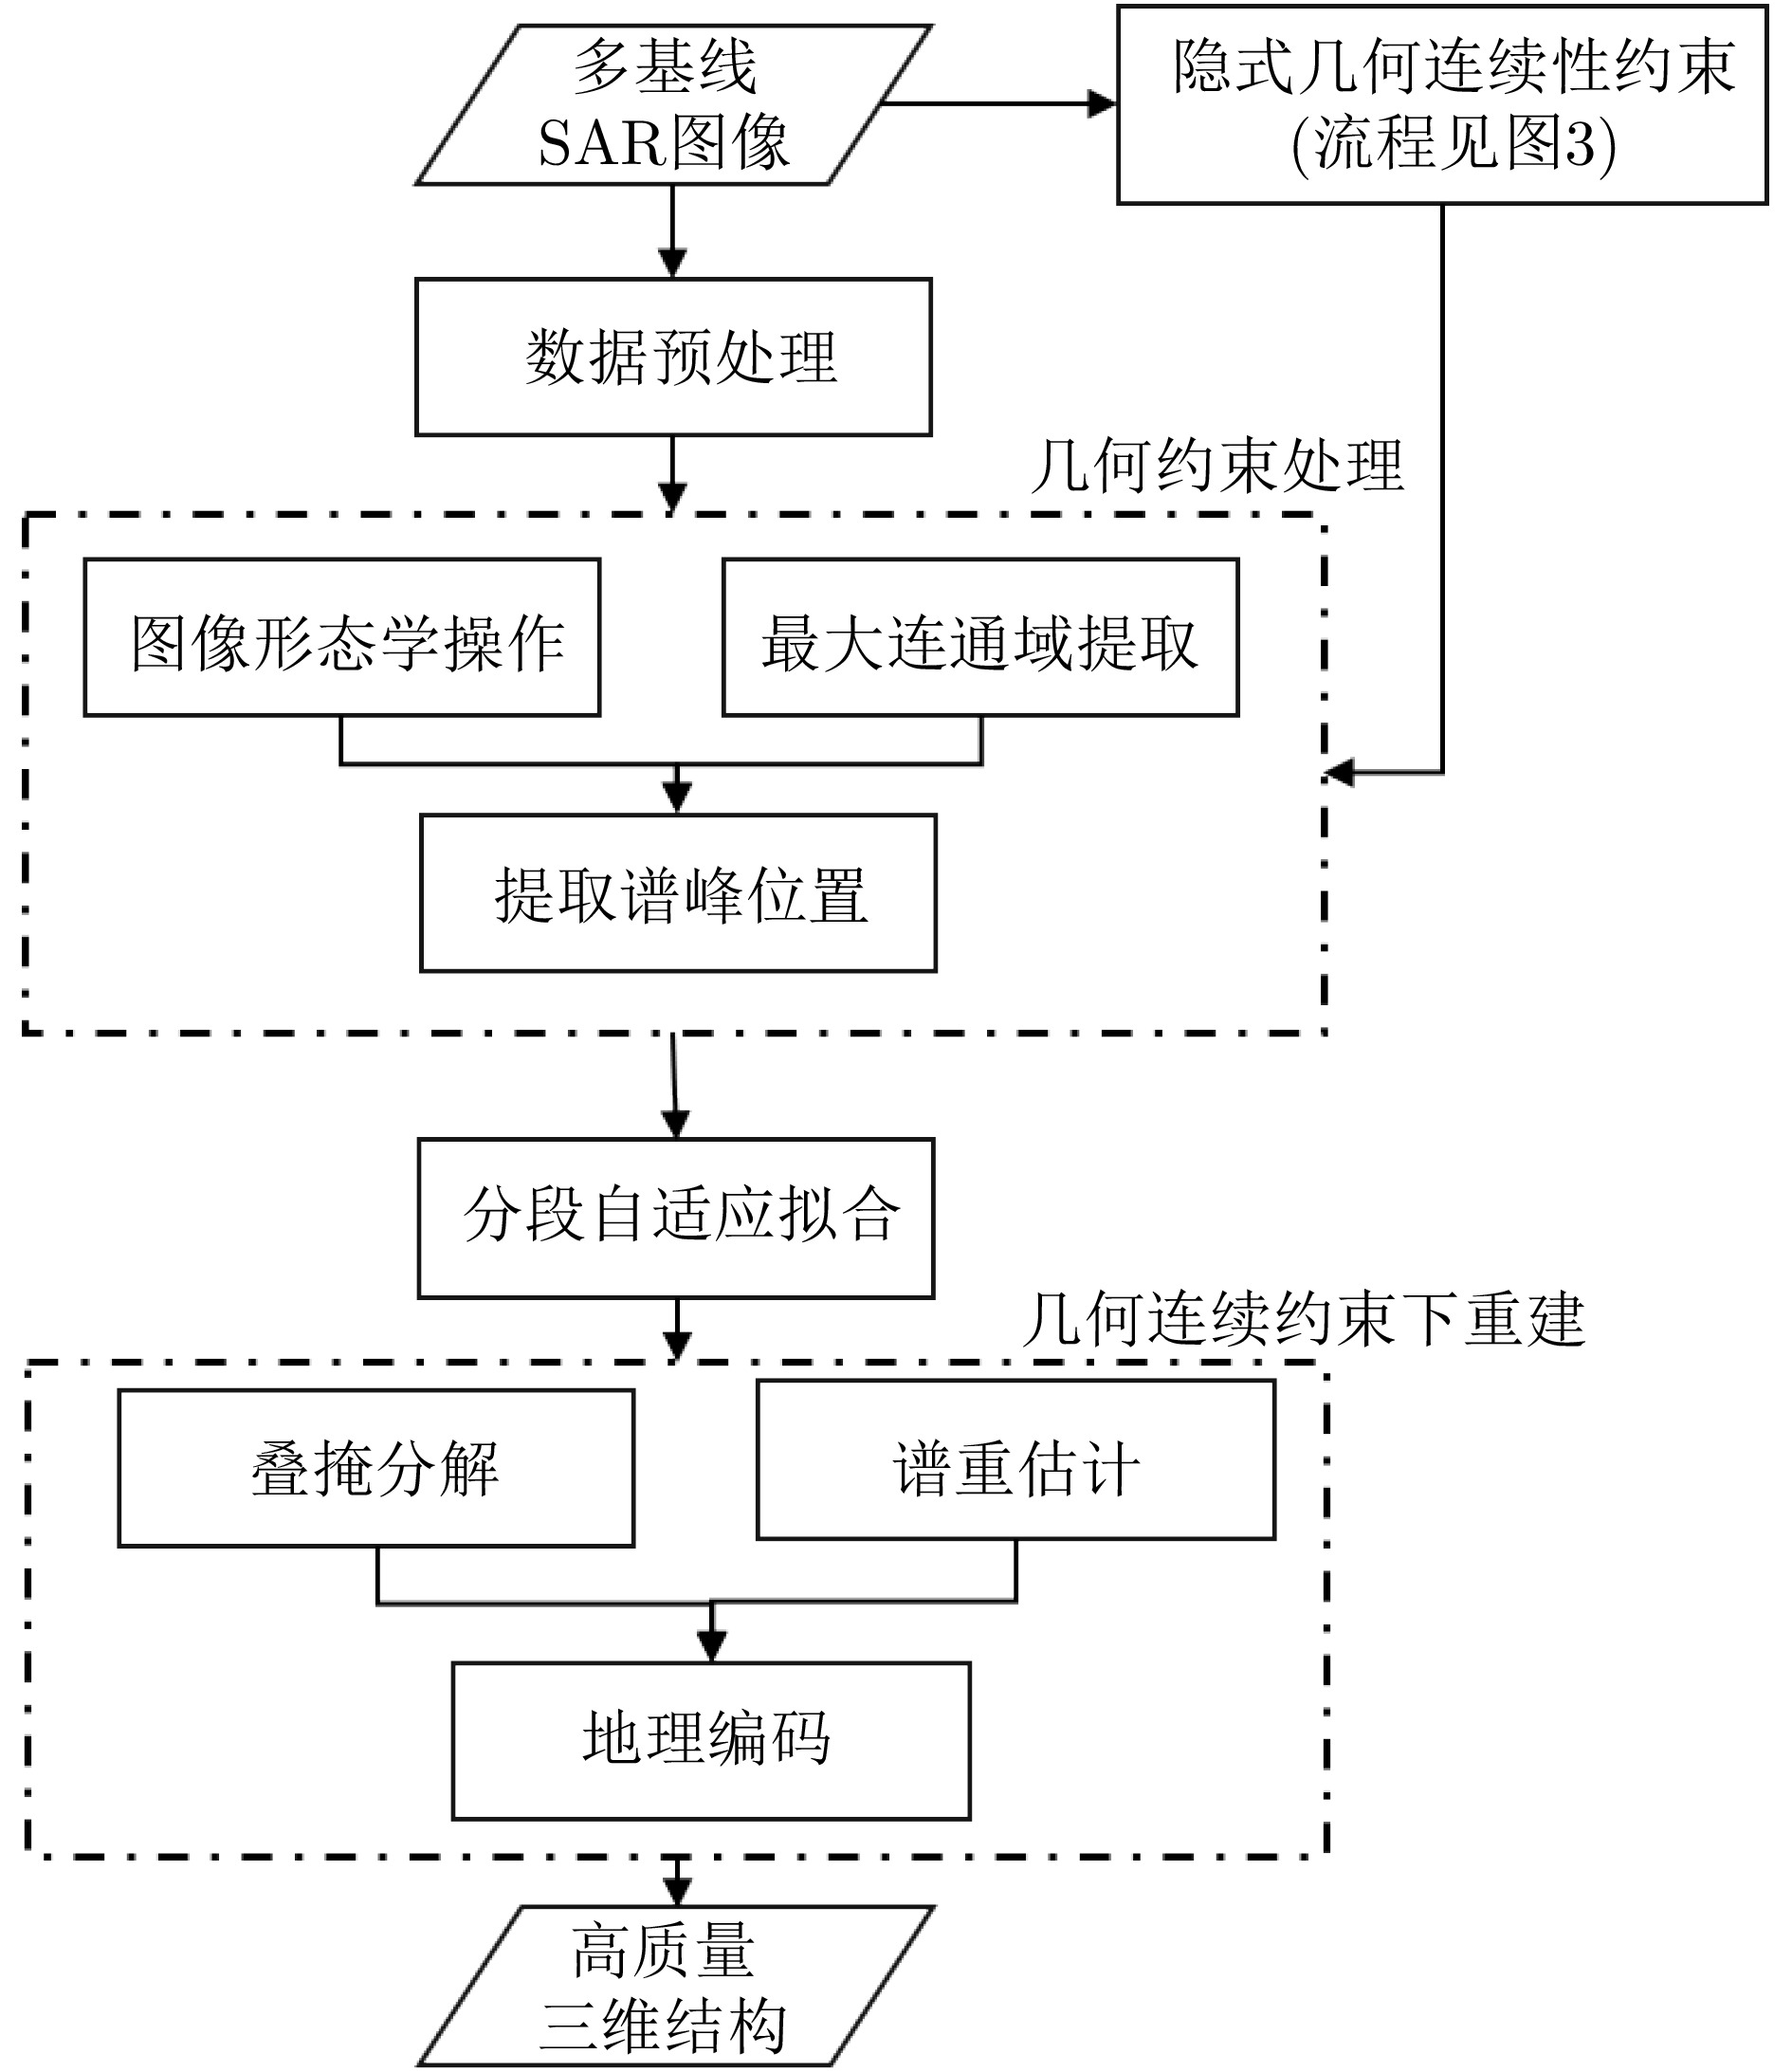
图 3 三维成像域信息表征中的隐式几何连续性约束
Figure 3. Implicit geometric continuity constraints in 3D imaging domain information representation
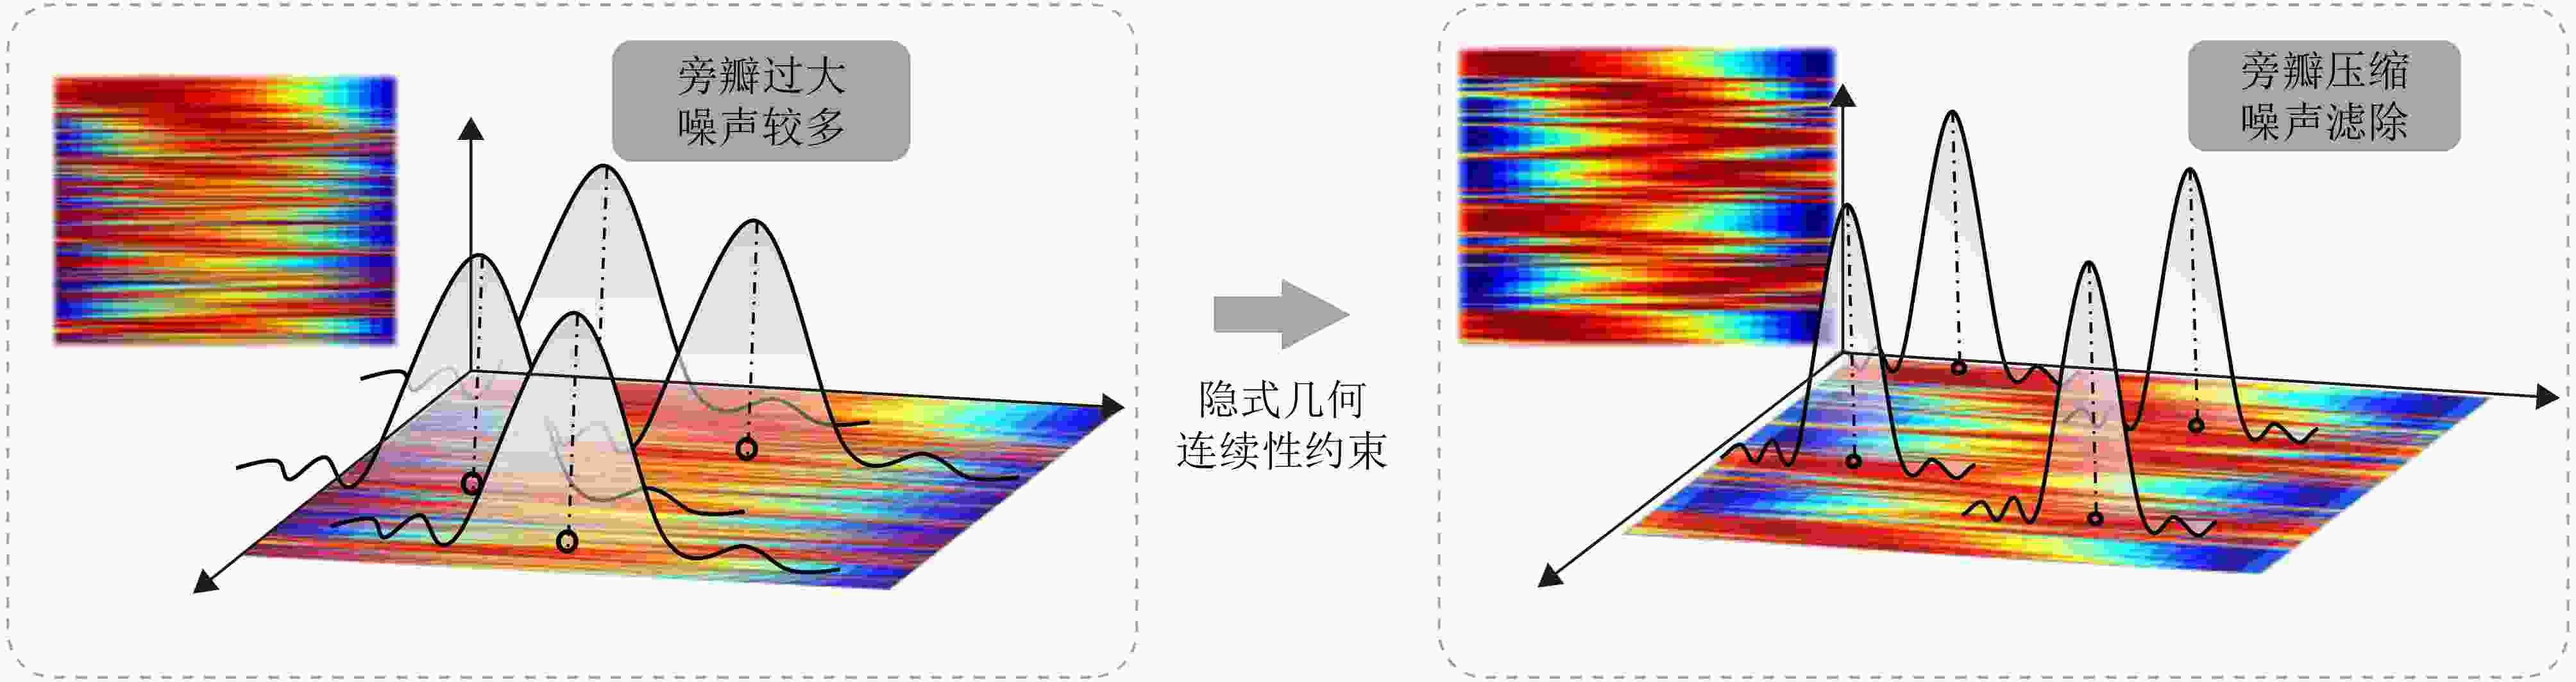
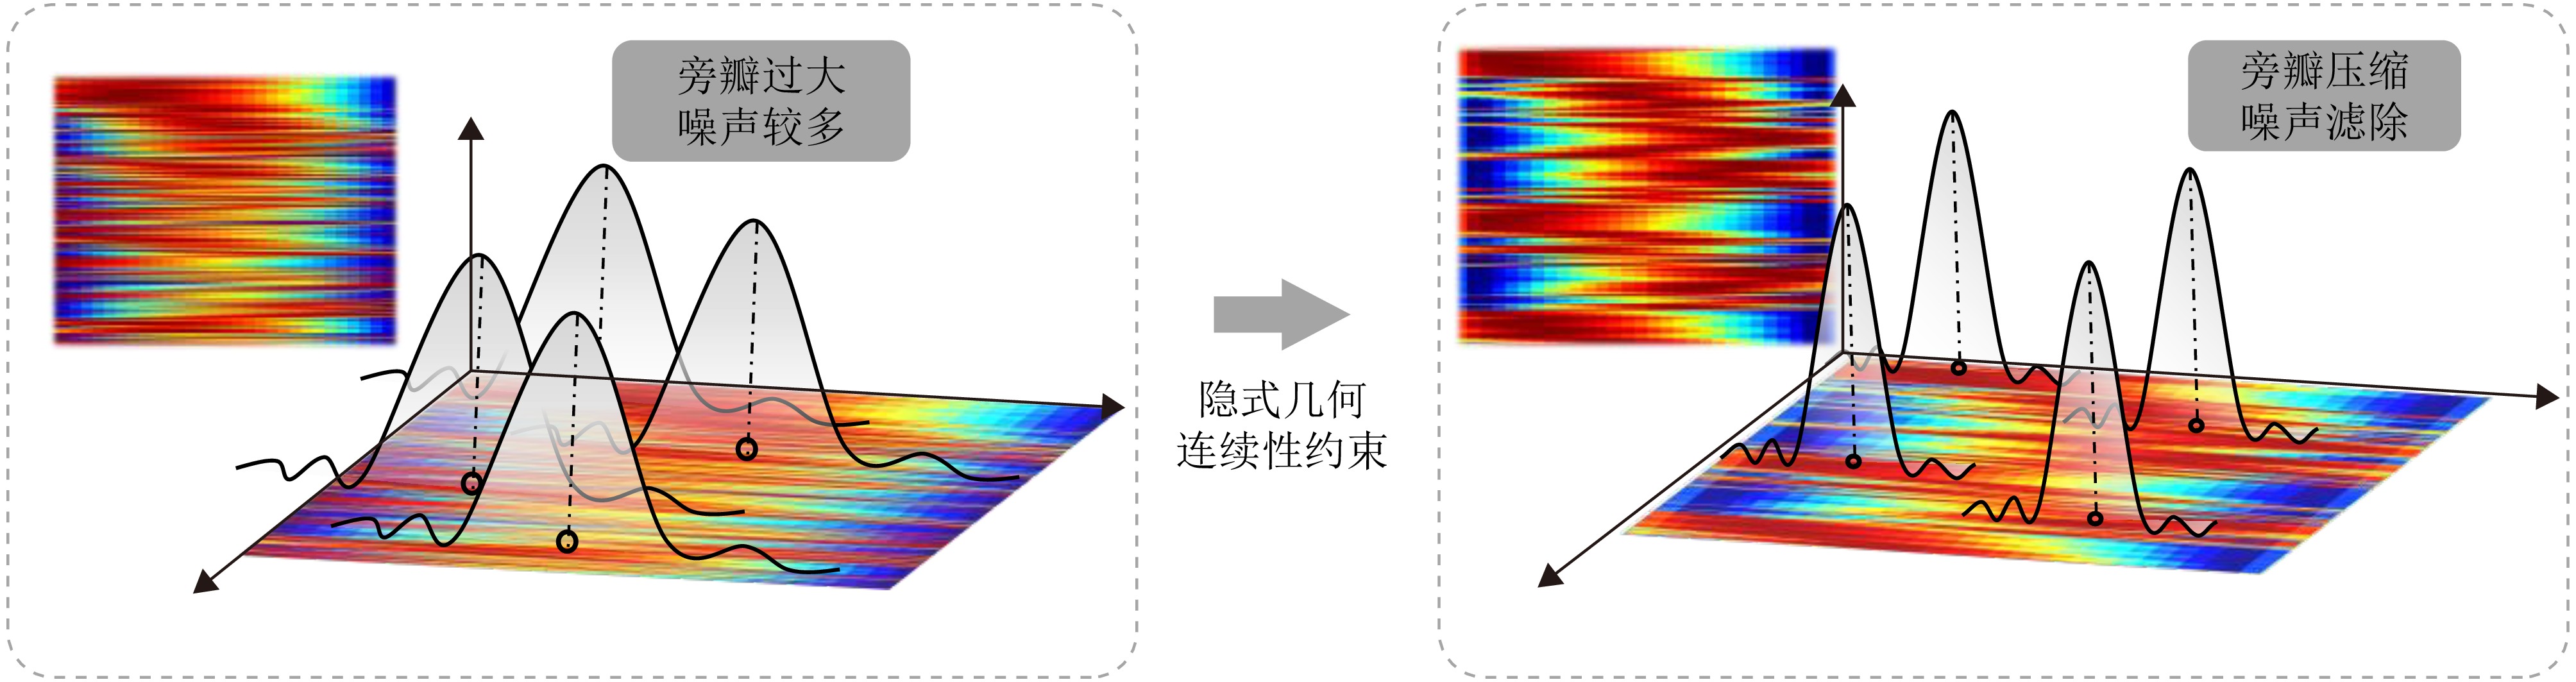
图 4 隐式几何连续性约束
Figure 4. Optimization diagram of implicit geometric continuity constraints
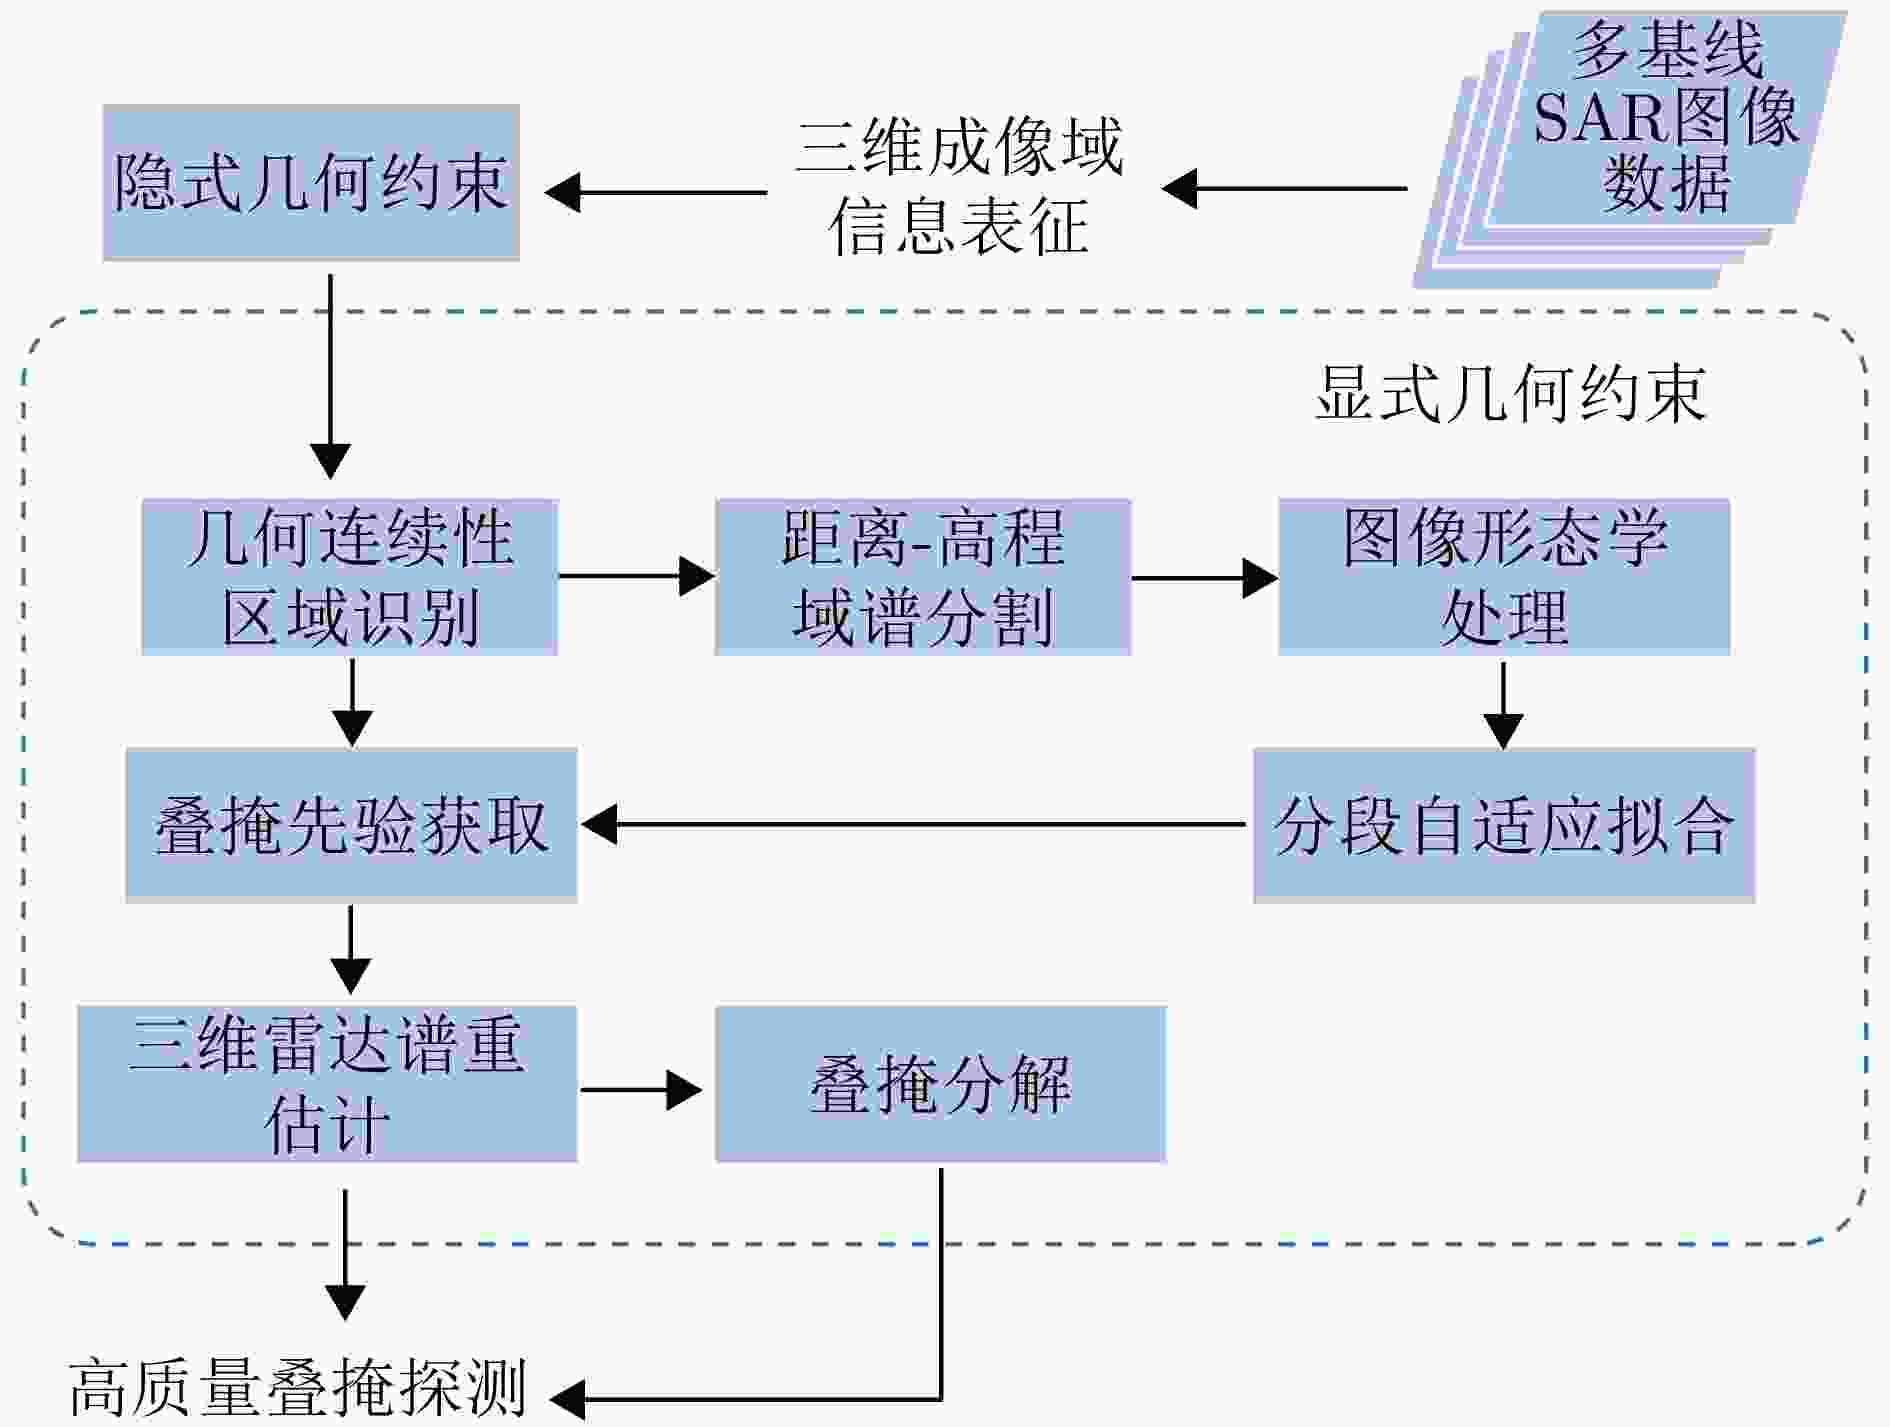
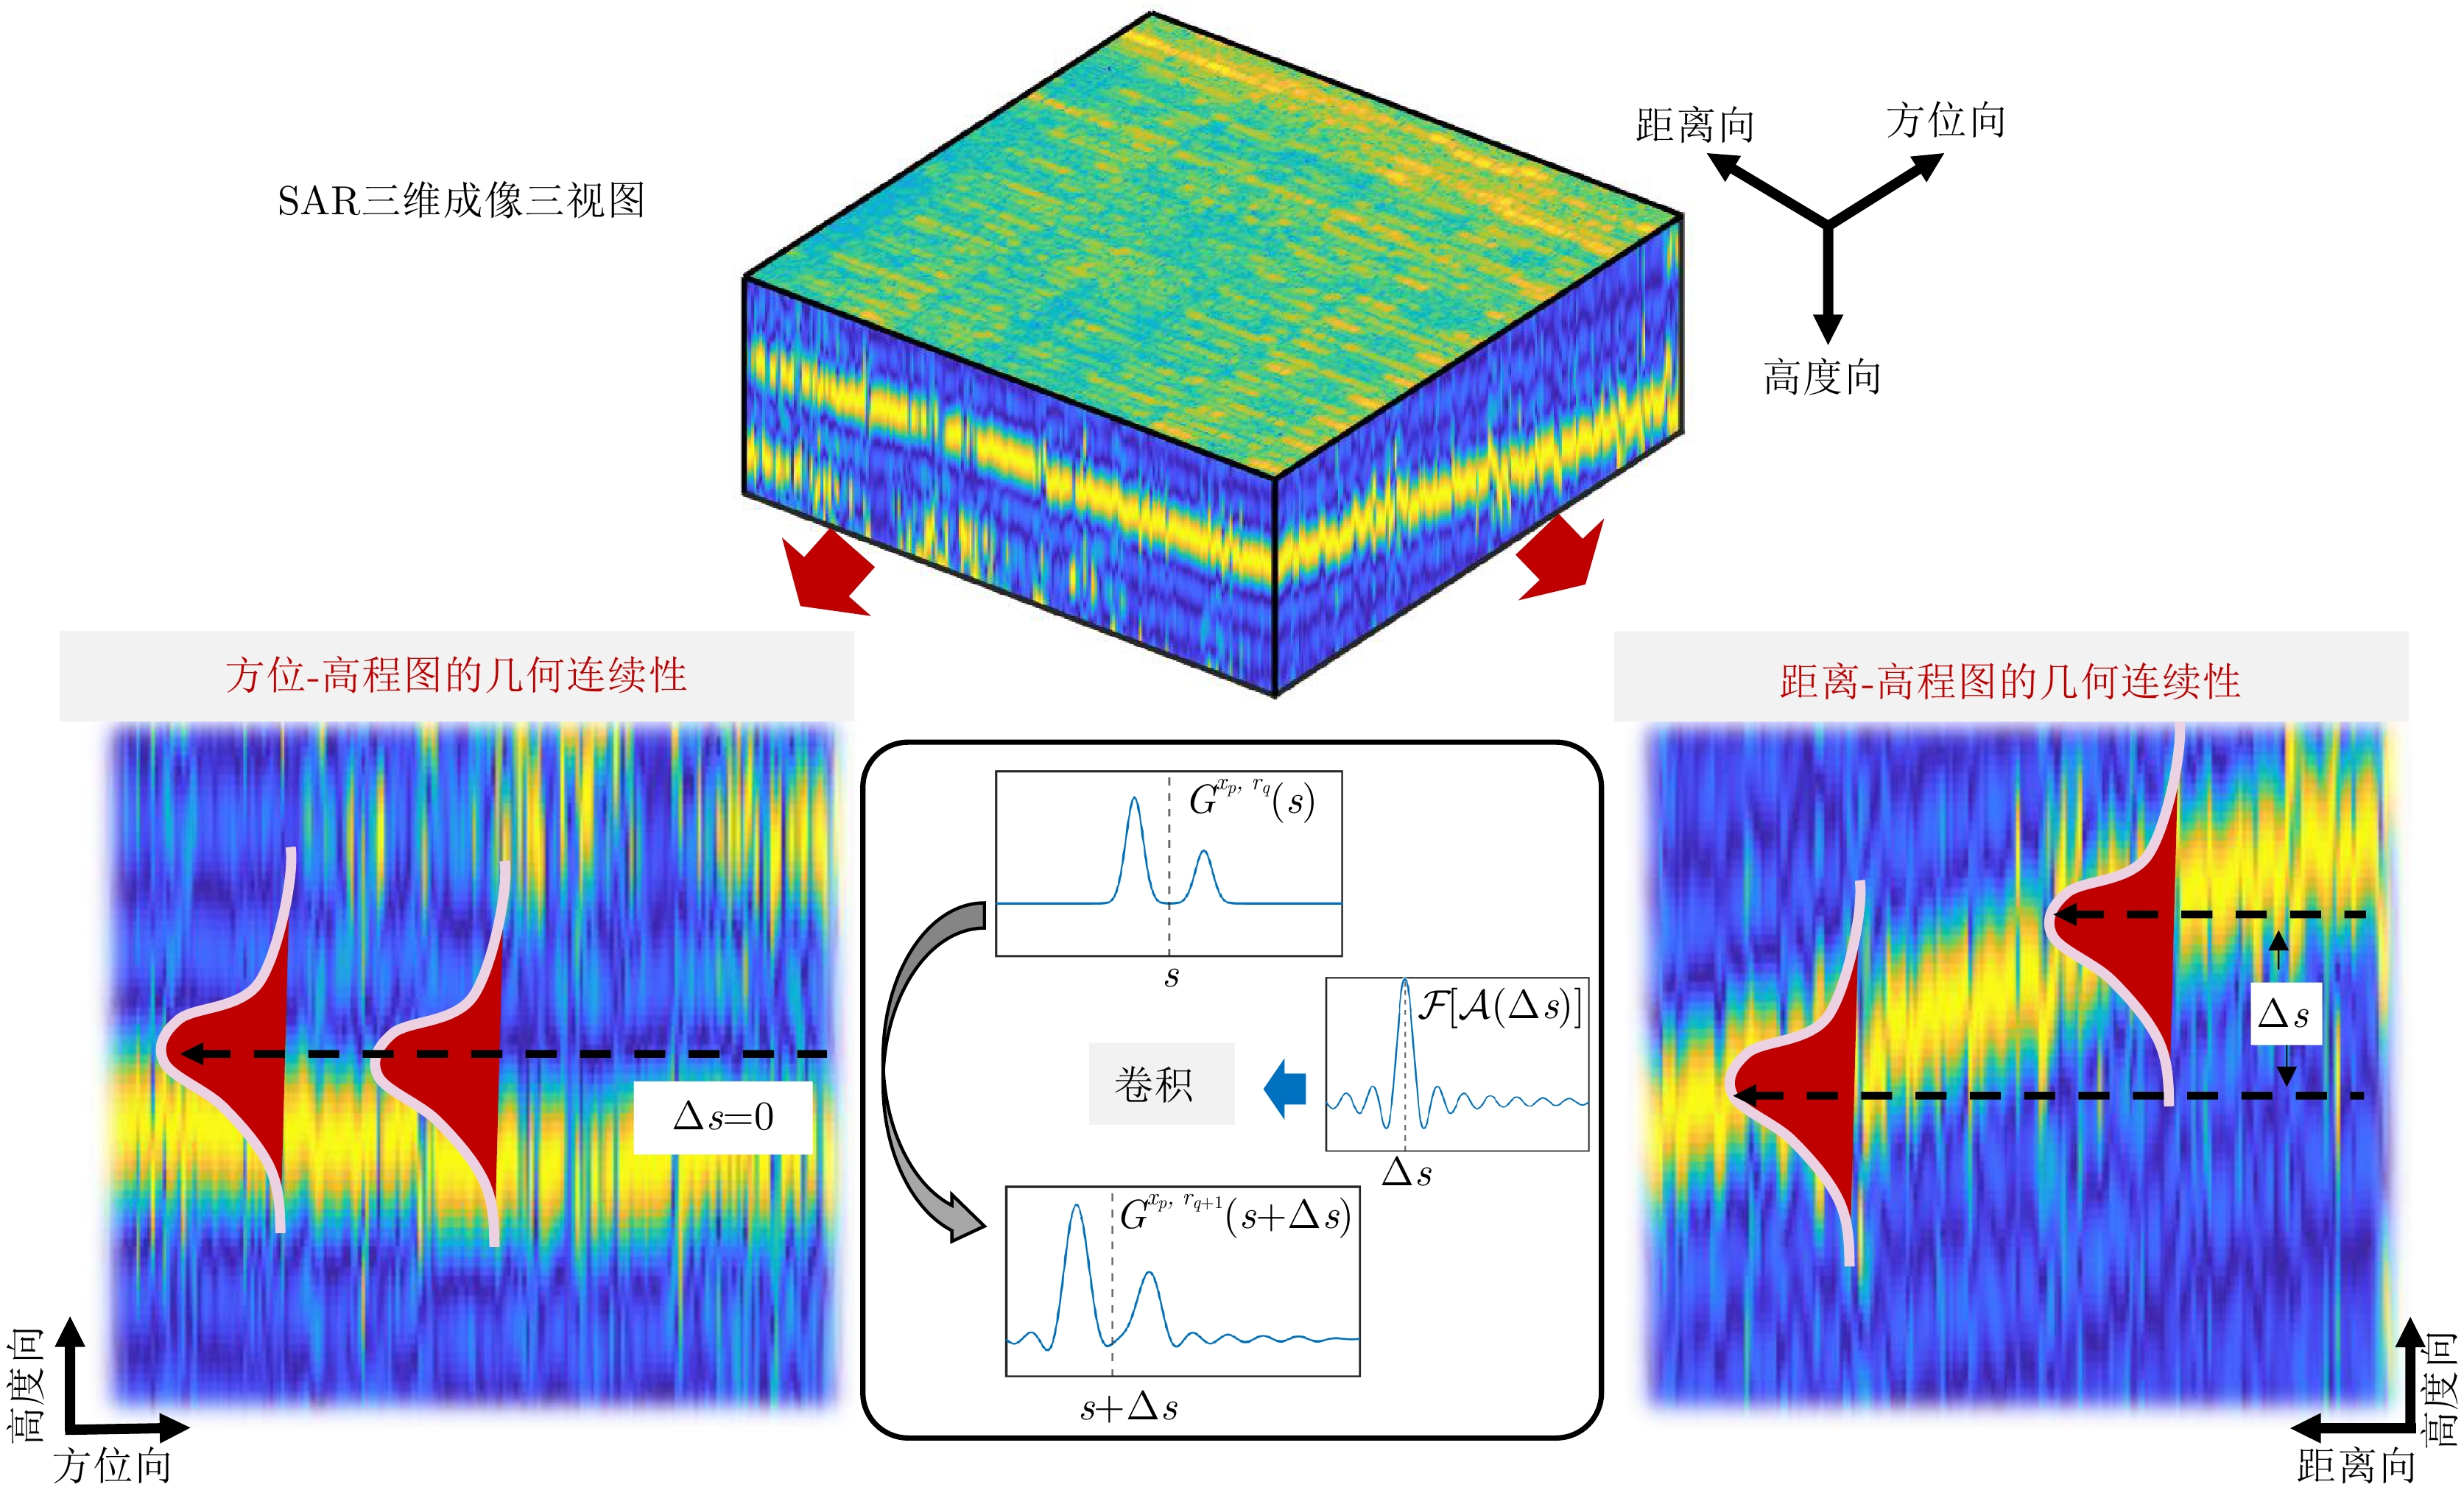
图 5 三维成像域信息表征的显式几何连续性约束
Figure 5. Explicit geometric continuity constraints in 3D imaging domain information representation

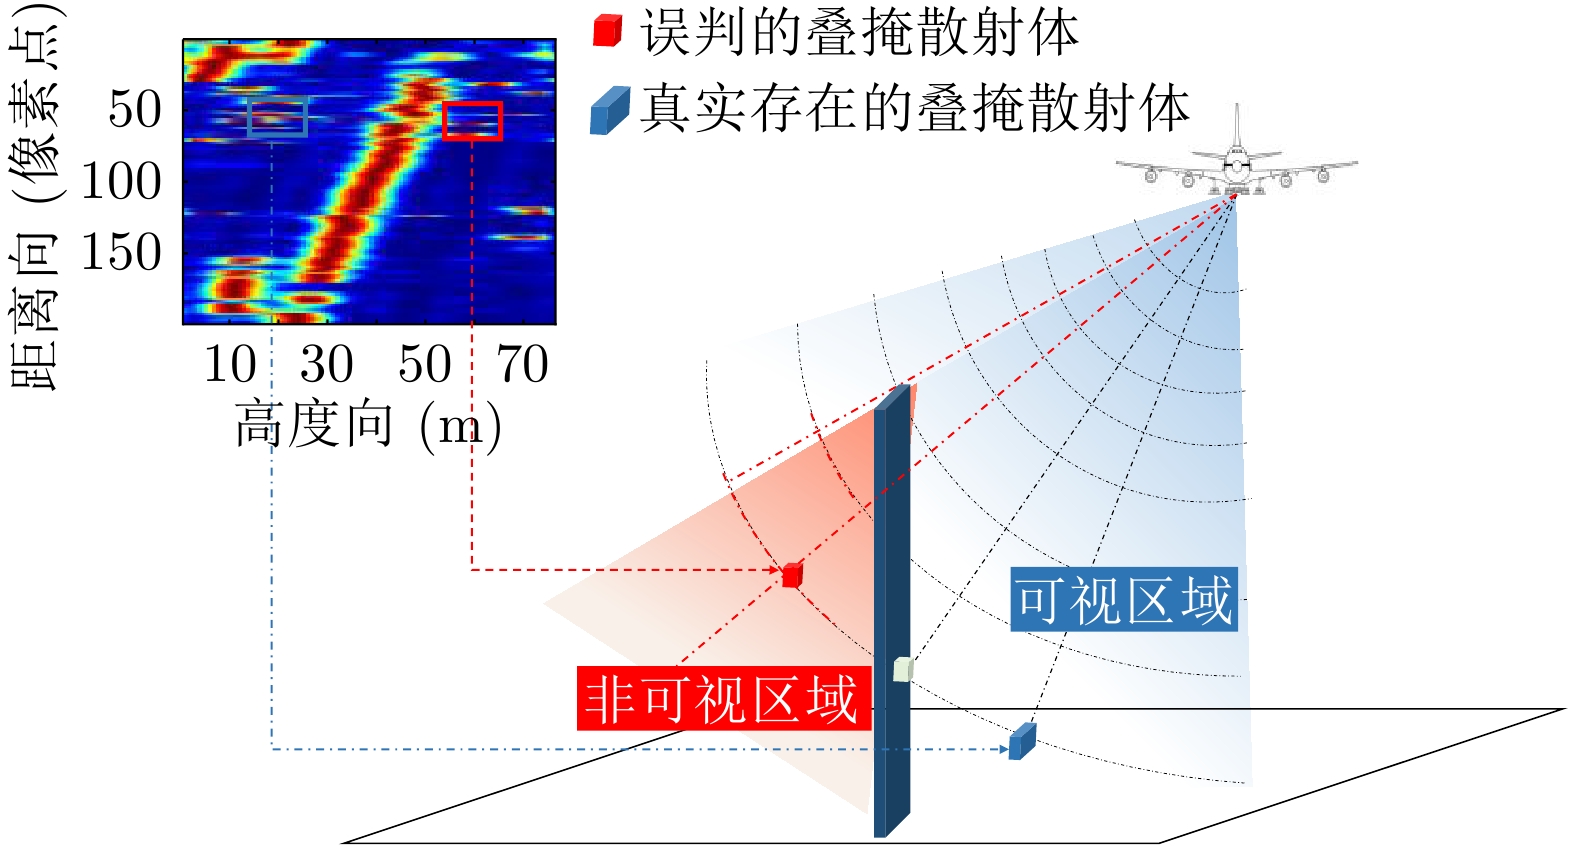
图 6 显式约束下雷达朝向异常场景
Figure 6. Radar orientation anomaly scenario under explicit constraints
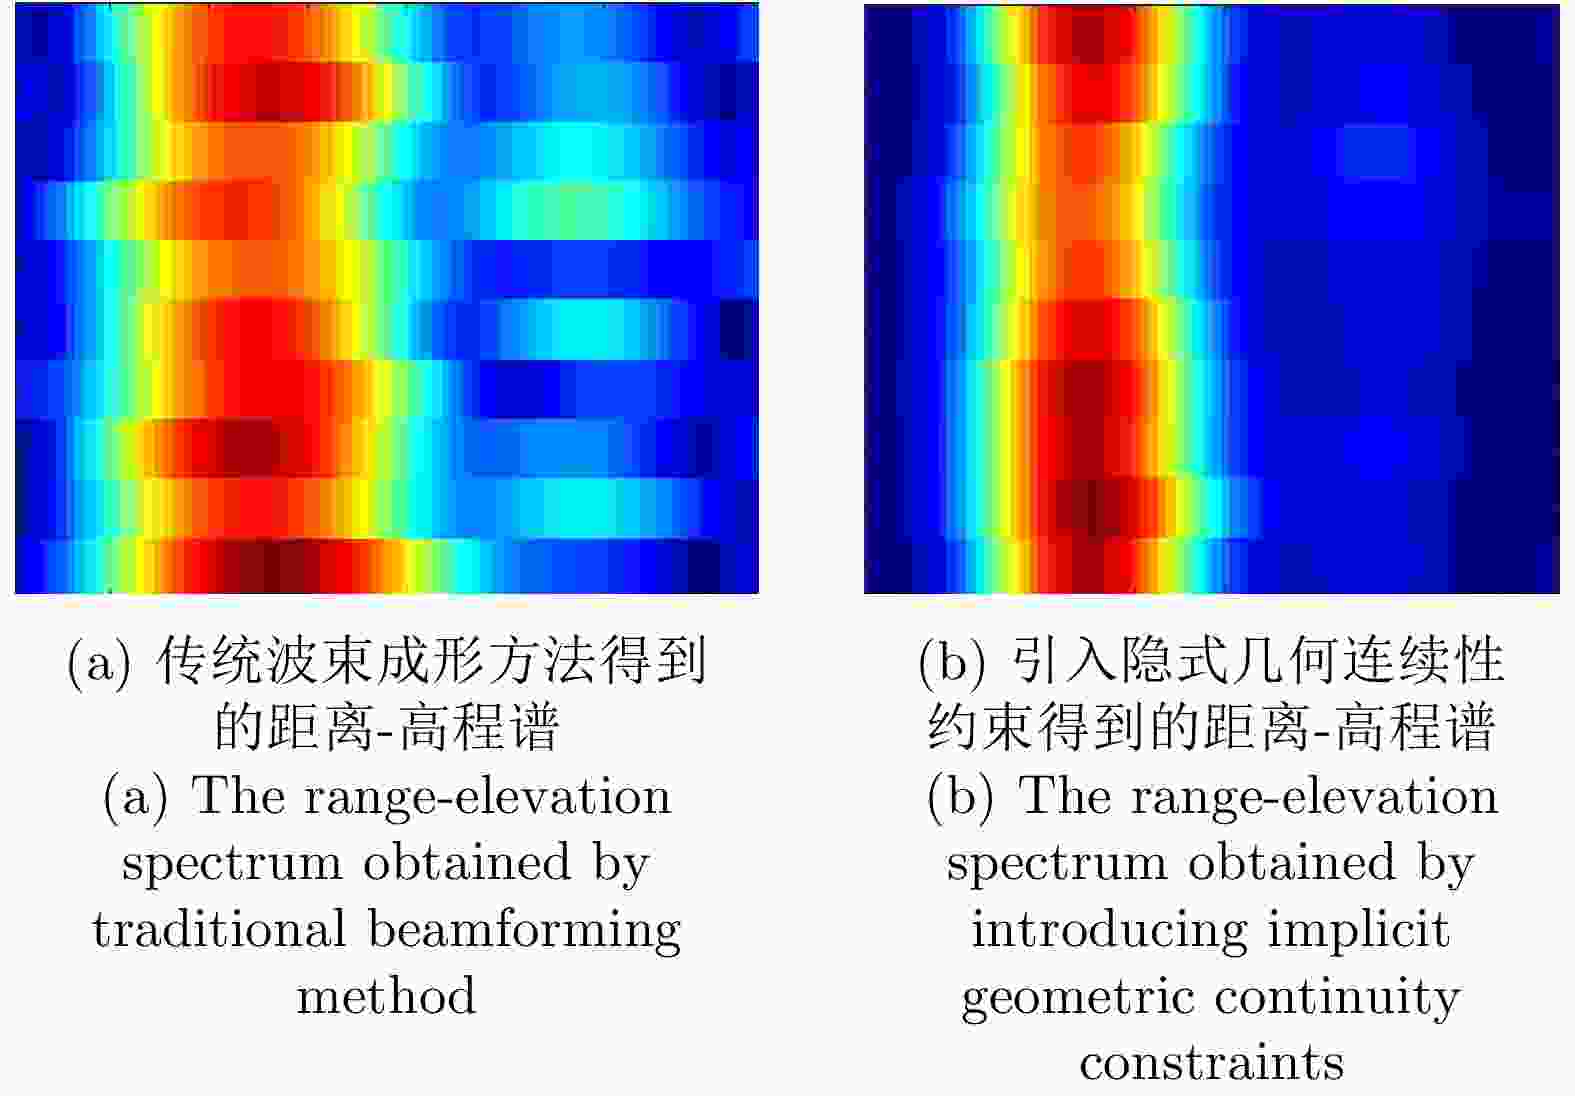
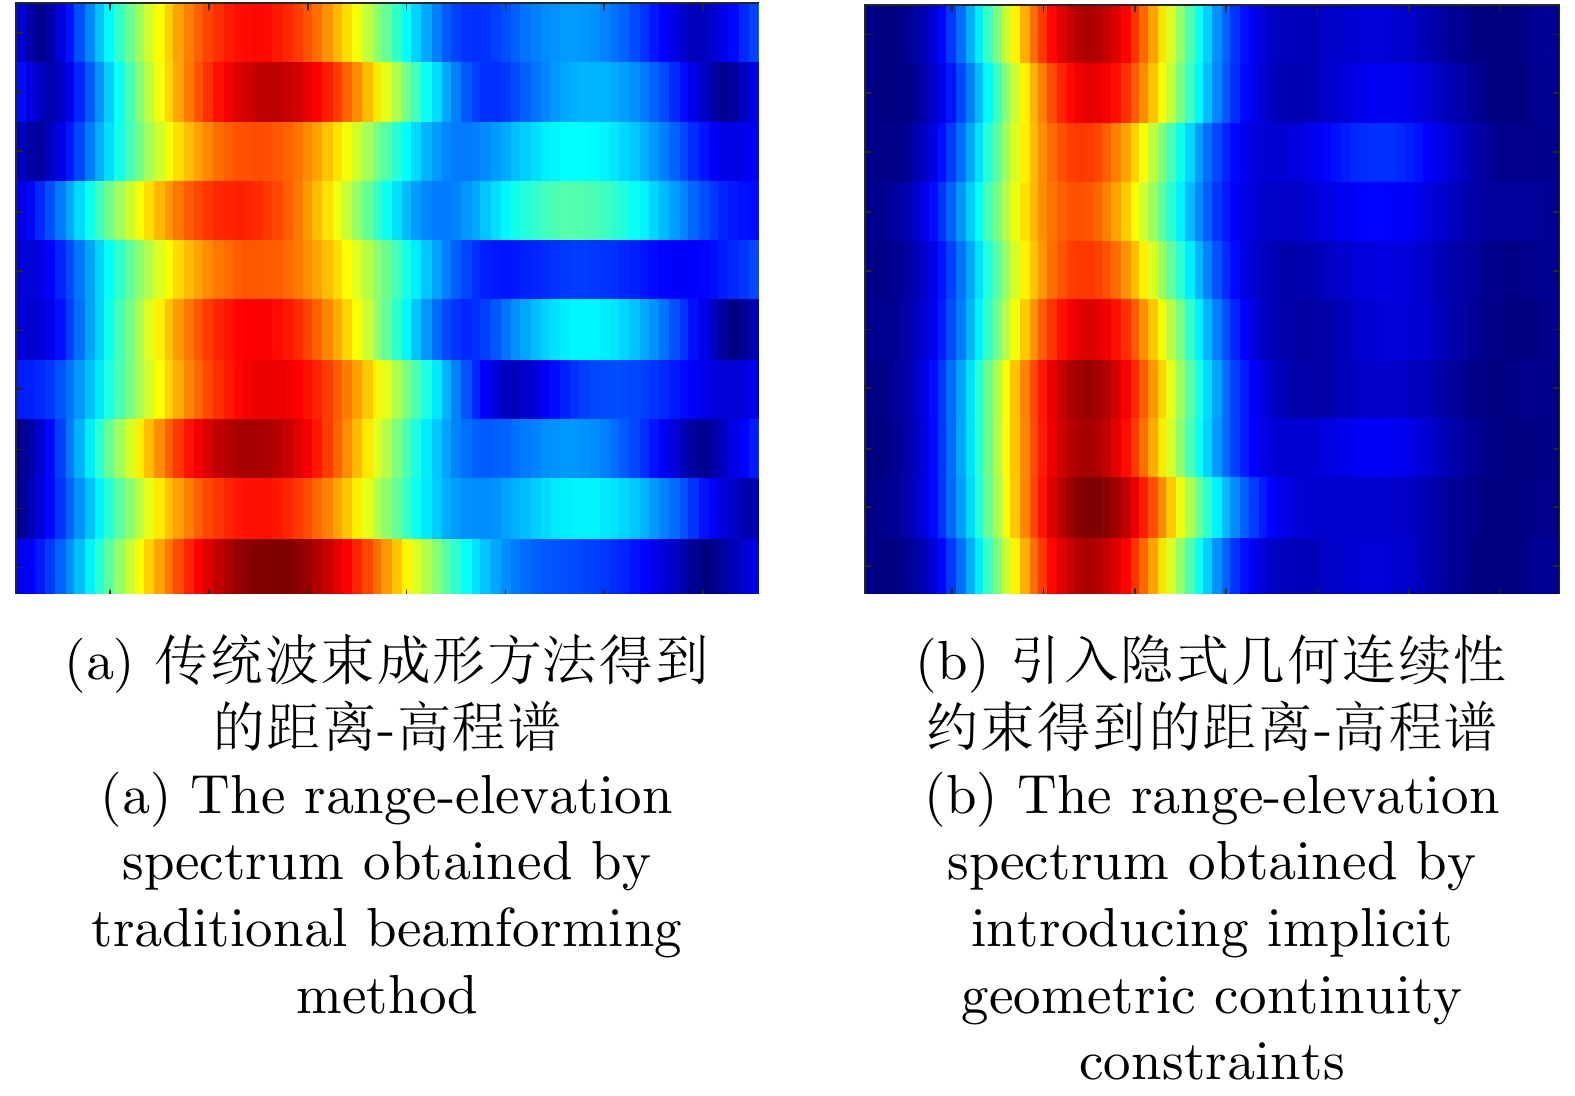
图 7 仿真数据距离-高程重建性能比较
Figure 7. Comparison of distance-elevation reconstruction performance of simulation data
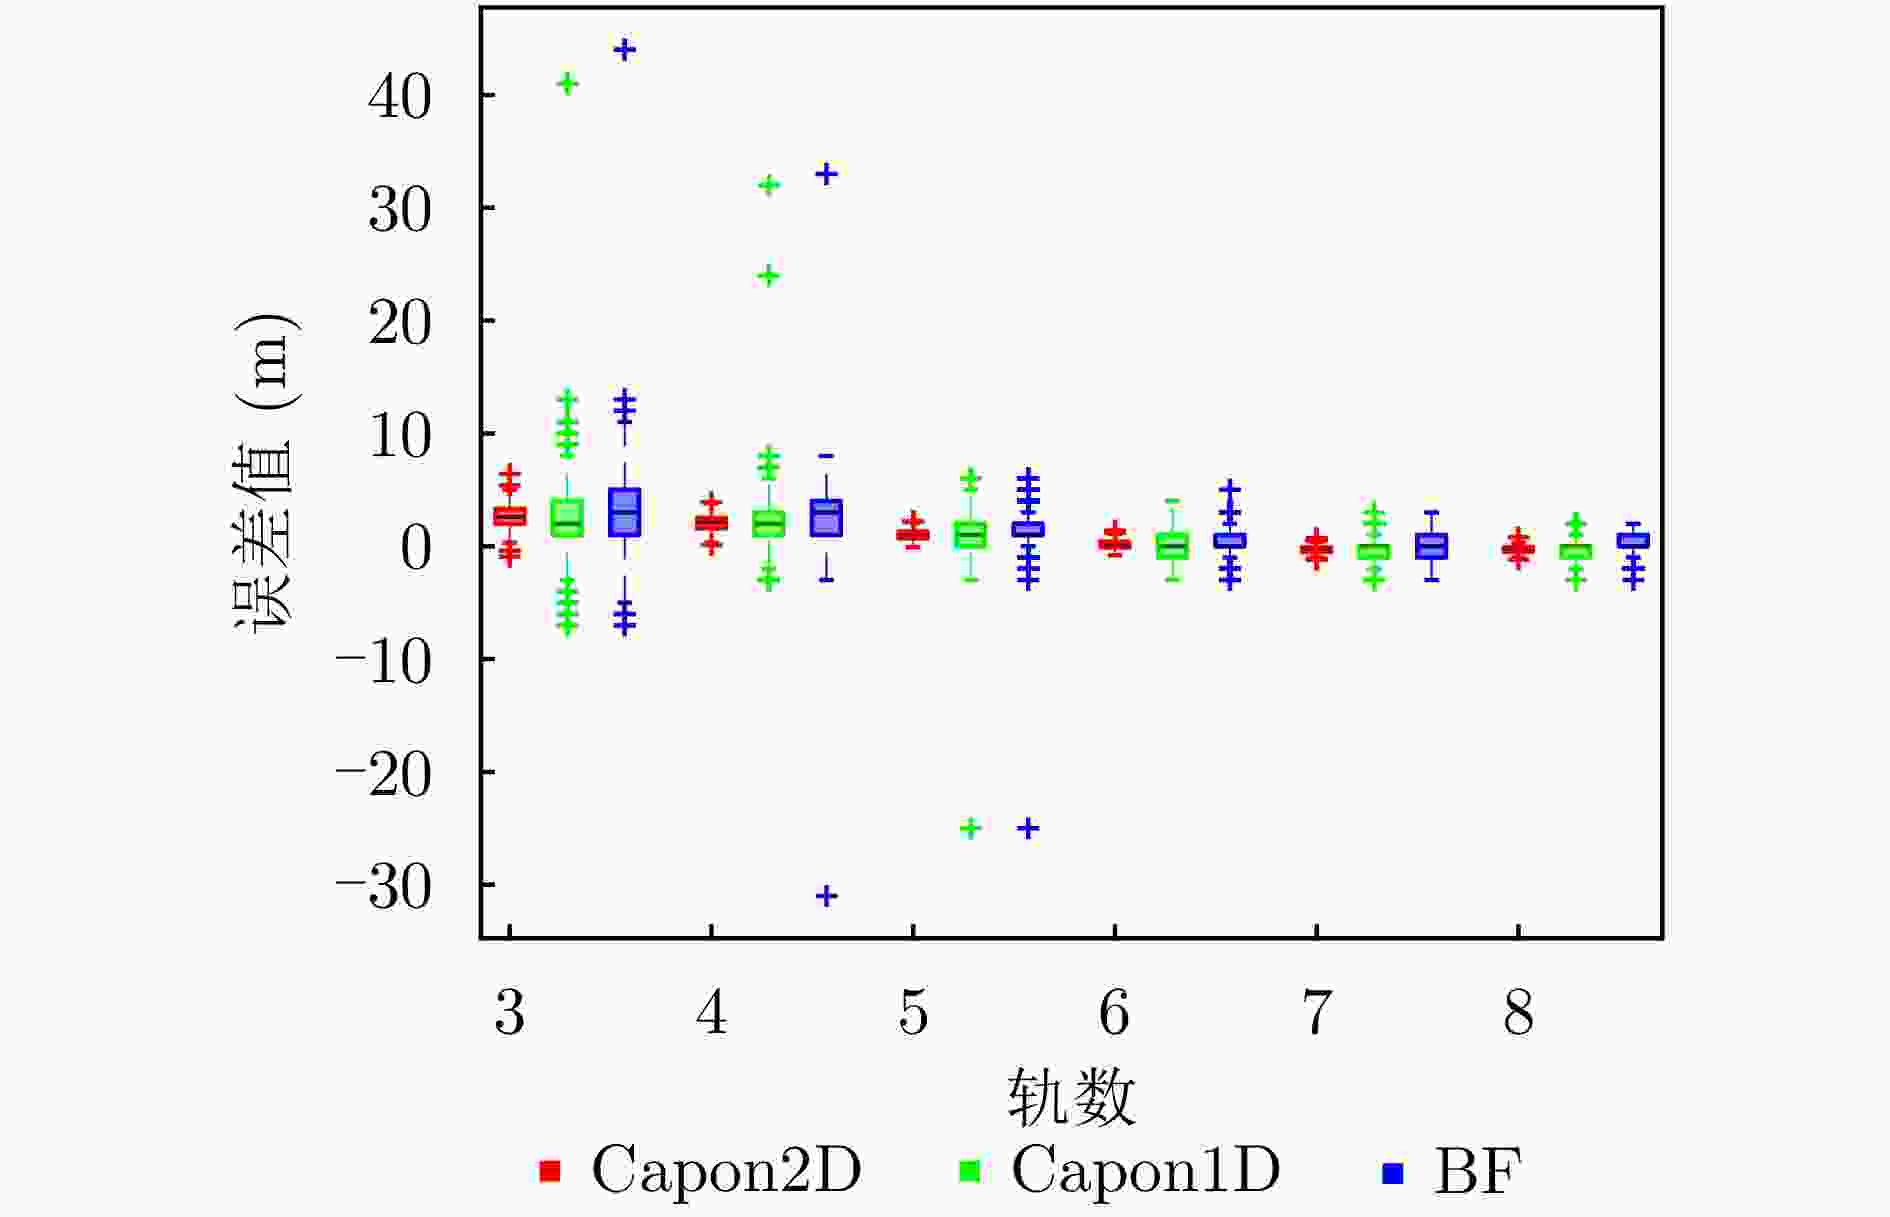
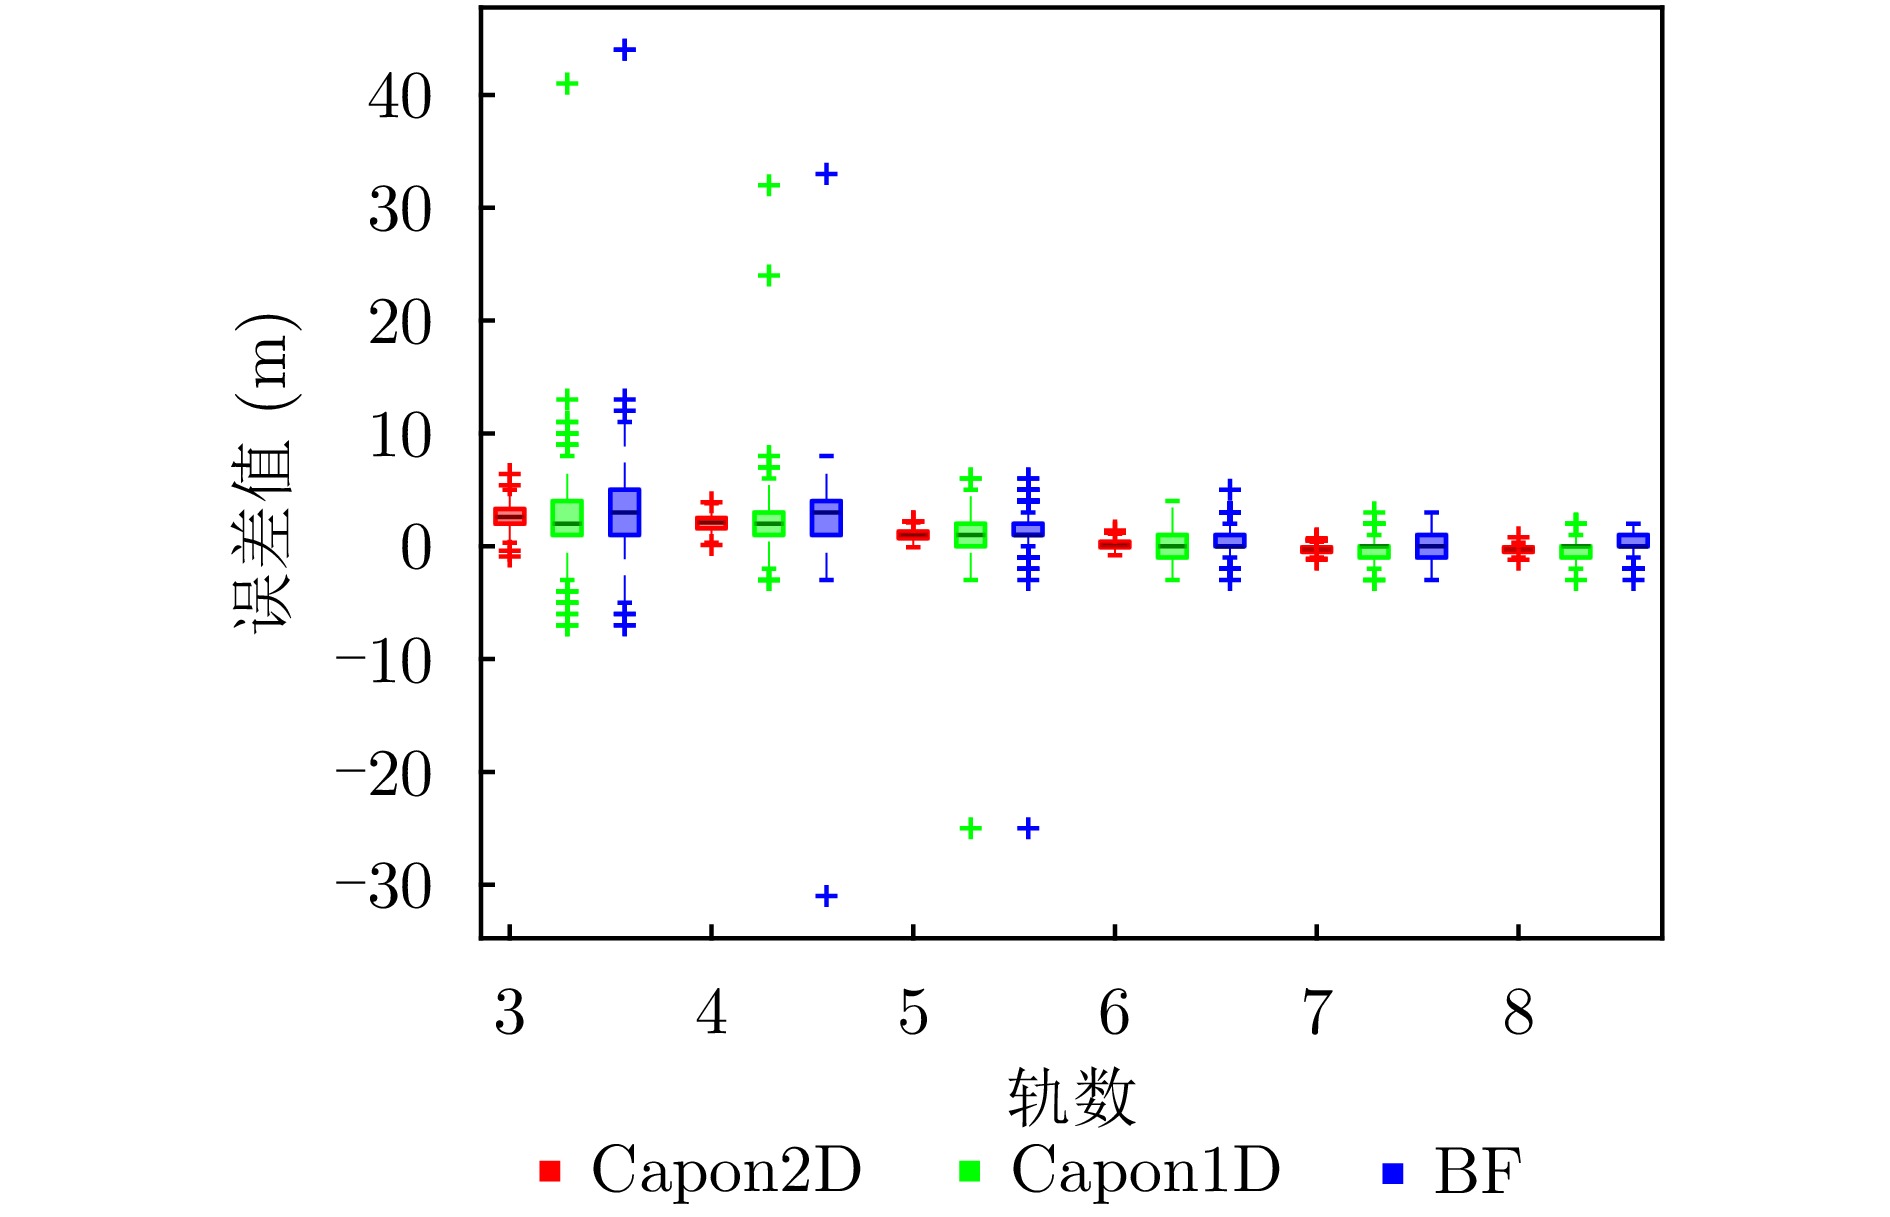
图 8 不同轨数下隐式几何约束、一维Capon、波束成形3种方法计算高程与真值的偏差箱线图
Figure 8. The box plot of deviation between elevation and true value is calculated by three methods: Implicit geometric constraint, one-dimensional Capon and beamforming
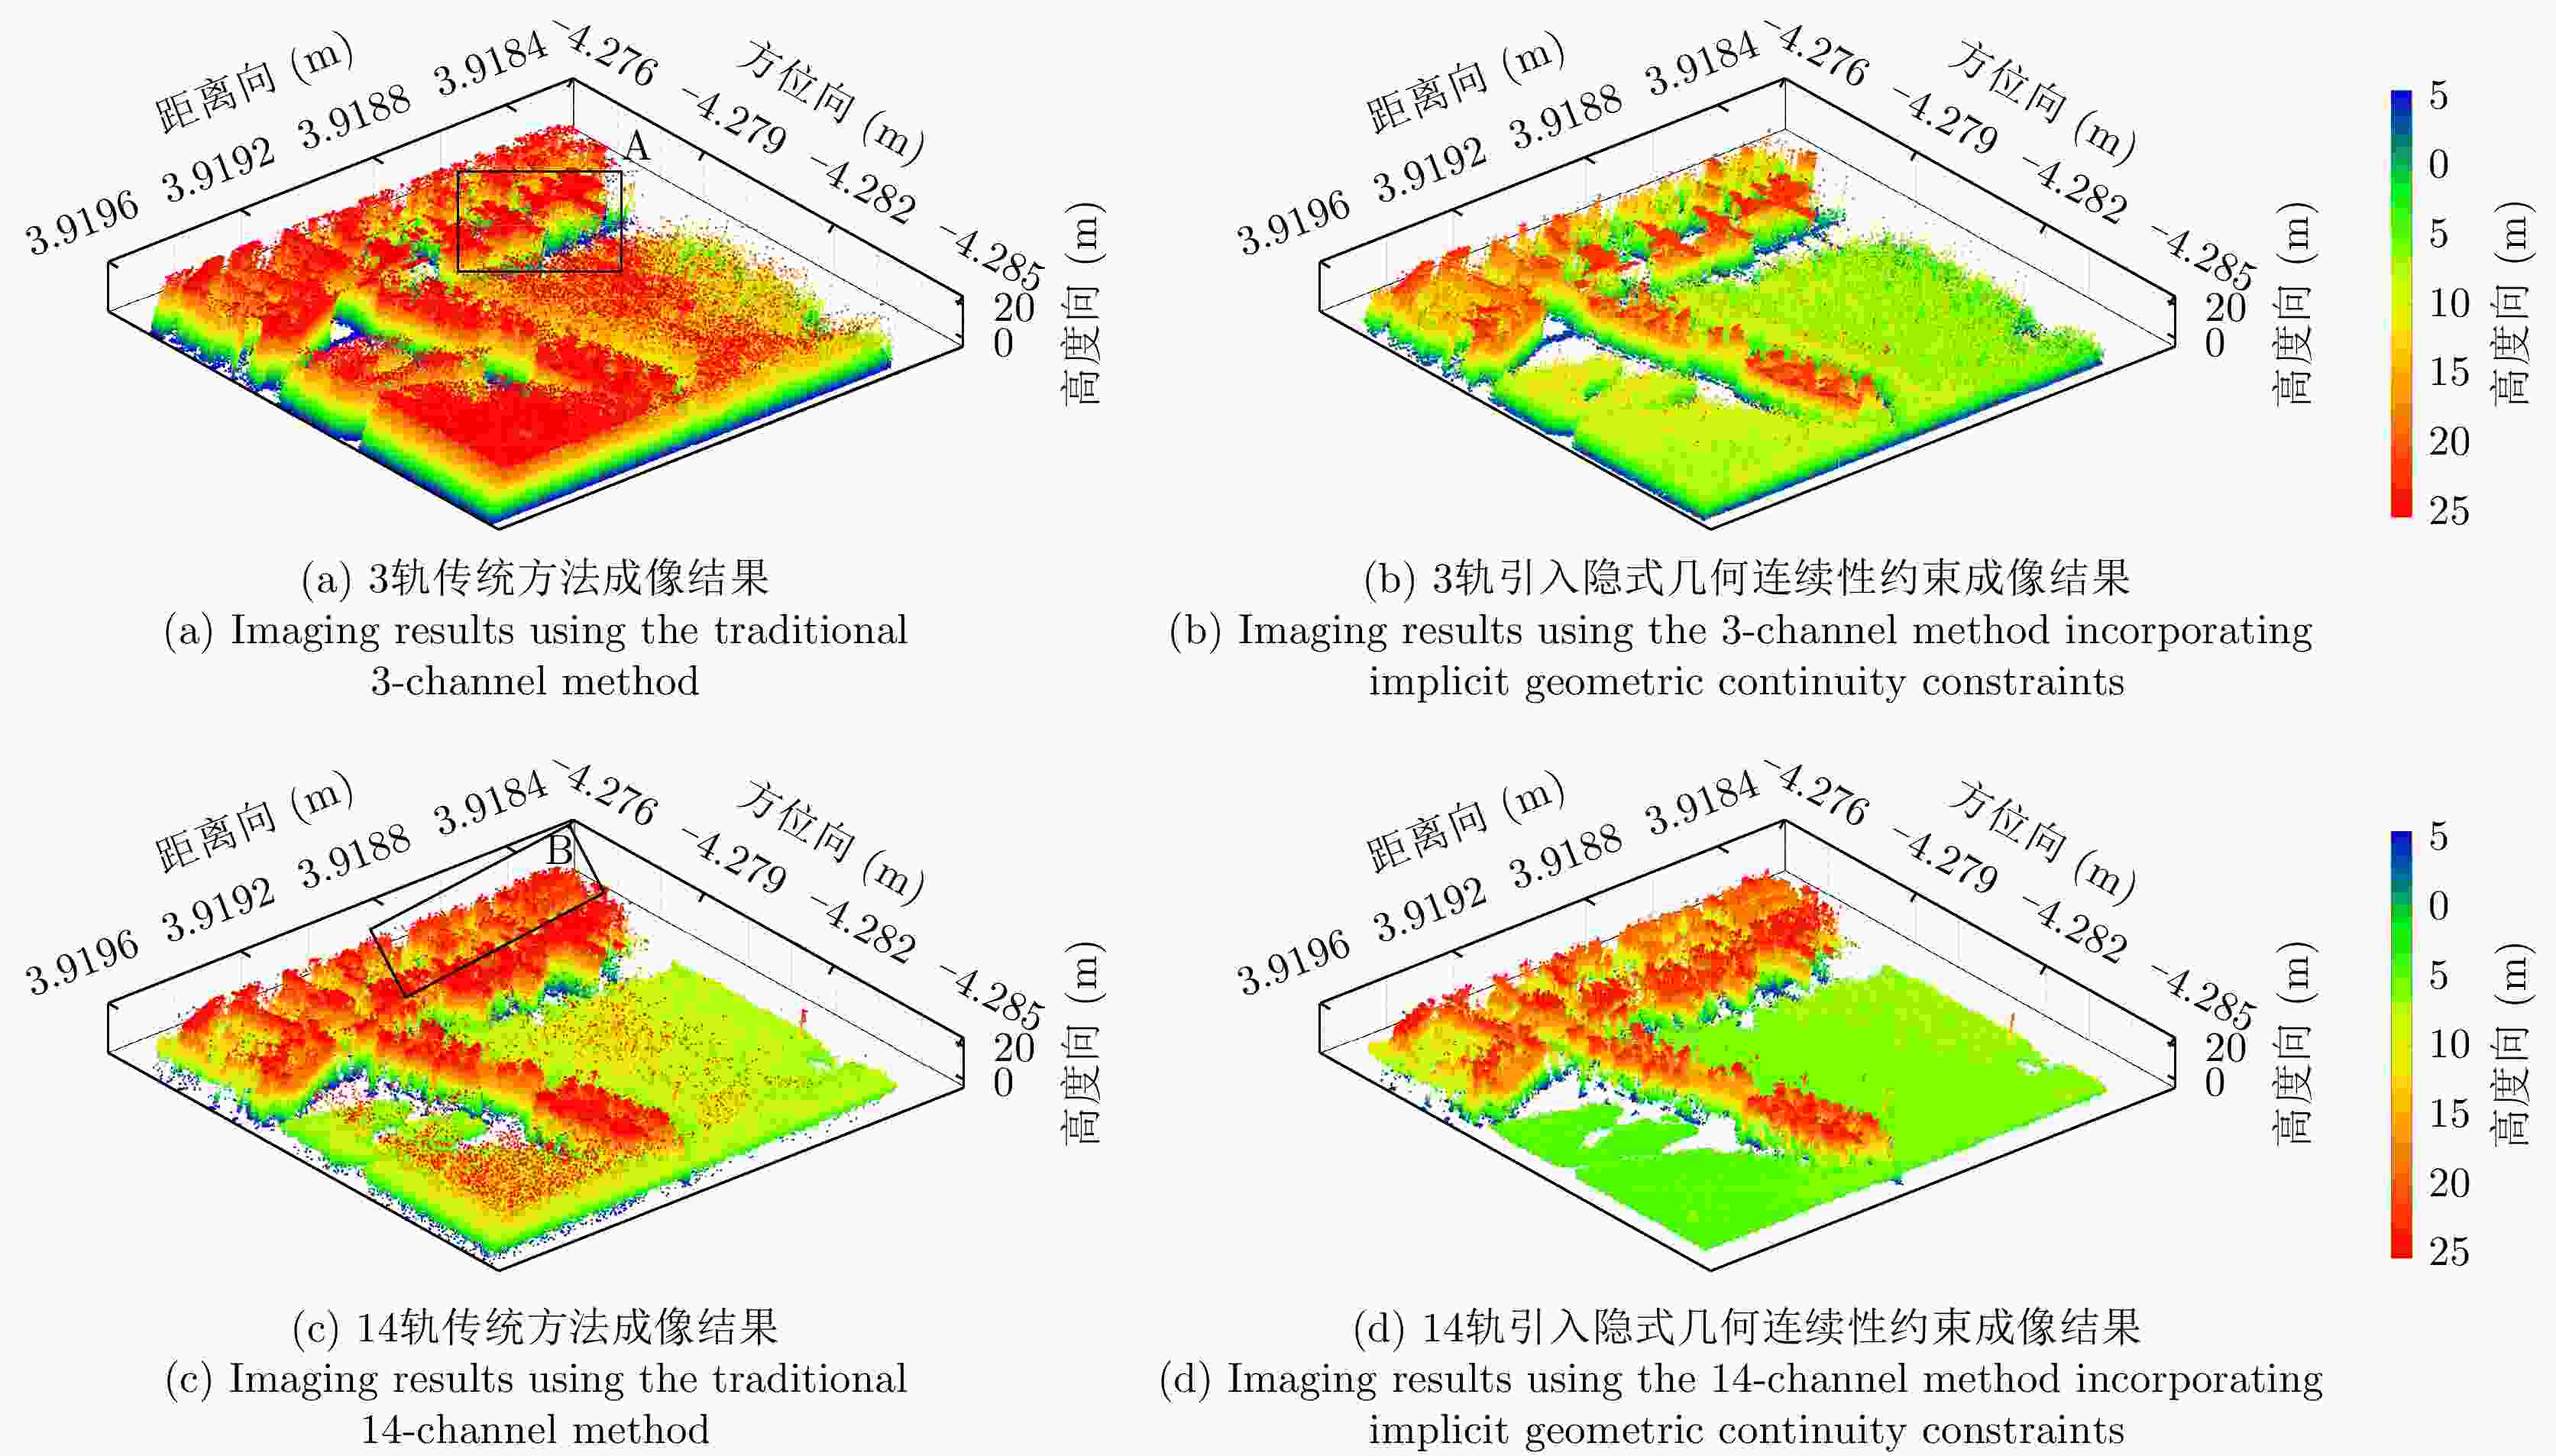
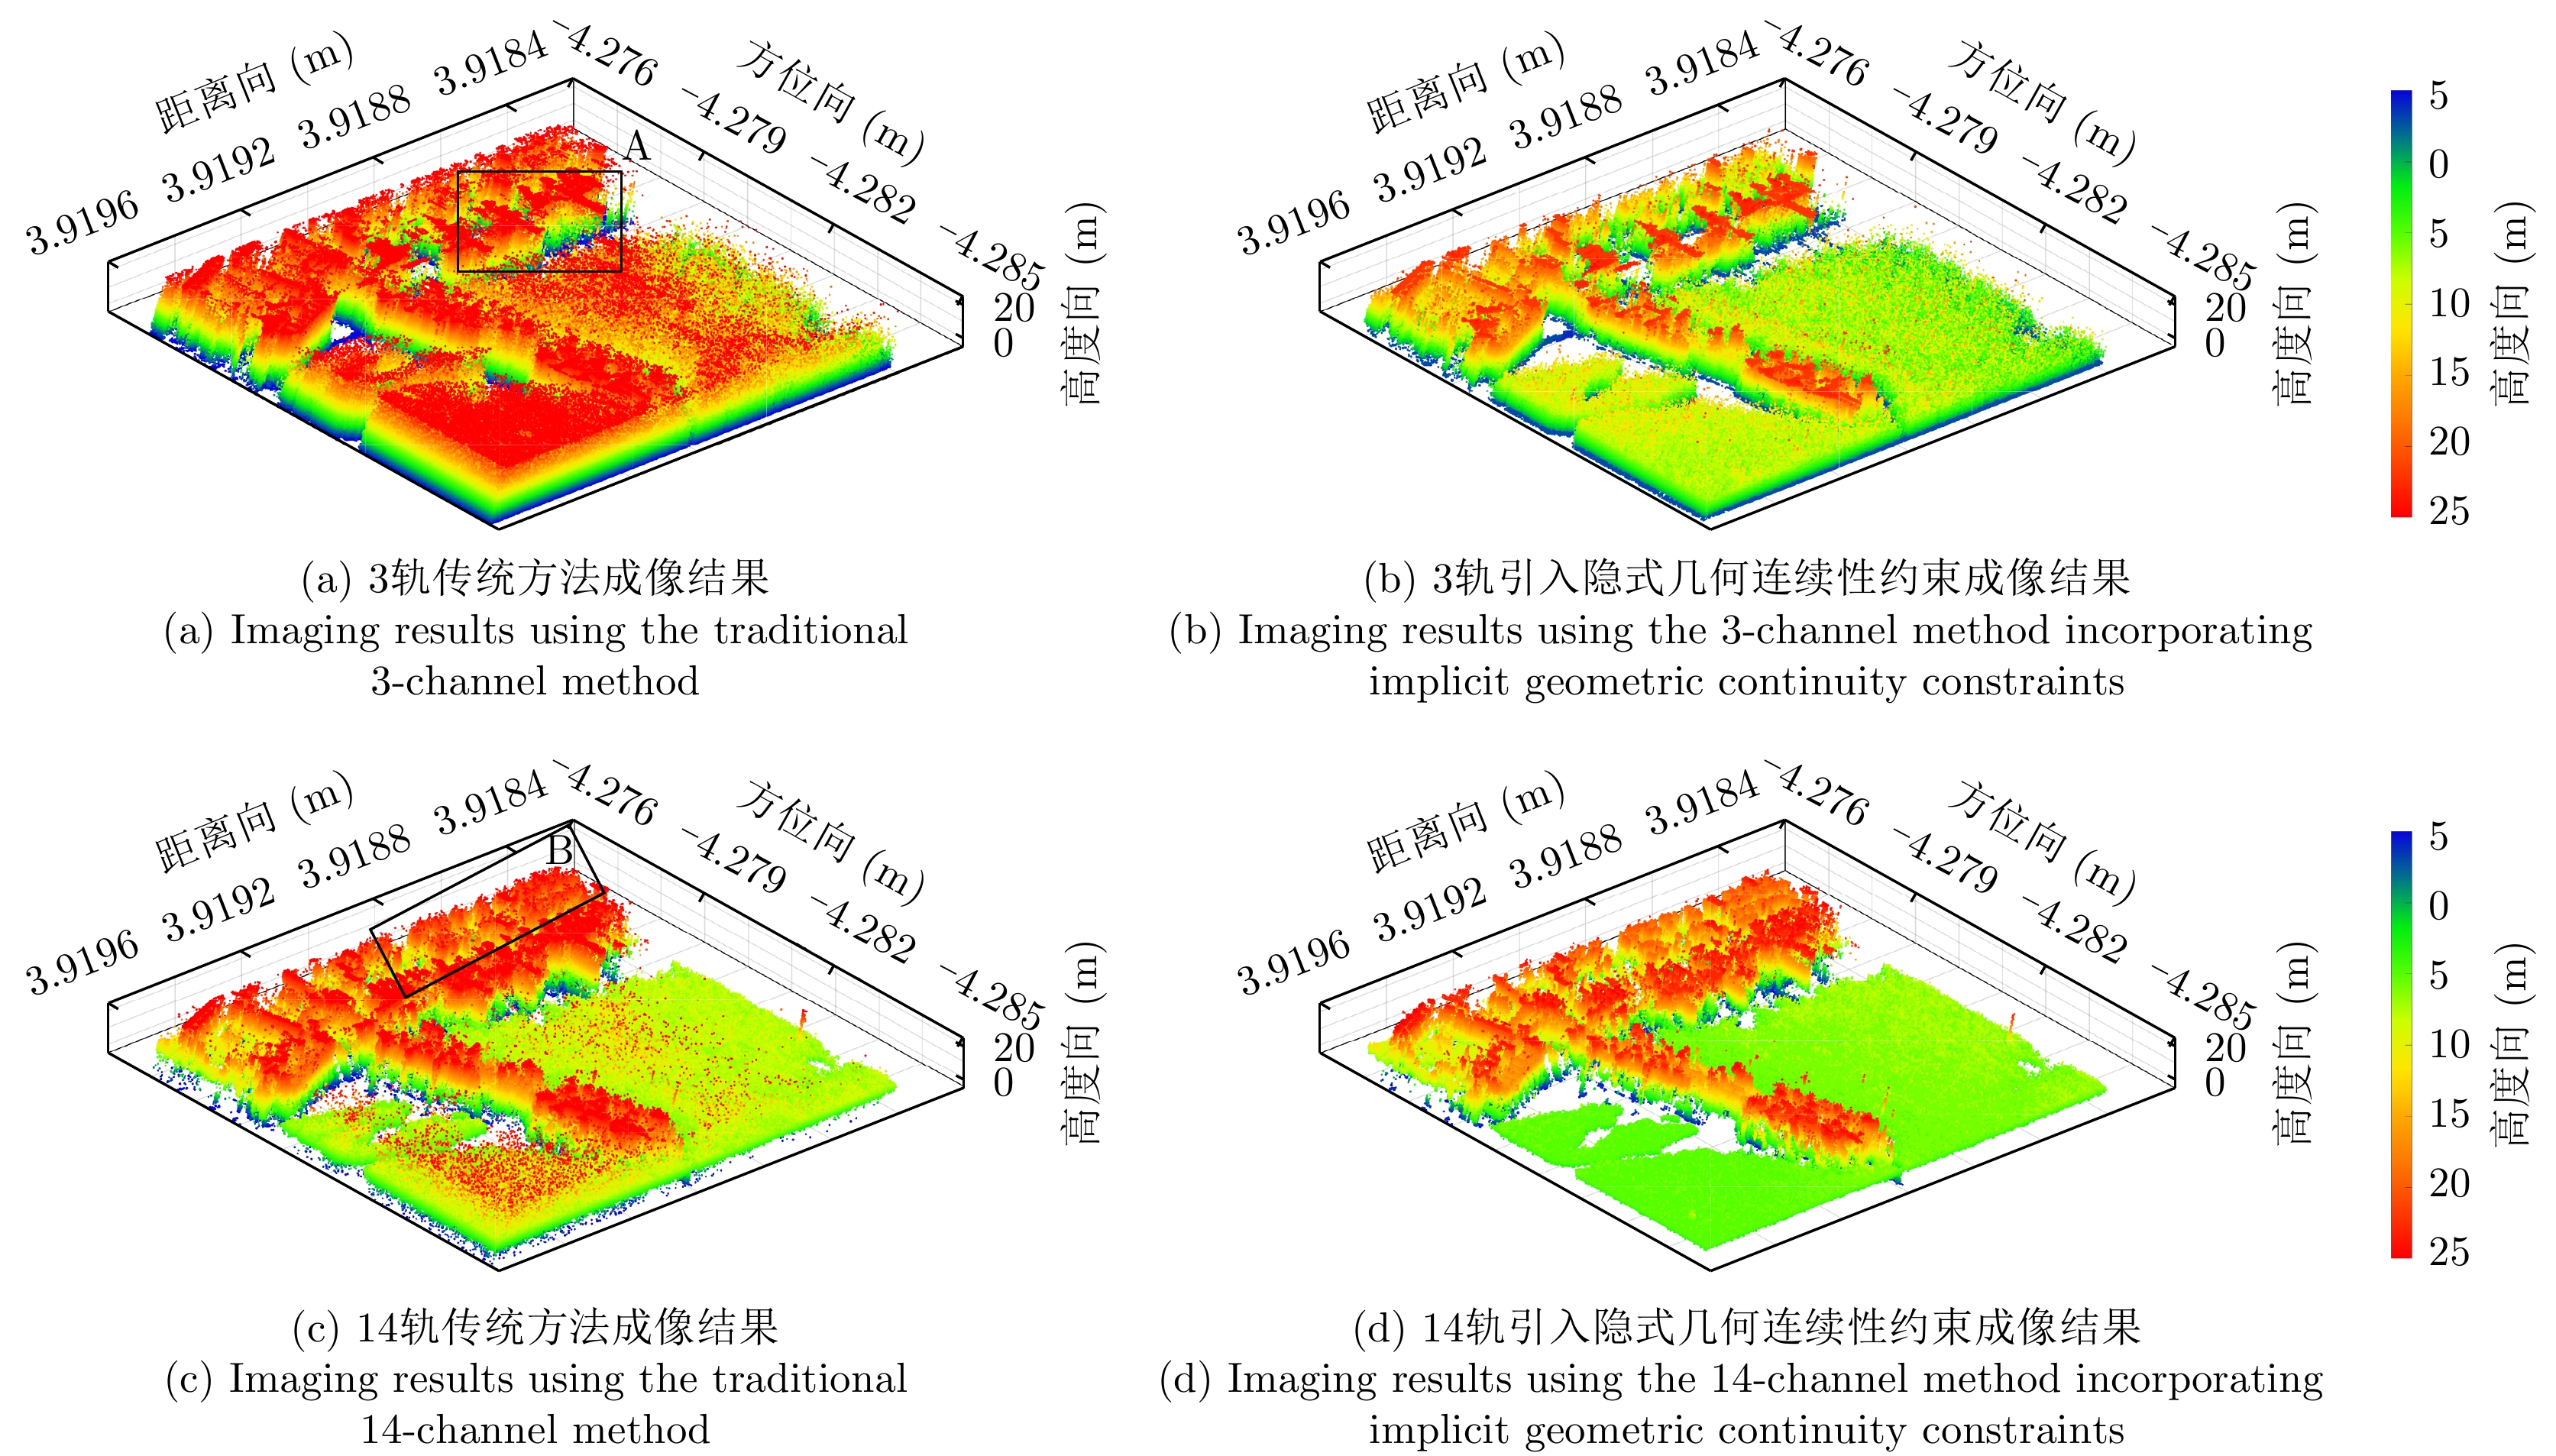
图 9 典型场景传统方法和引入隐式结合连续性约束成像结果对比图
Figure 9. Comparison of imaging results in typical scenes between the traditional method and the methodincorporating implicit geometric continuity constraints

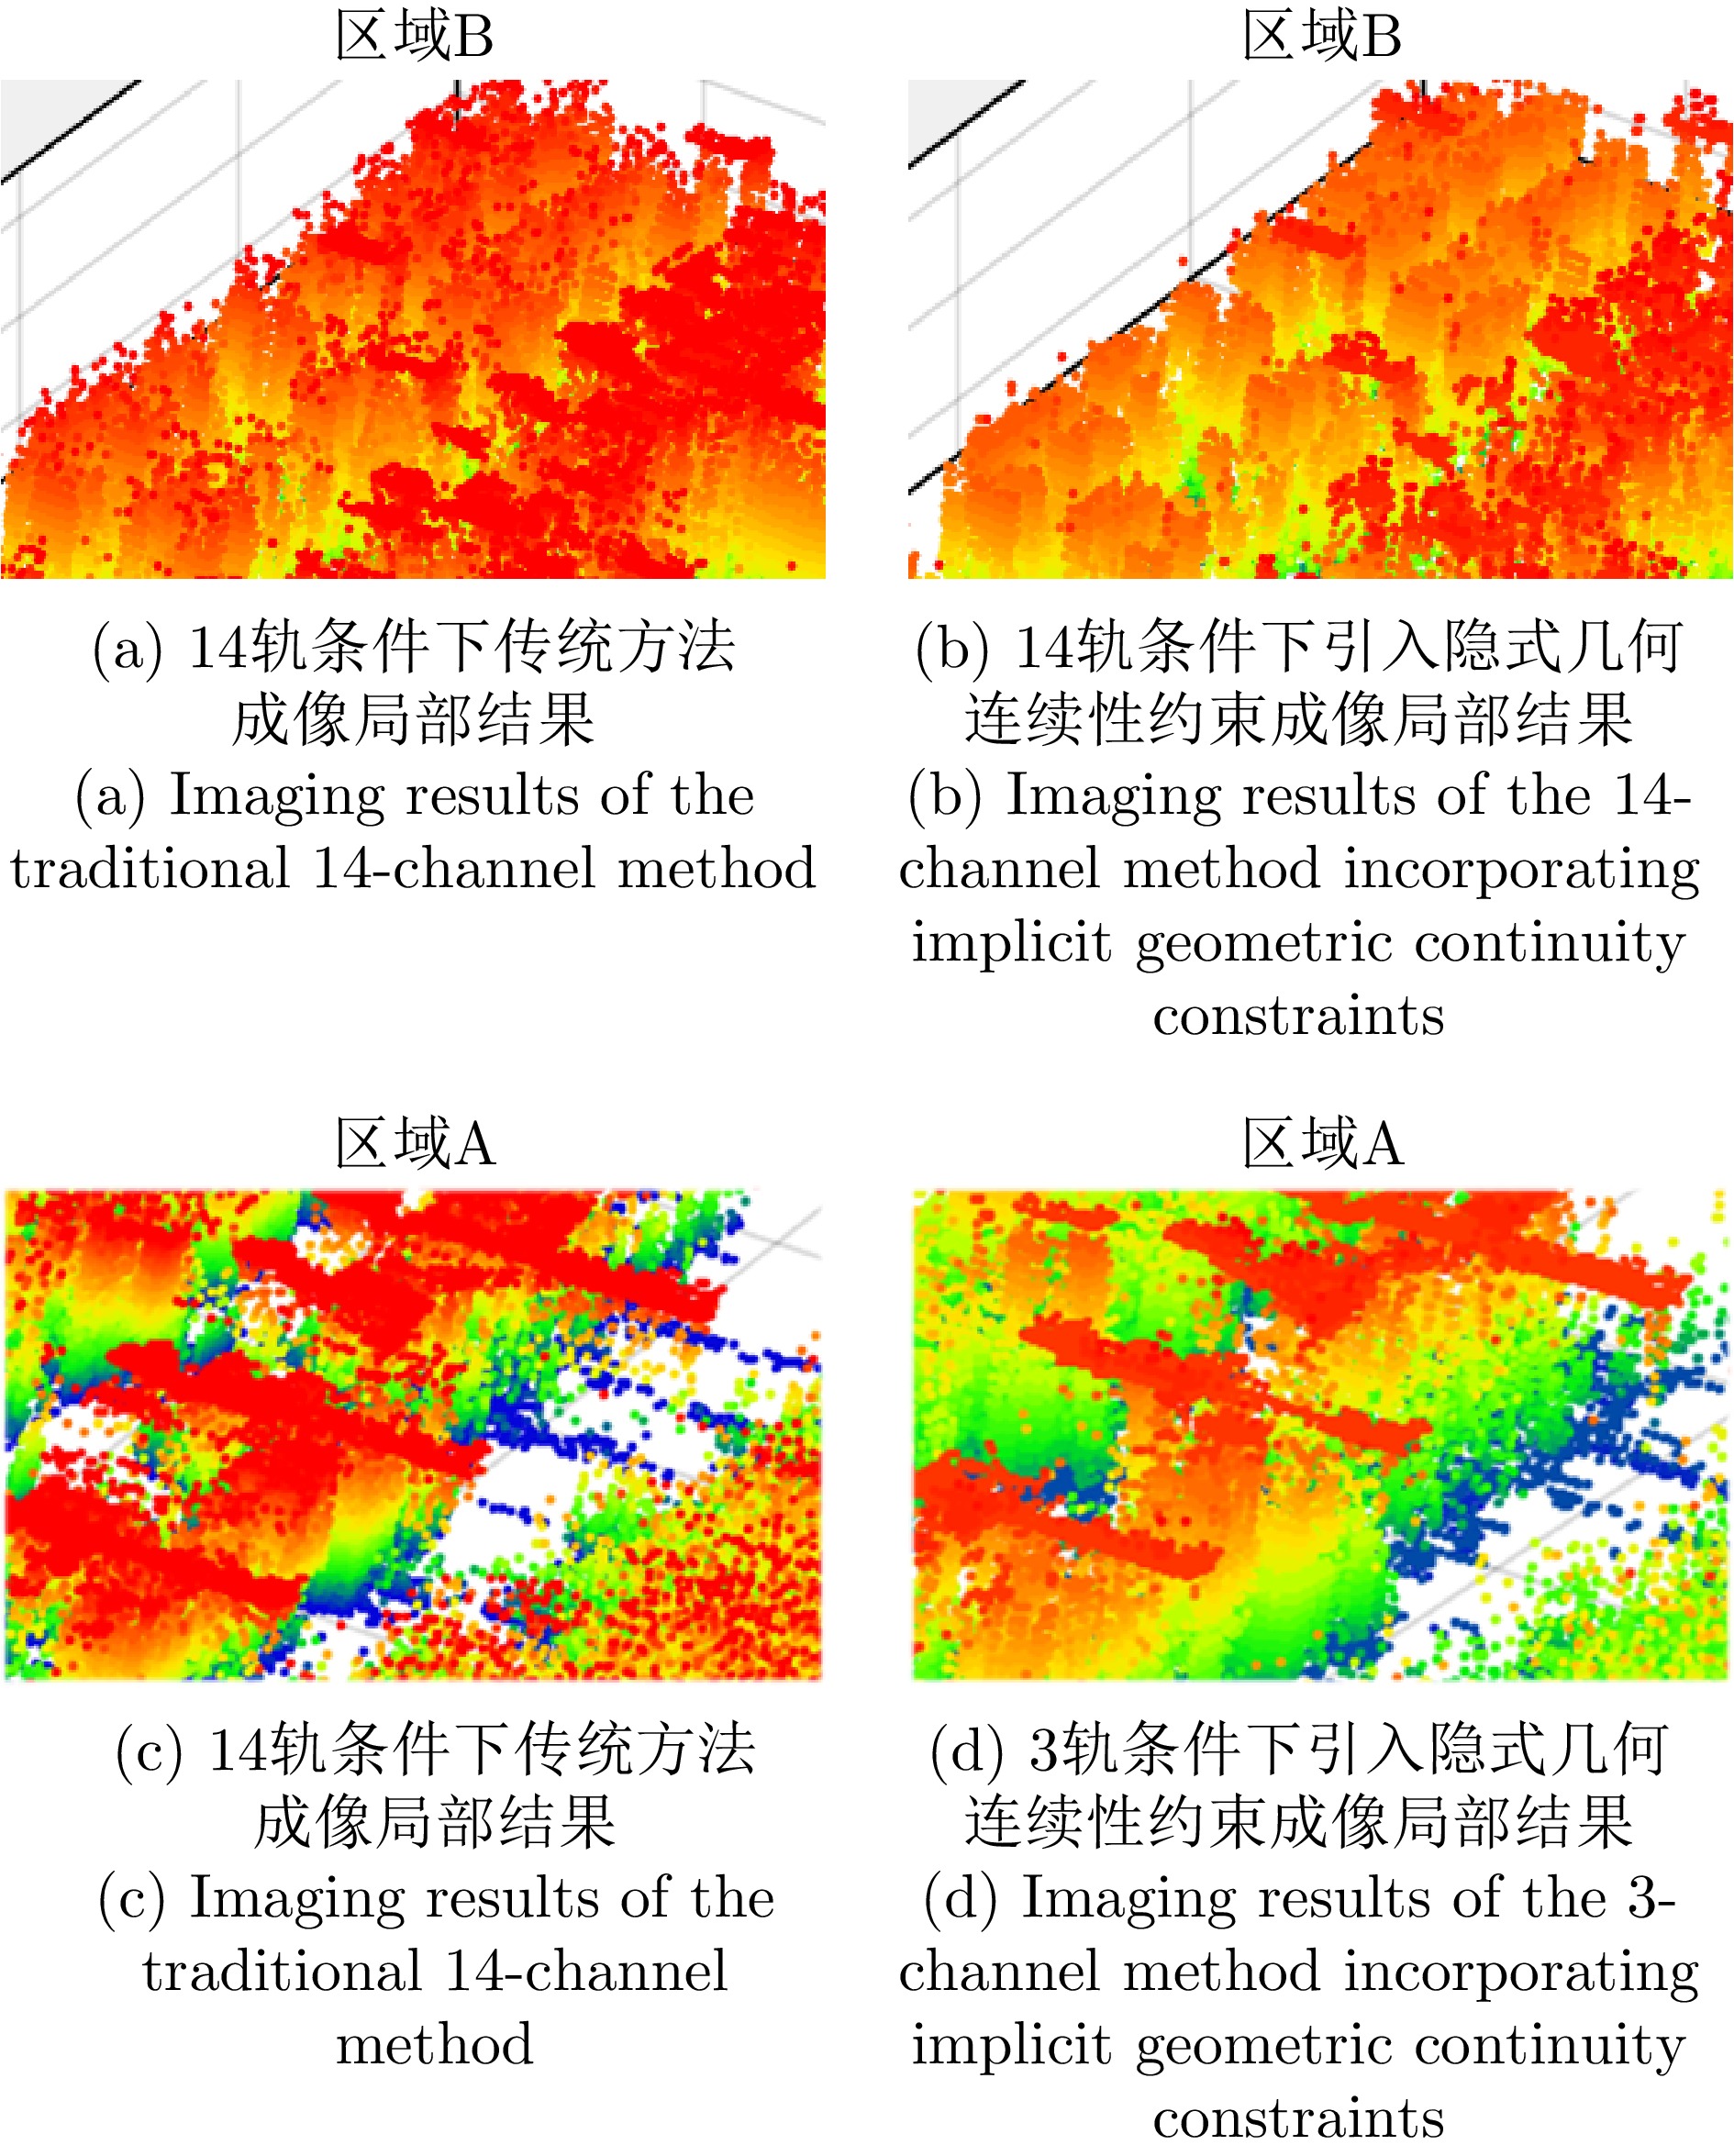
图 10 典型场景结果局部传统方法和引入隐式结合连续性约束成像结果对比图
Figure 10. Comparison of local imaging results in typical scenes between the raditional method and the method incorporating implicit geometric continuity constraints
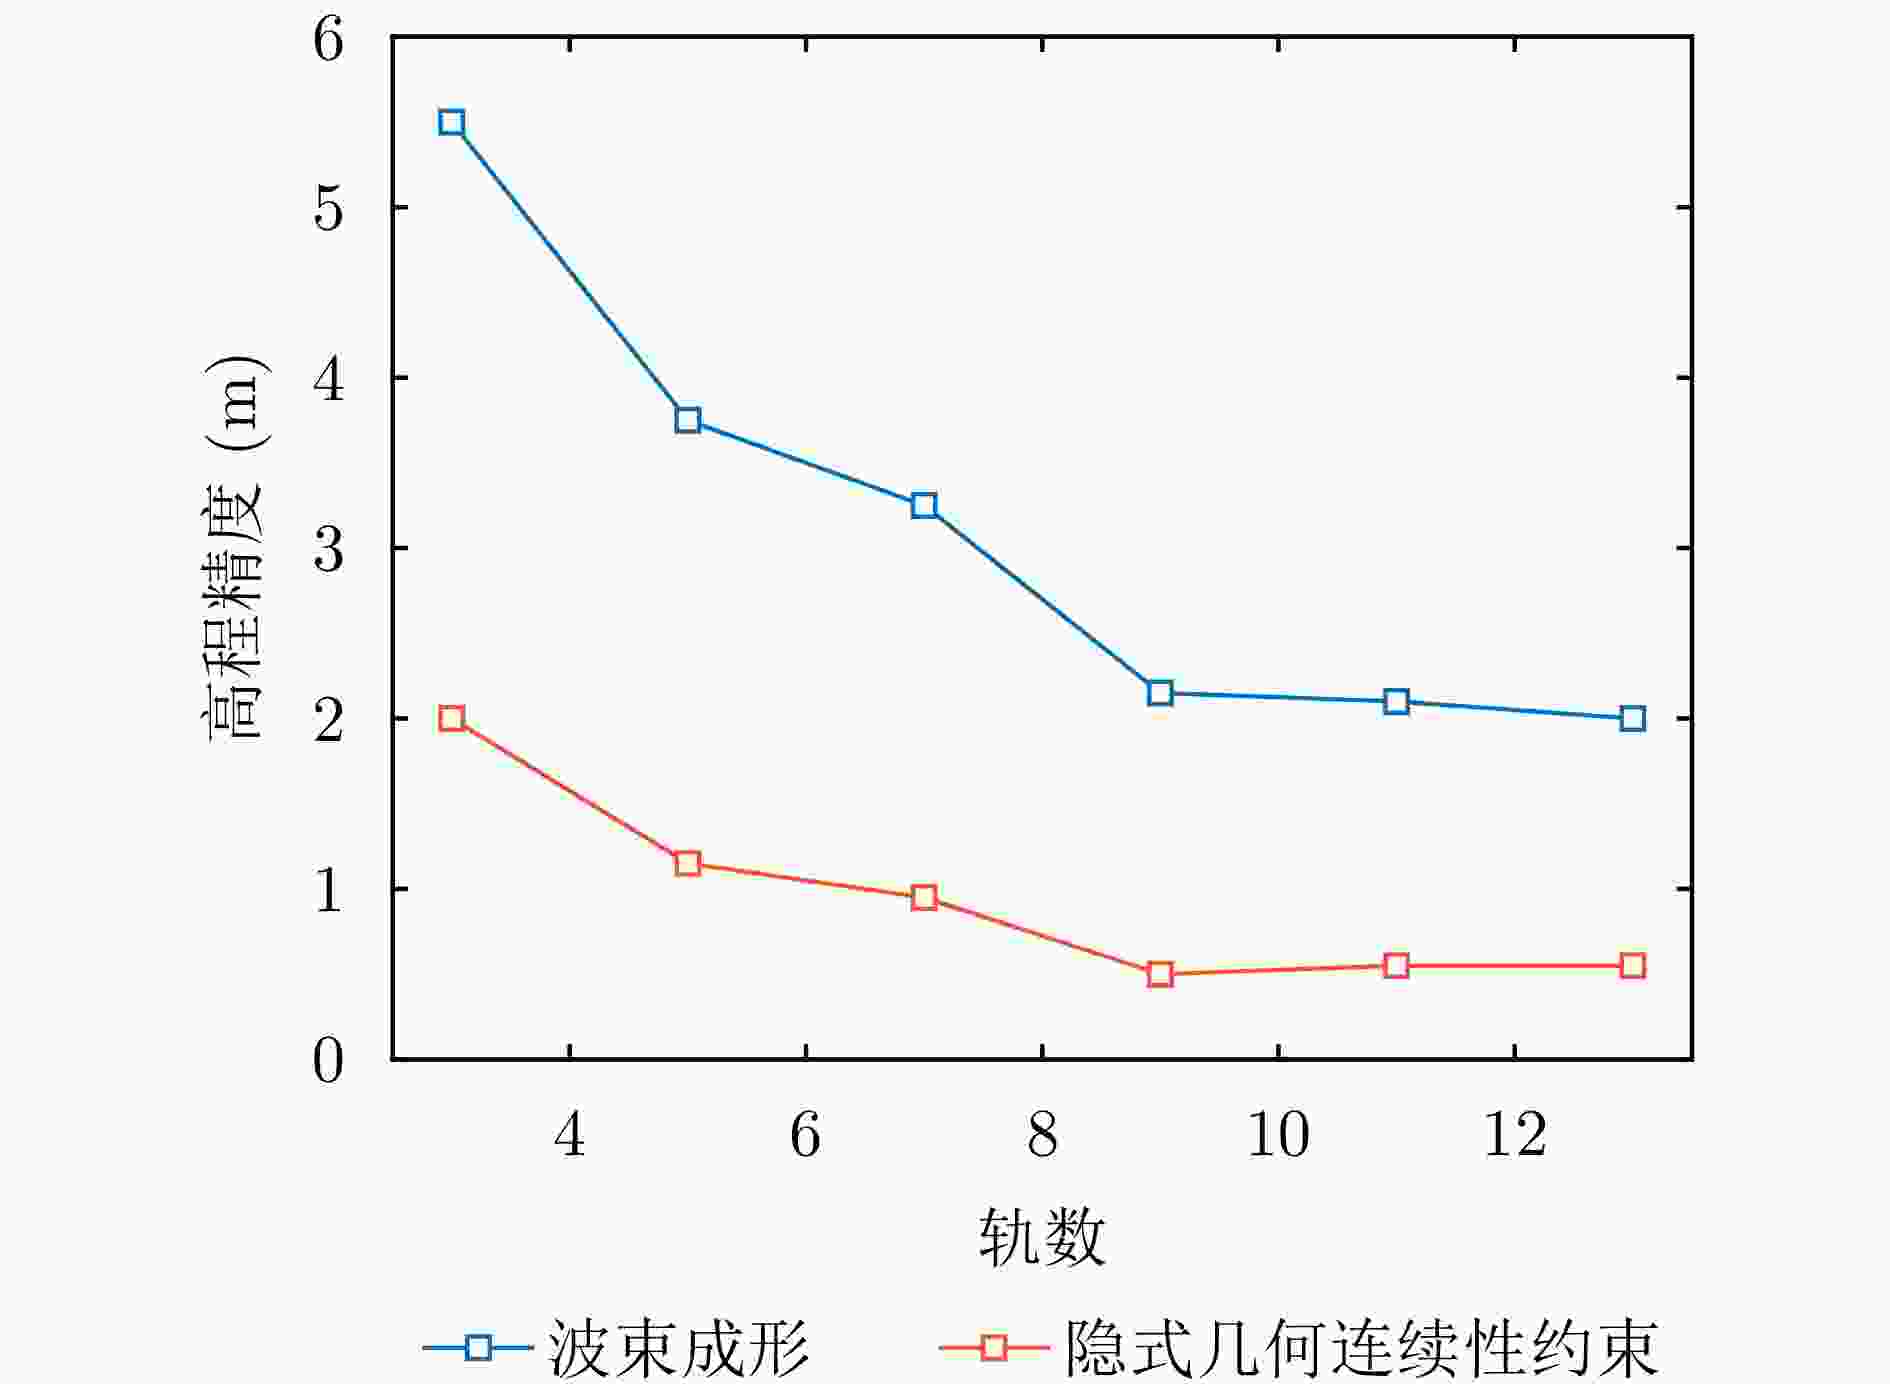
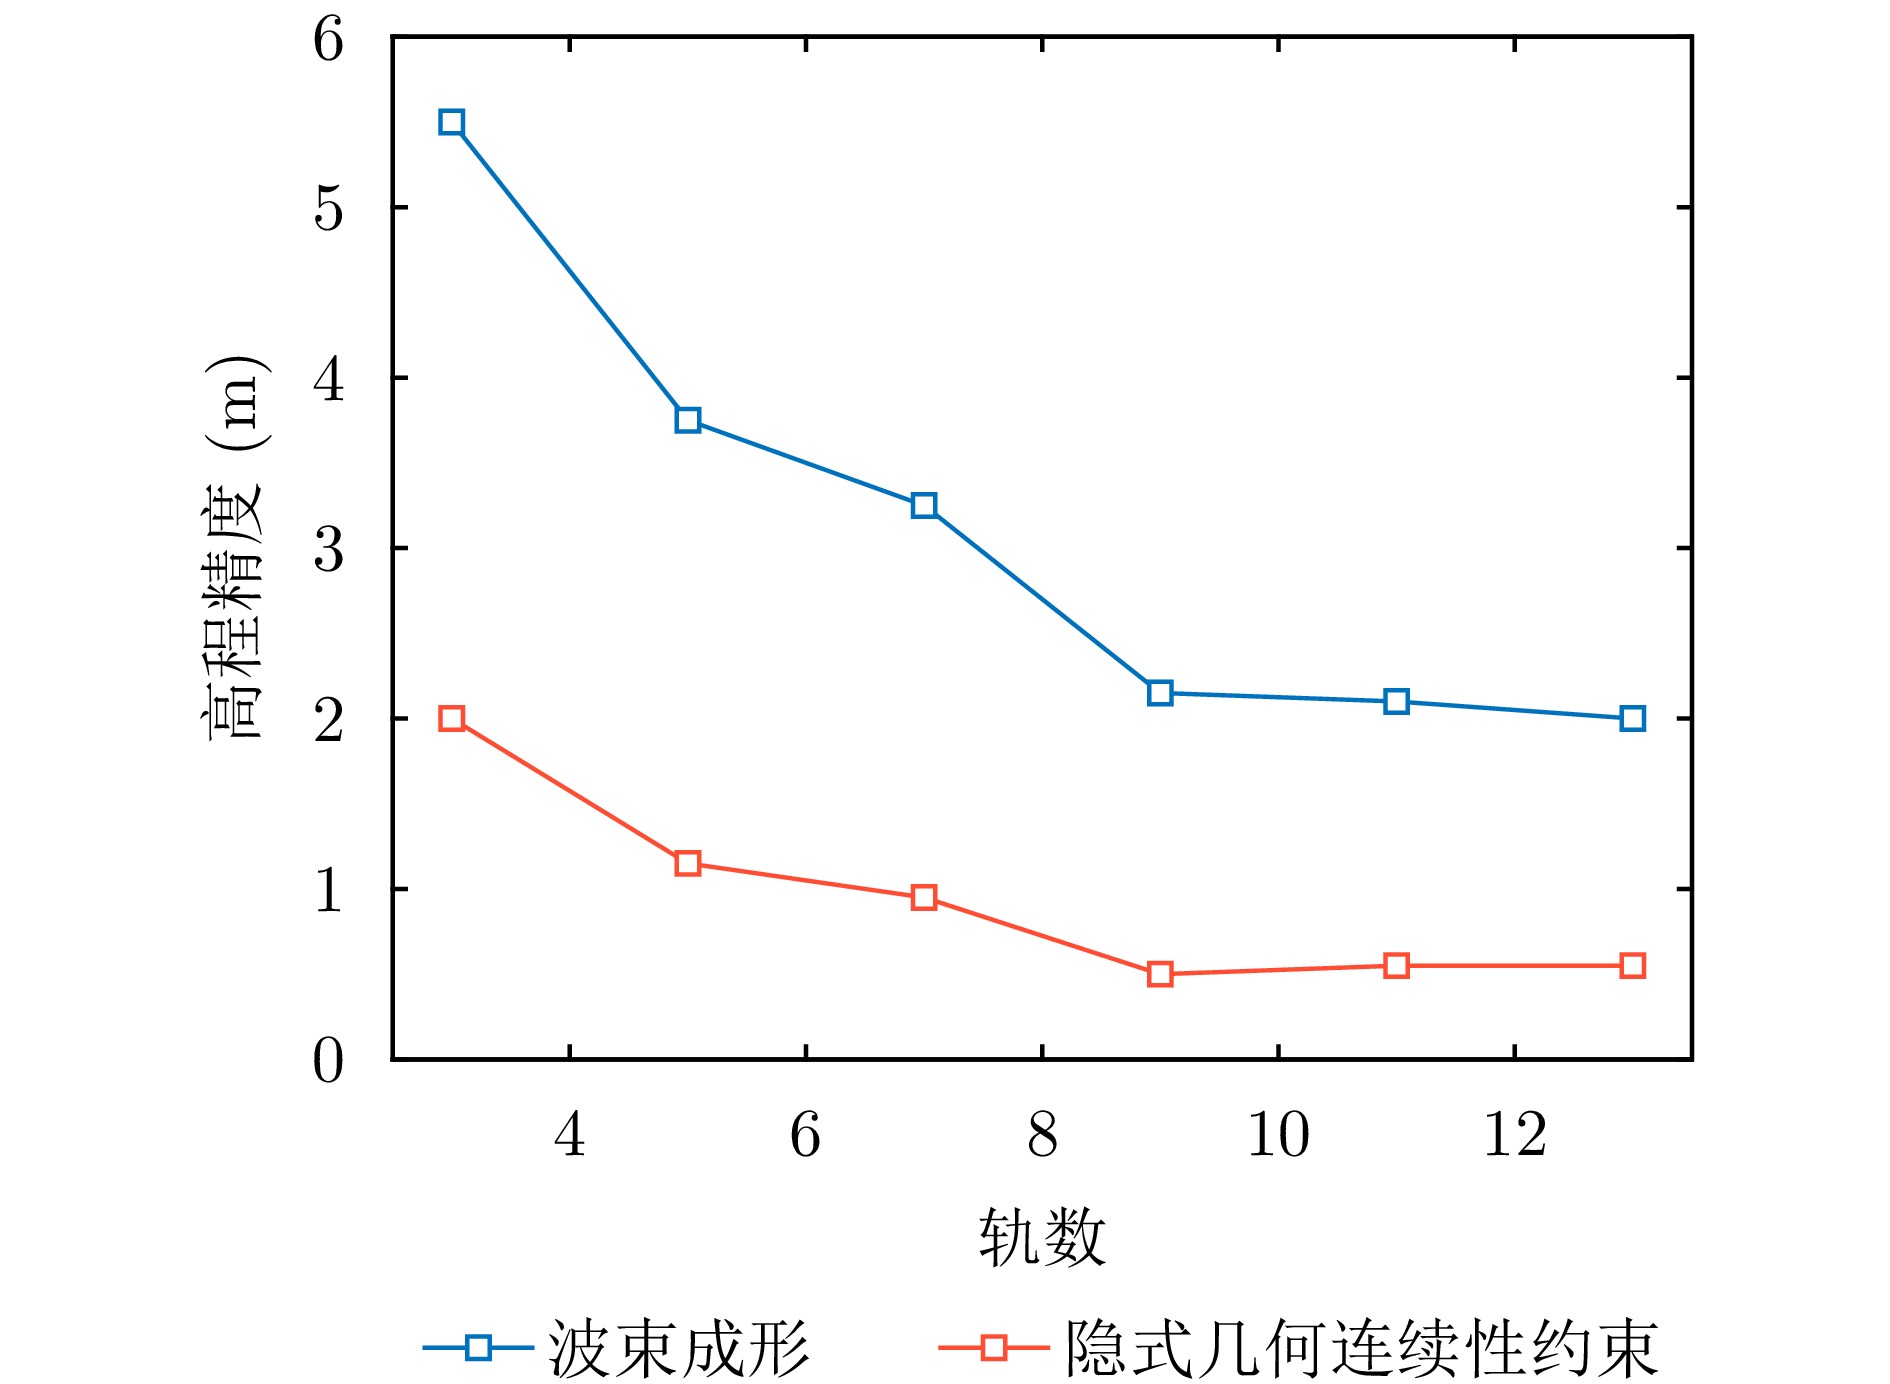
图 11 加入隐式几何连续性约束后成像与波束成形成像高程精度对比图
Figure 11. Comparison of elevation accuracy between imaging and beamforming after adding implicit geometric continuity constraints

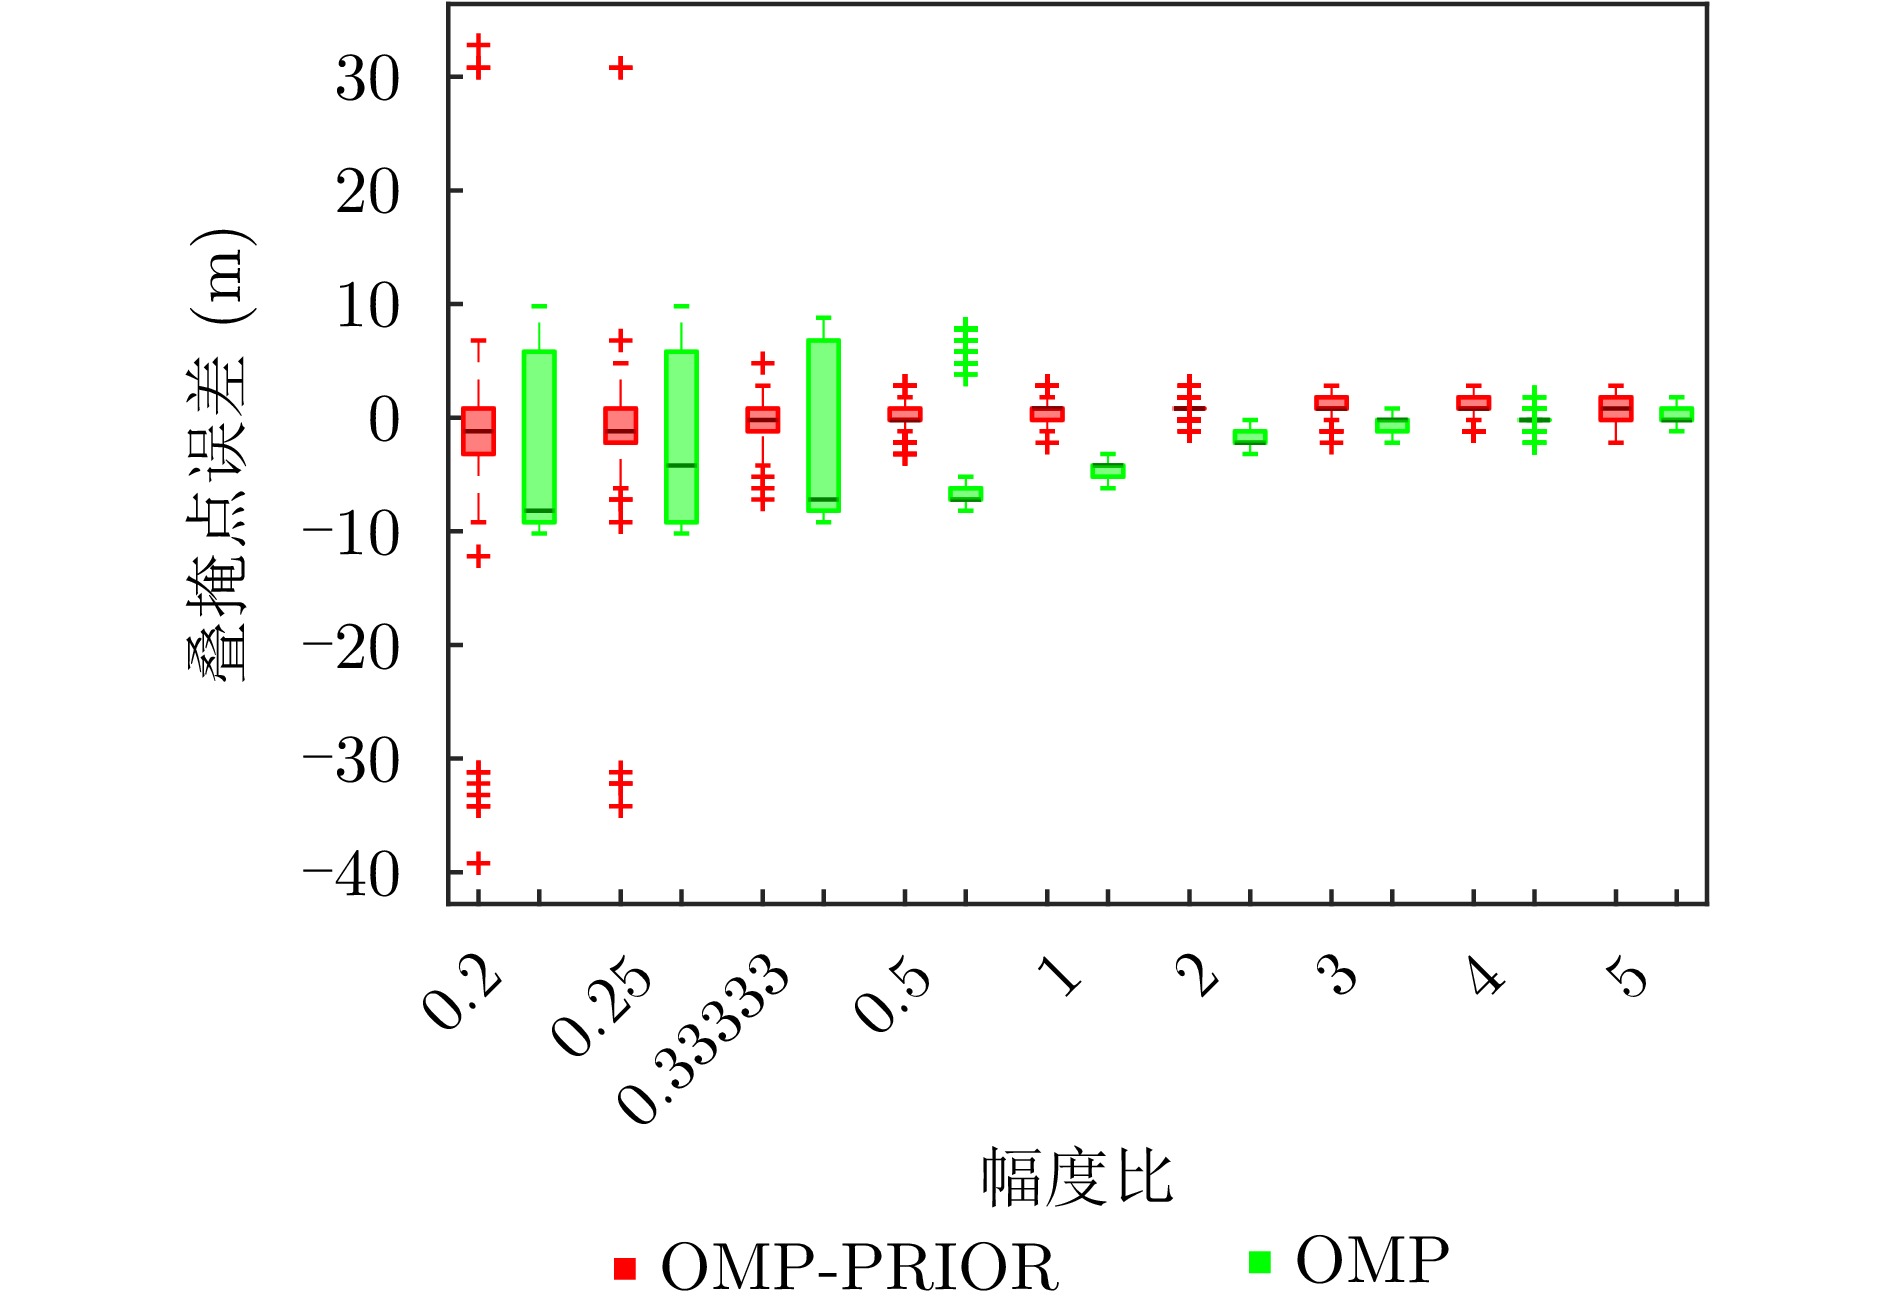
图 13 两个散射体不同幅度比下解出的叠掩点高程与真值的偏差箱线图
Figure 13. The box plot of the deviation between the overlay point and the true value under different amplitude ratios of two scatters
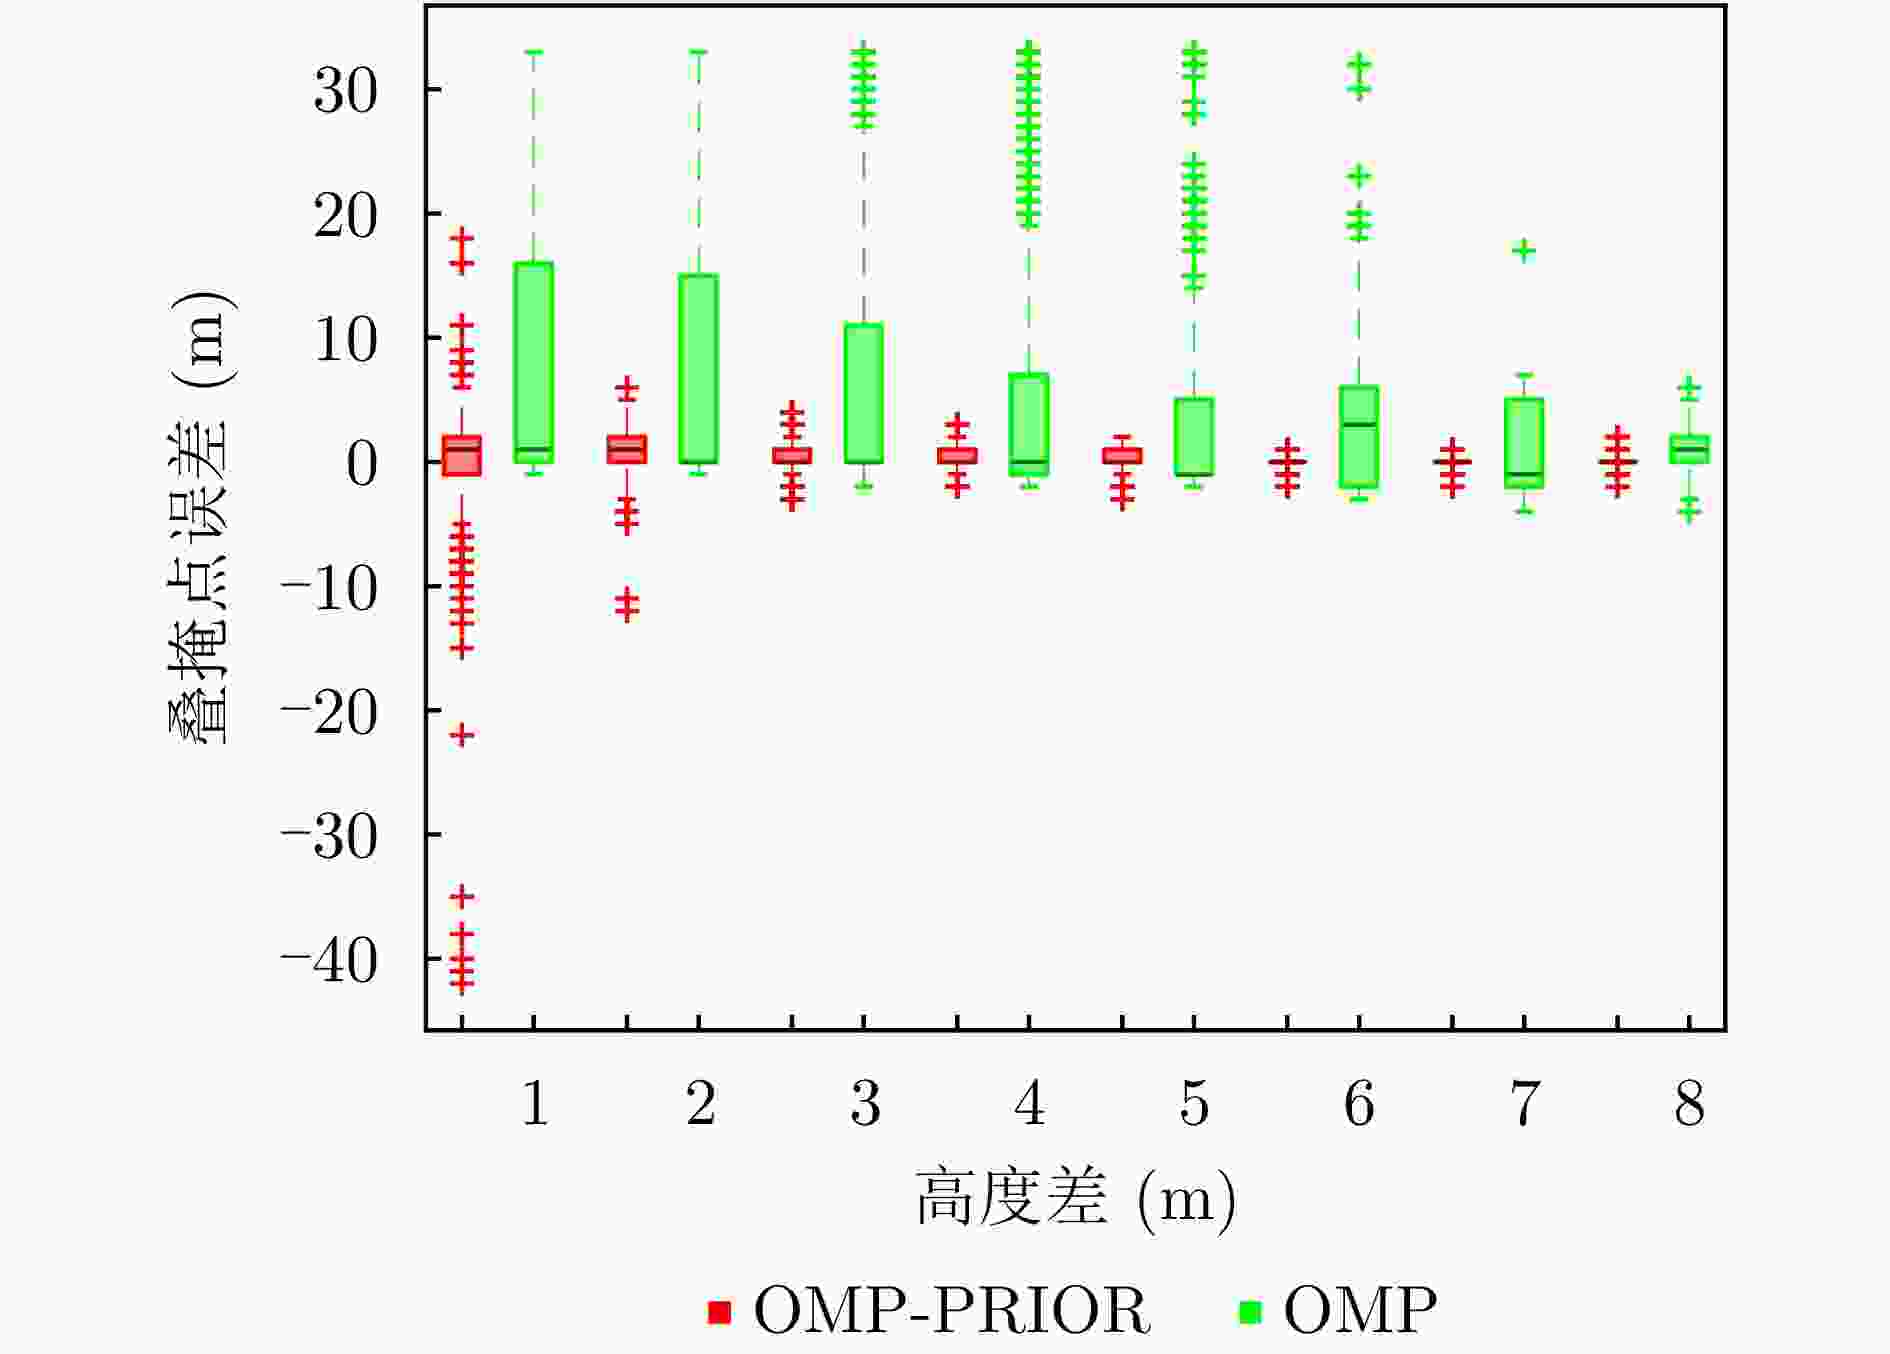
图 14 两个叠掩的散射体在不同高度差下解出的叠掩点高程与真值的偏差箱线图
Figure 14. Box diagram of the deviation between the overlying mask and the true value solved at different spacing distances between two scatters
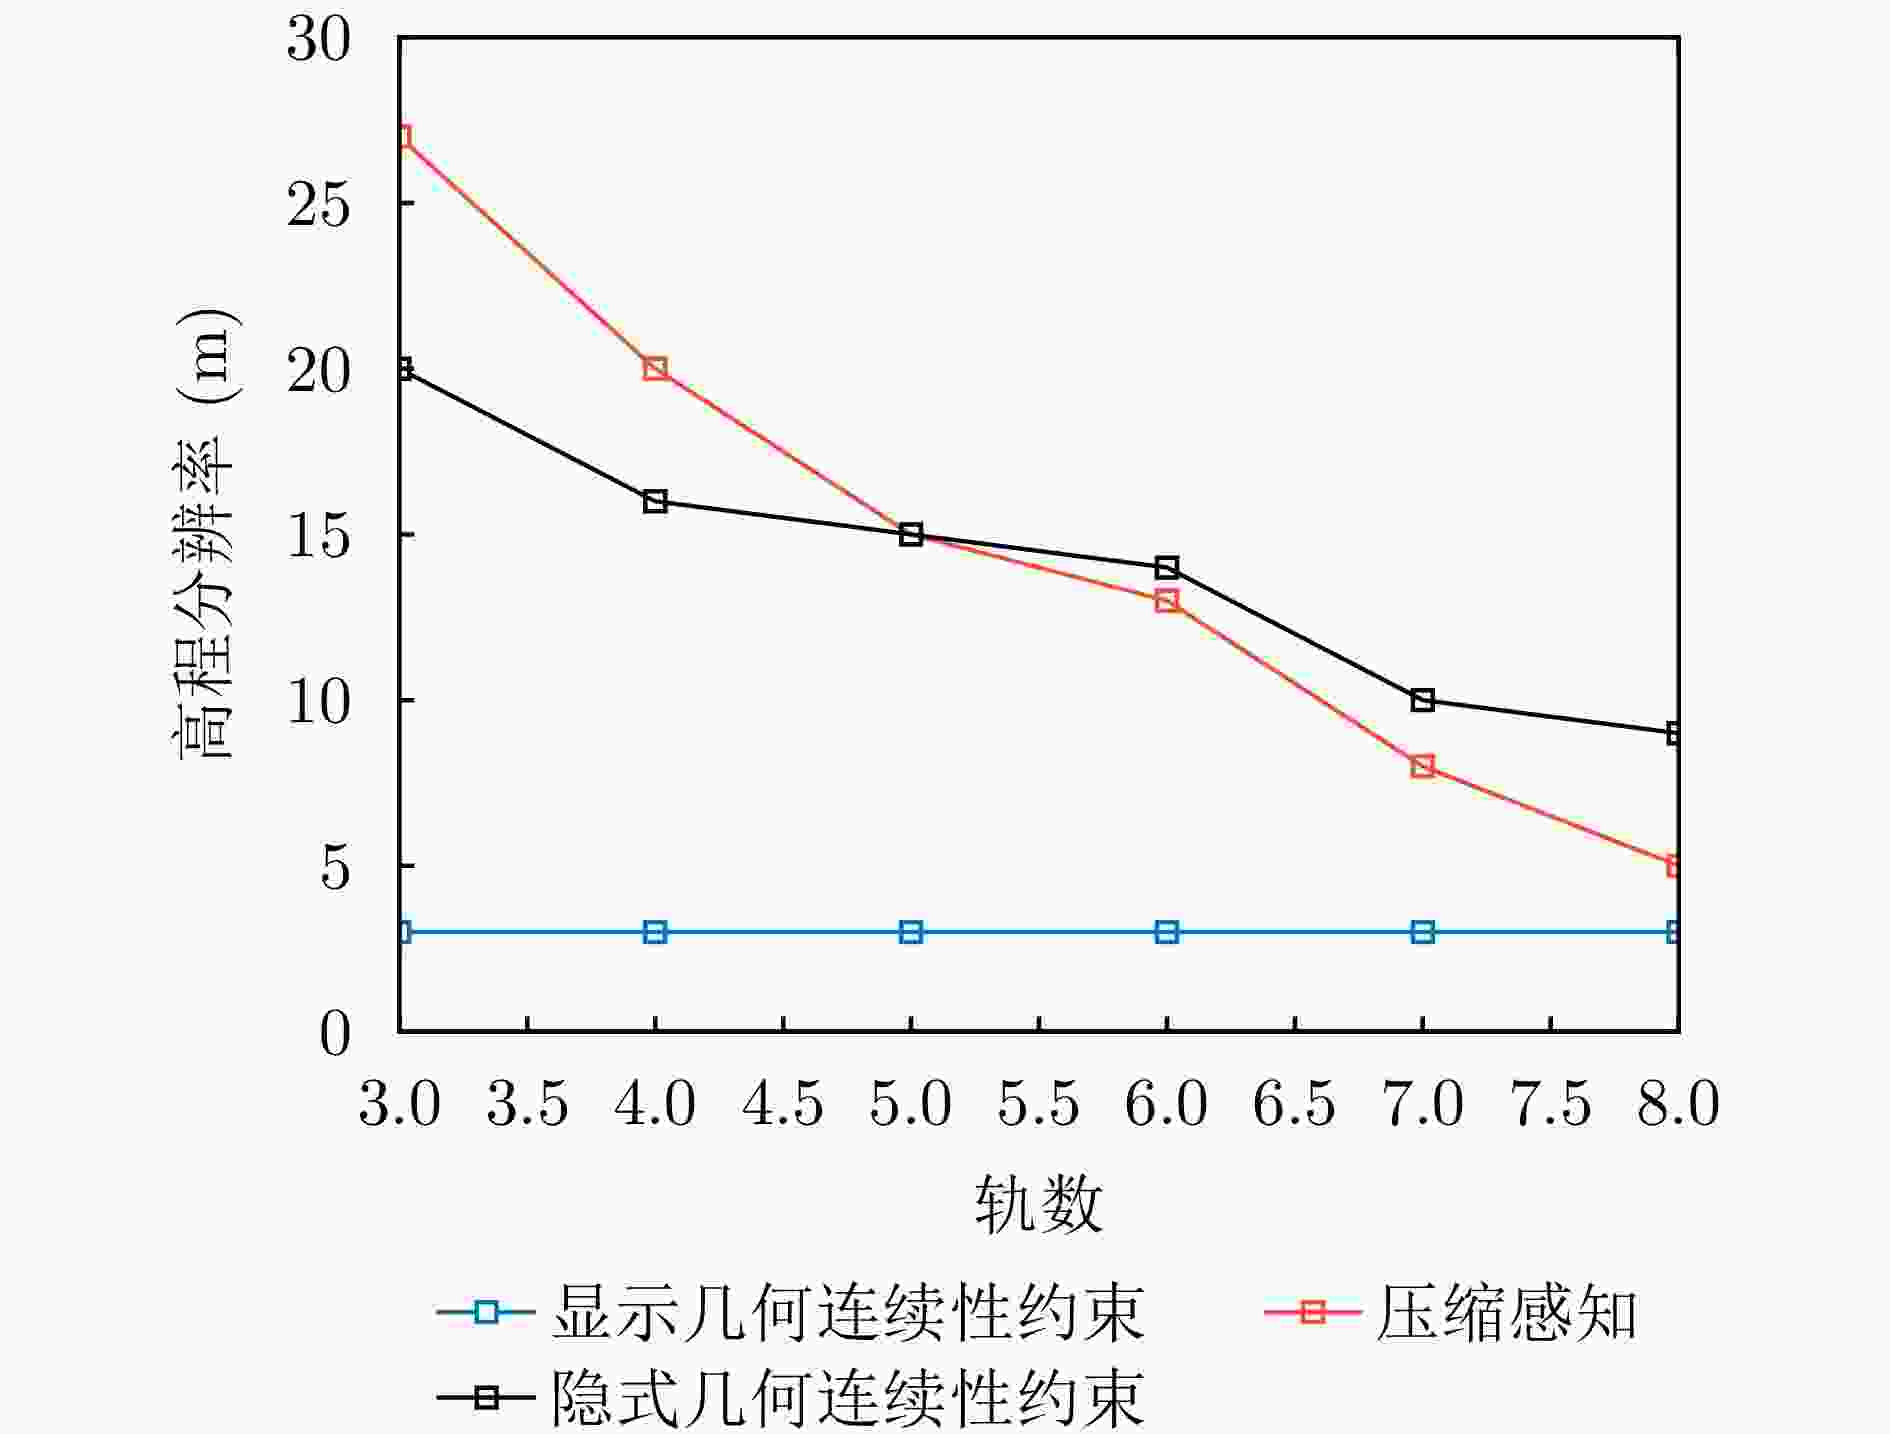
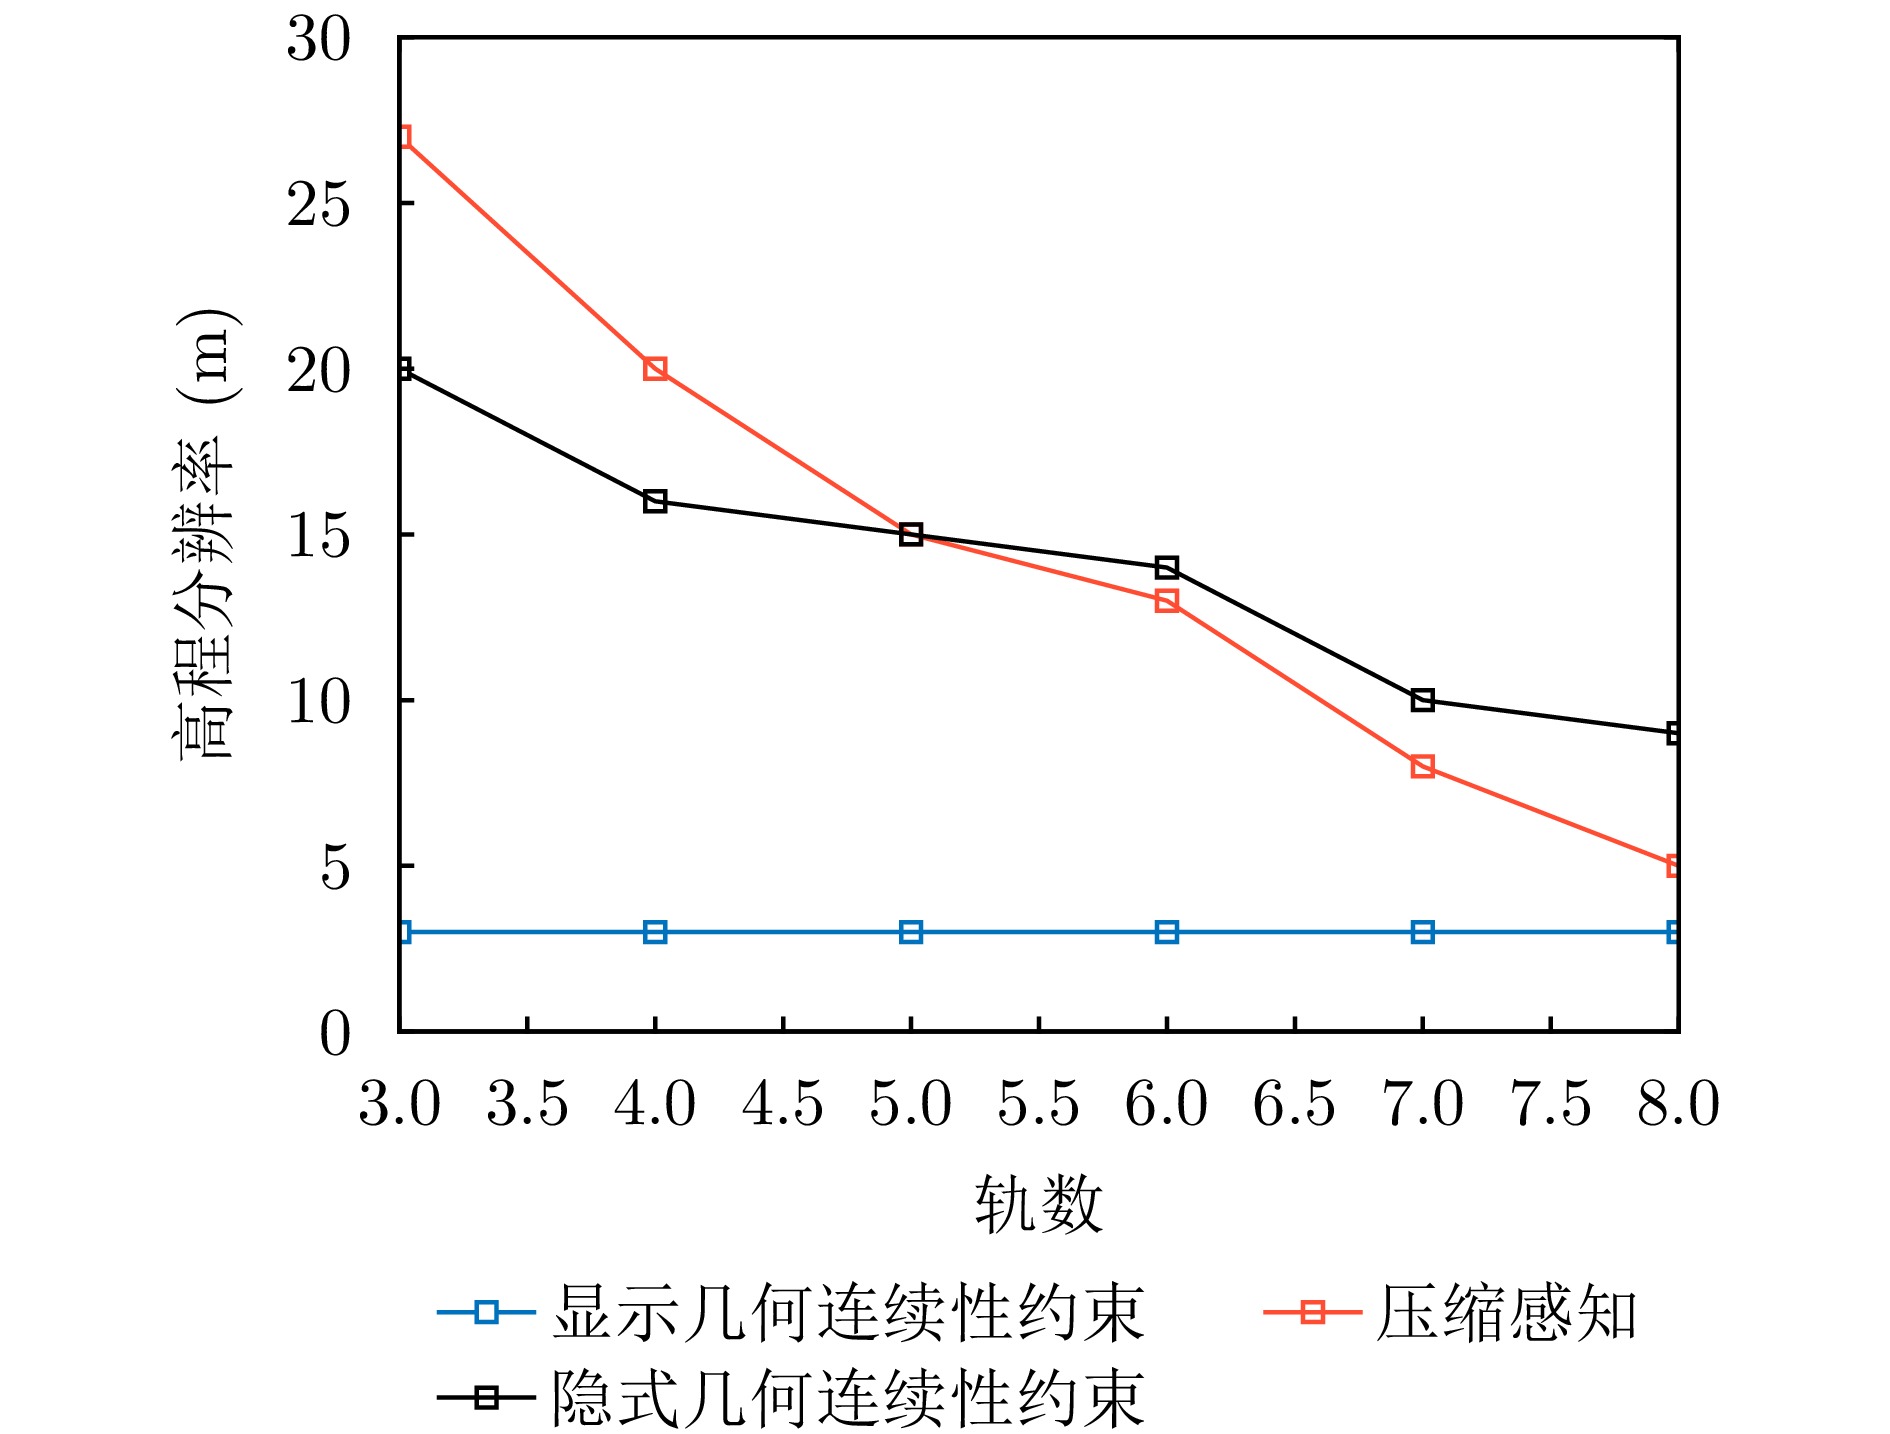
图 15 不同成像方法在不同轨数高程分辨率对比图
Figure 15. Comparison of elevation resolution of different imaging methods in different orbital numbers
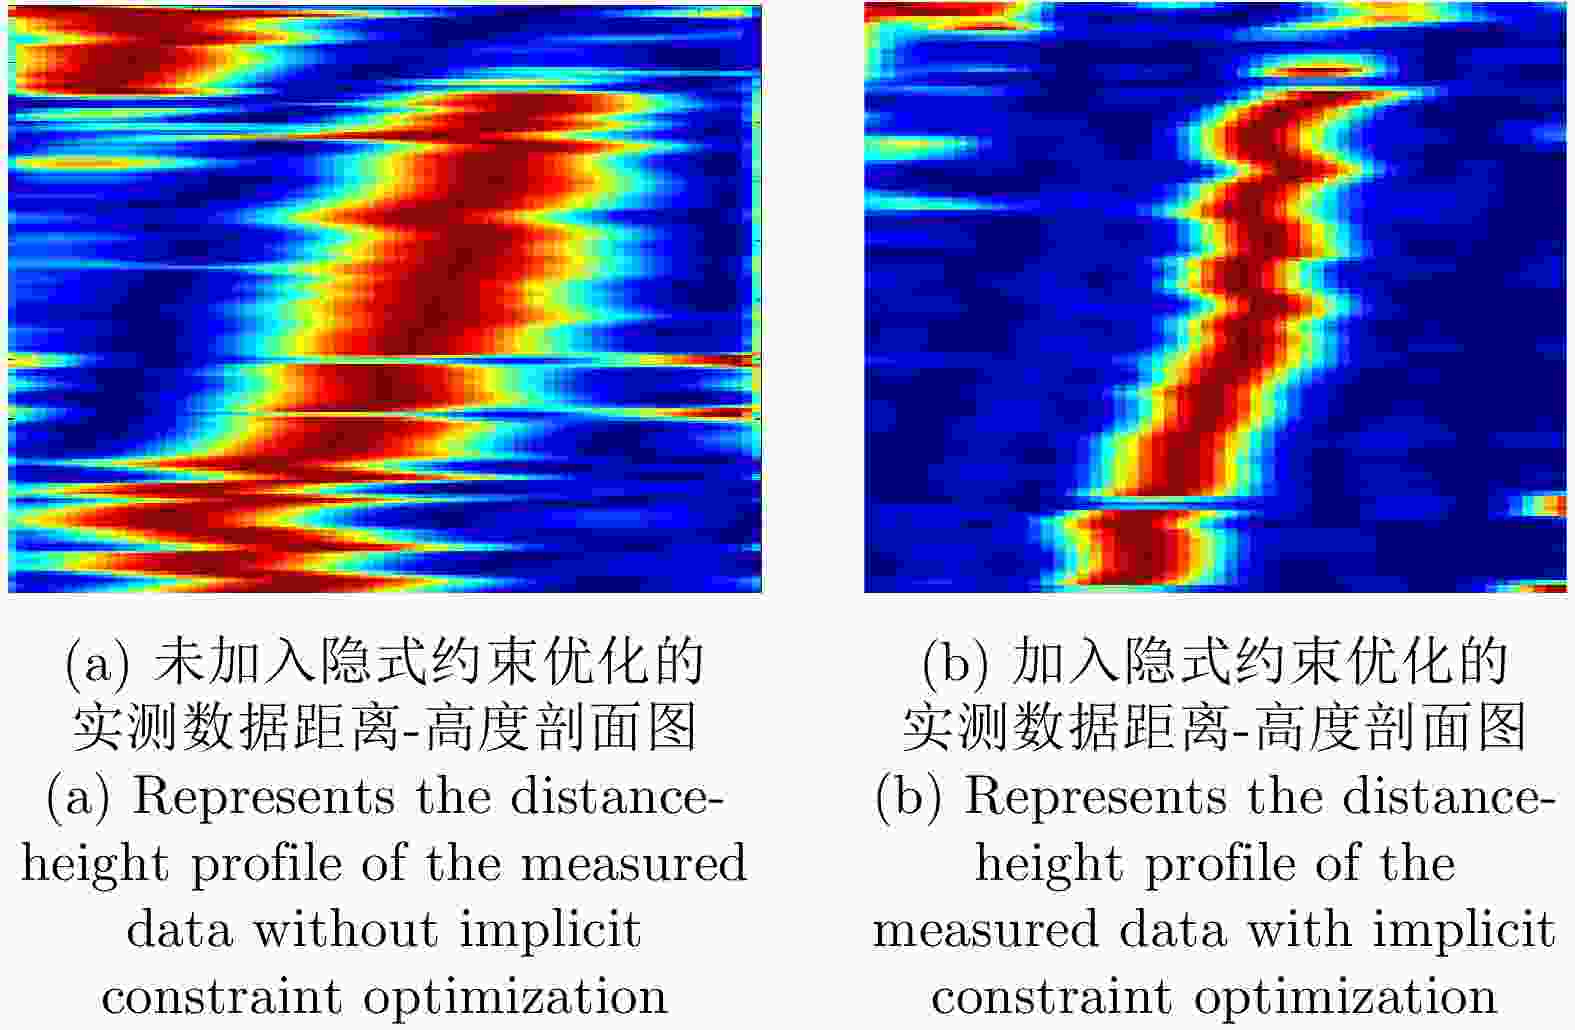
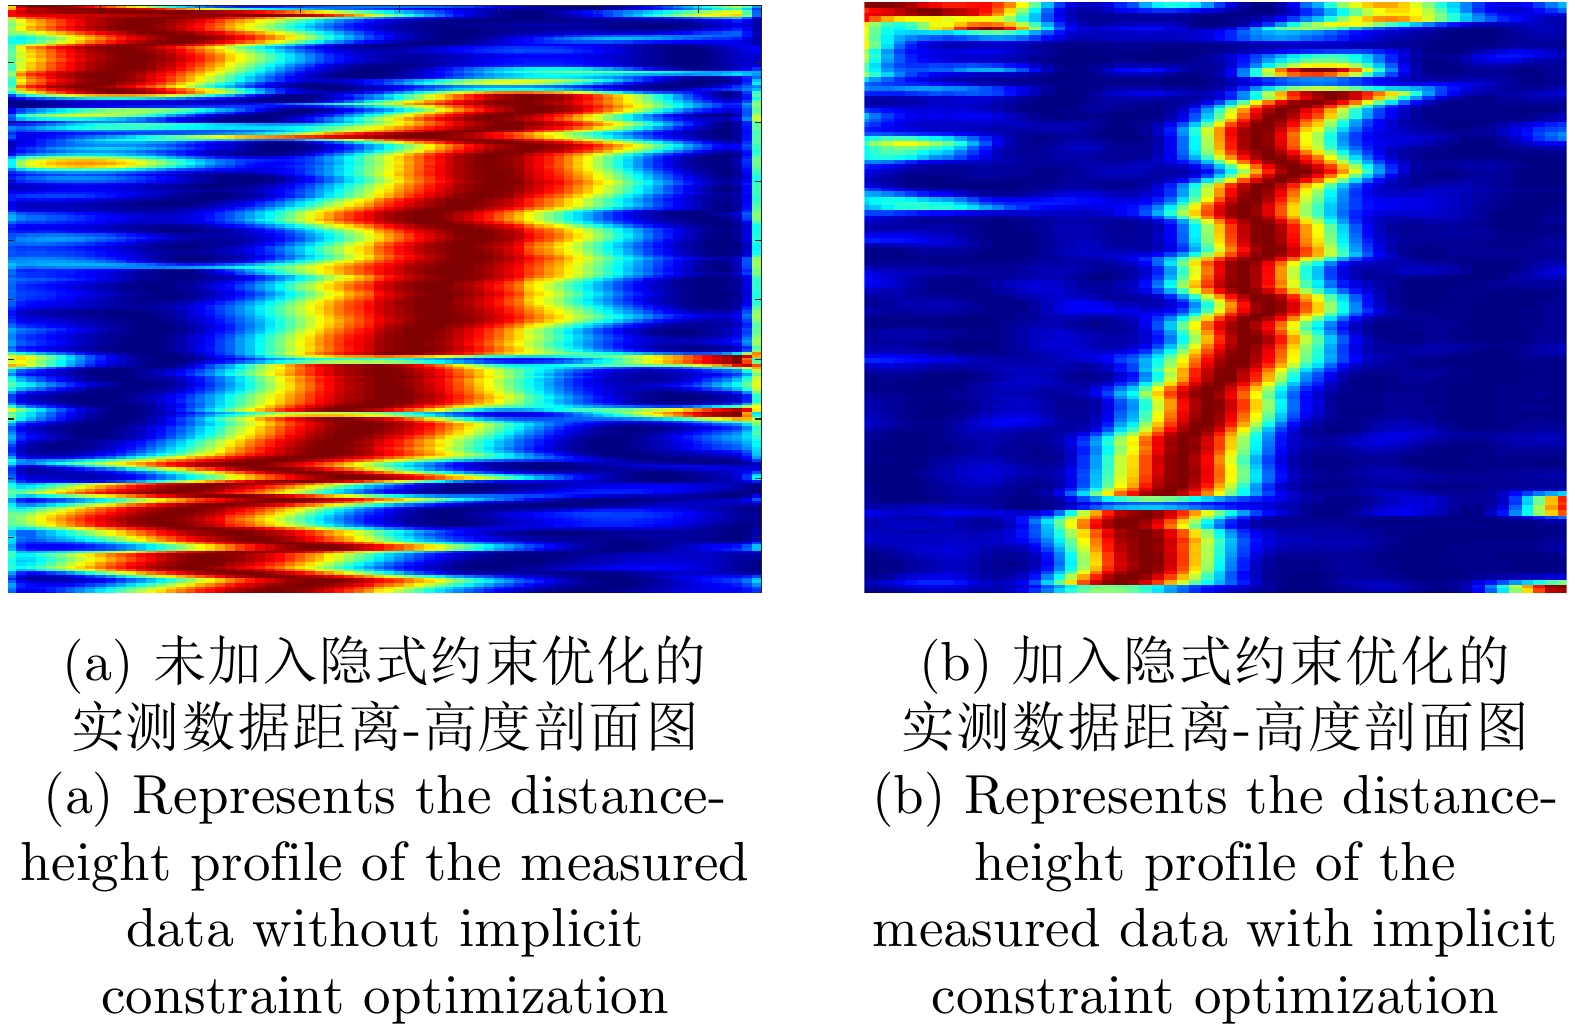
图 16 引入隐式几何连续性约束距离-高度剖面对比图
Figure 16. Implicit geometric continuity constrained distance-height profile comparison

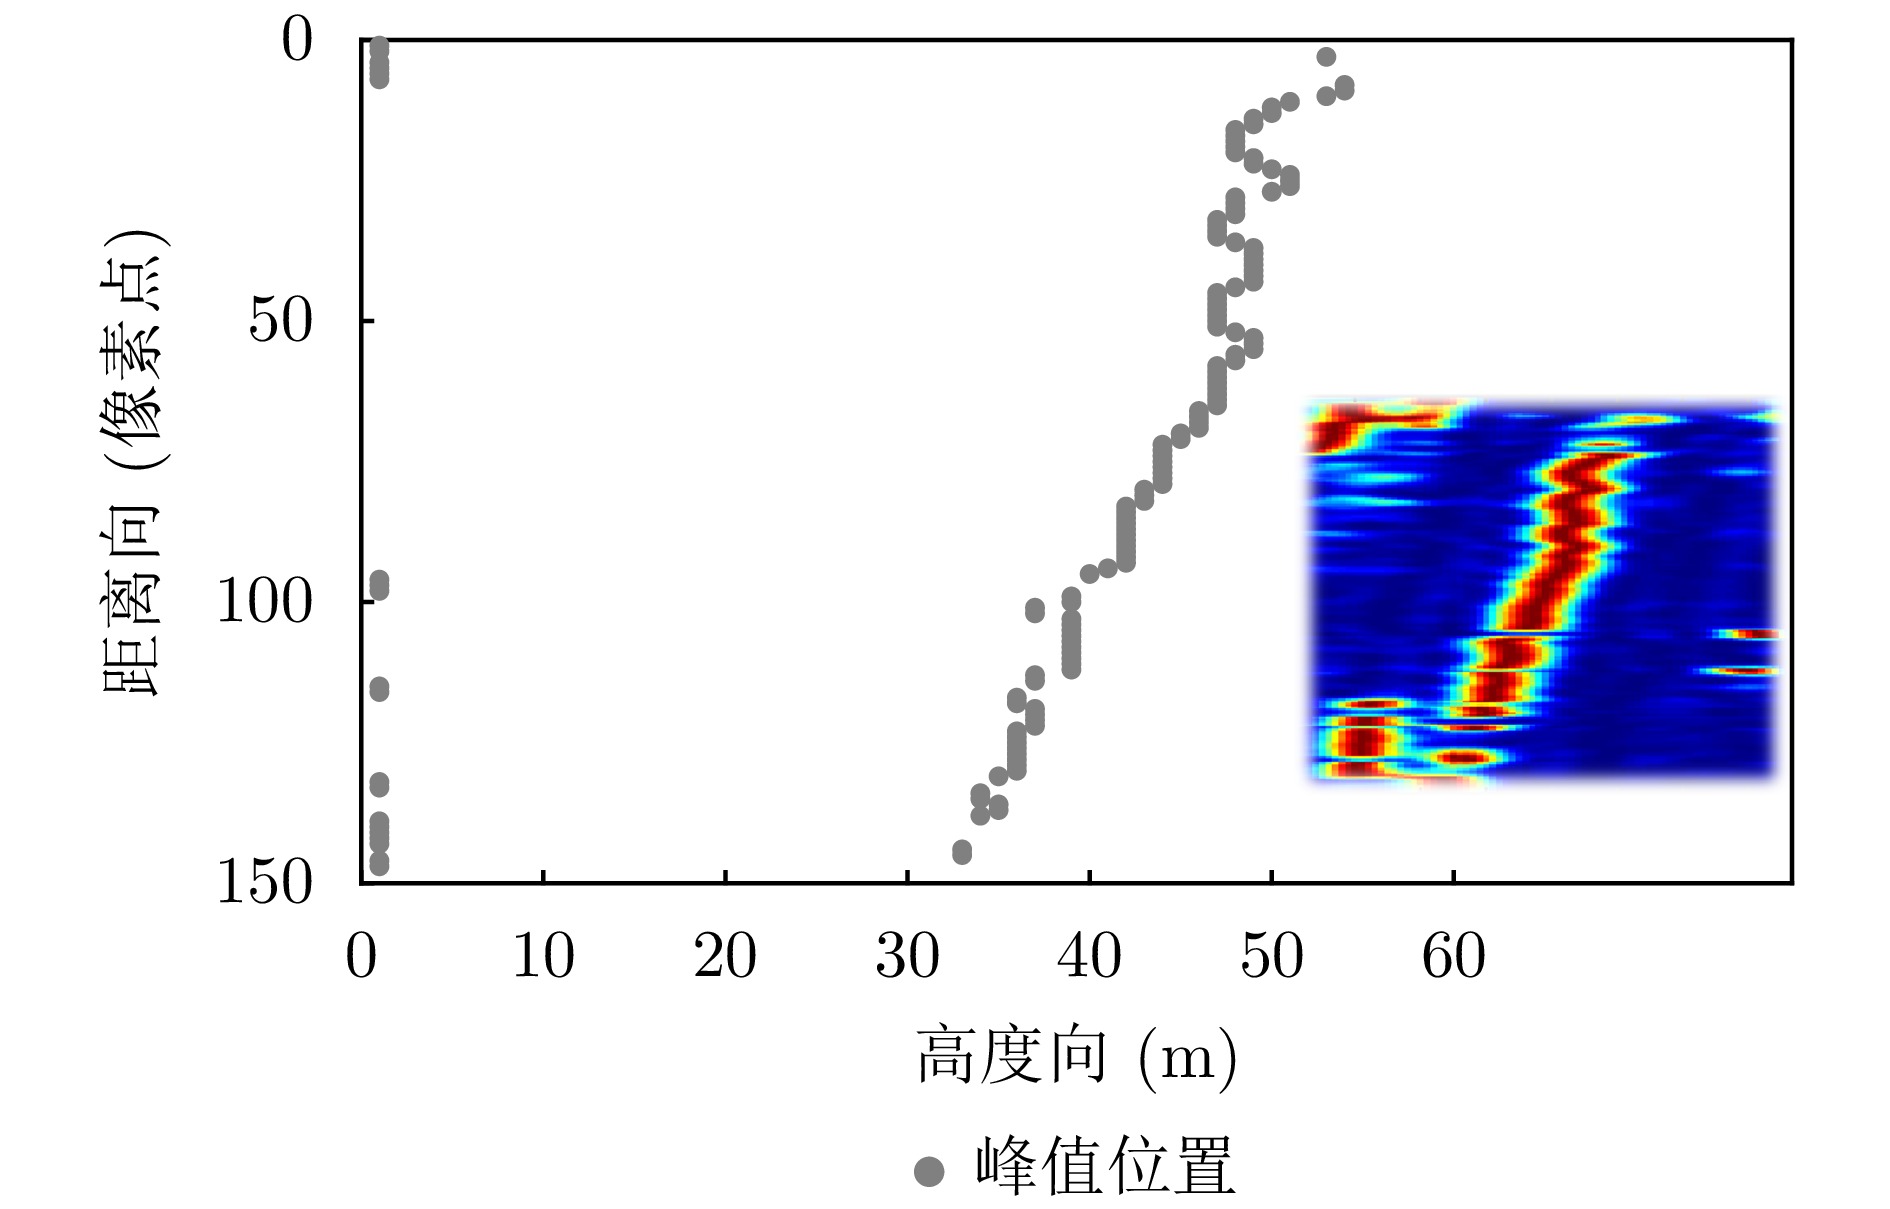
图 17 实测区域的距离-高程谱及其对应的谱峰位置散点图
Figure 17. The range-elevation spectrum of the measured area and its corresponding scatter plot of spectral peak position

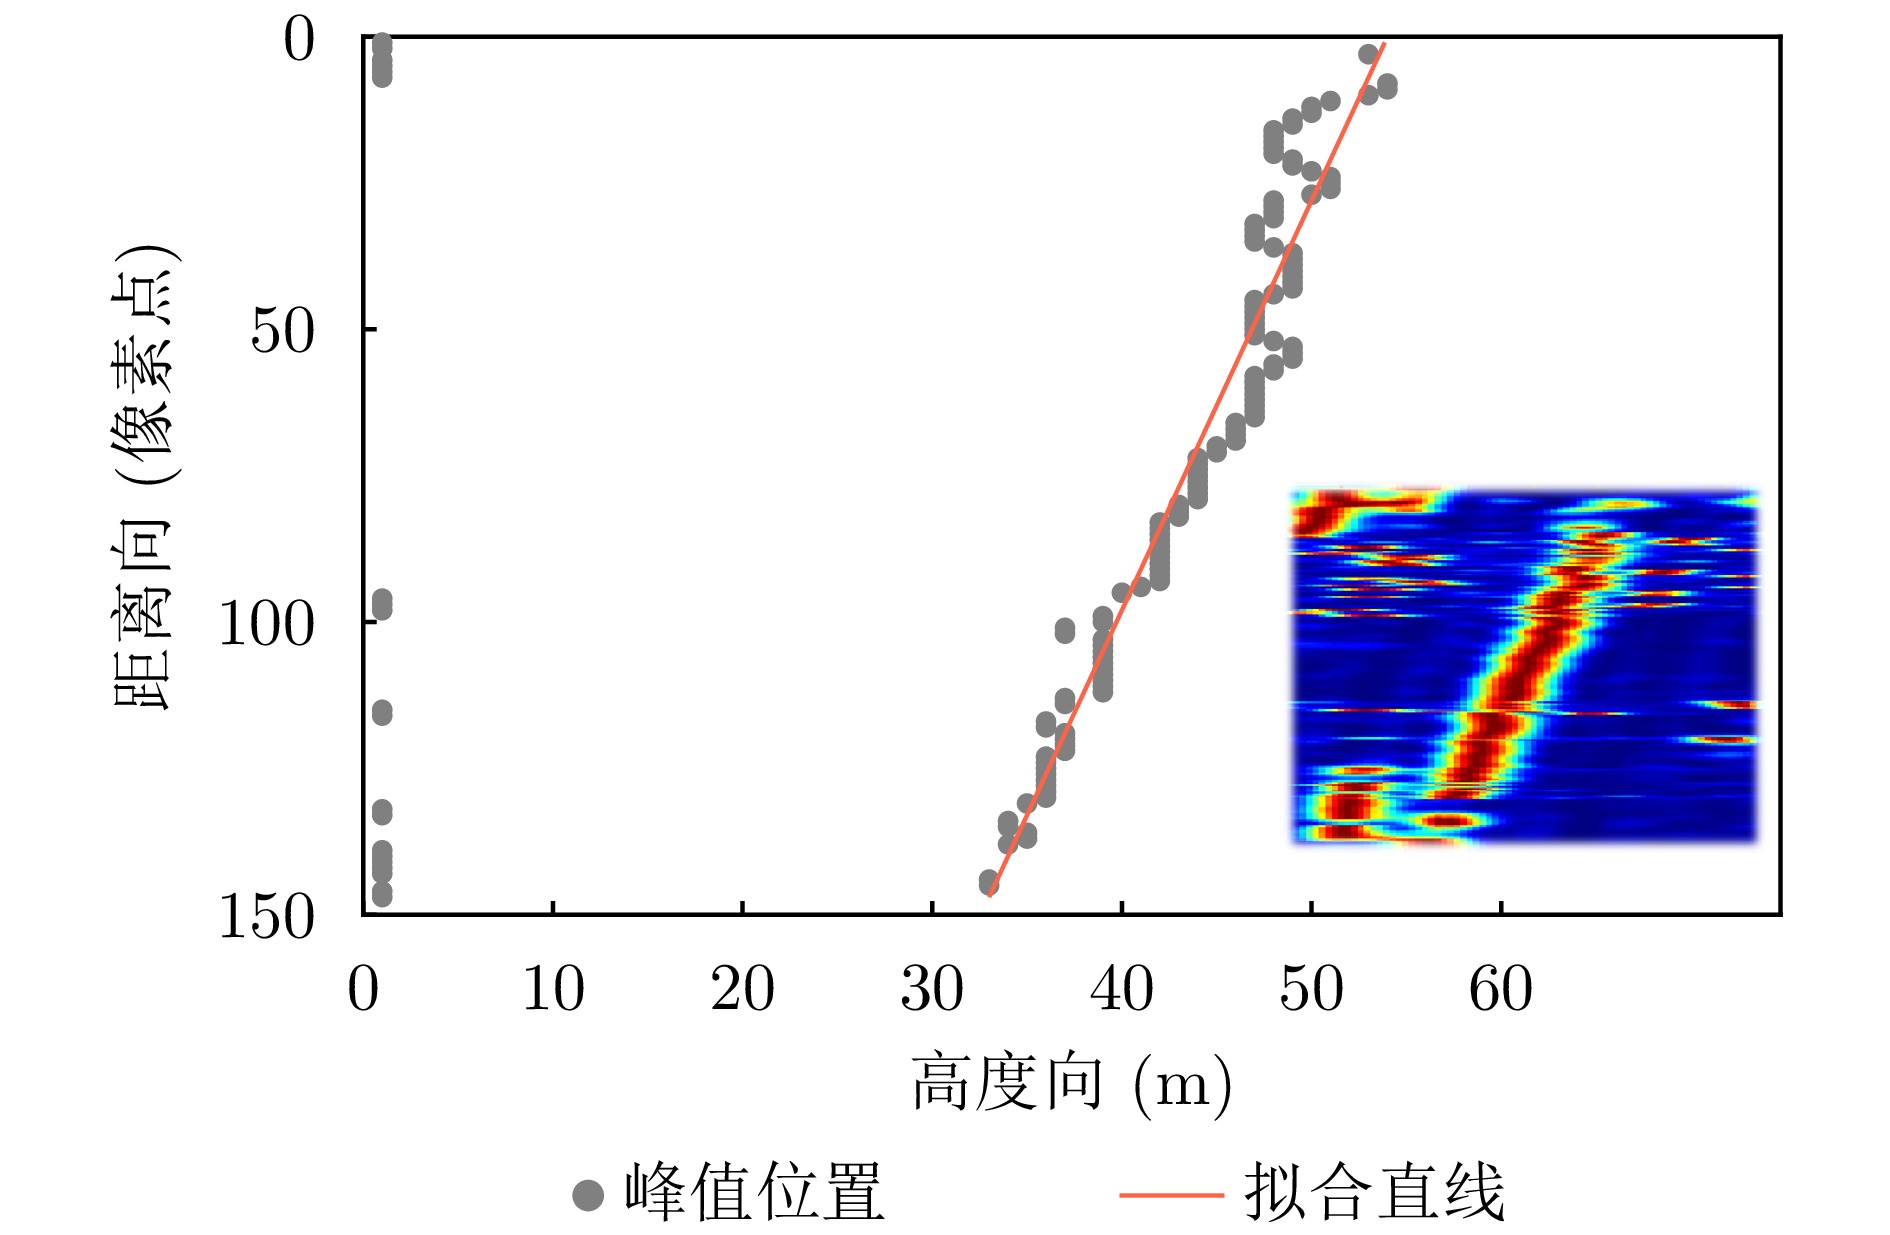
图 18 距离-高程谱几何结构拟合与约束解叠掩效果图
Figure 18. The effect of range-elevation spectral geometry fitting and constraint overlay
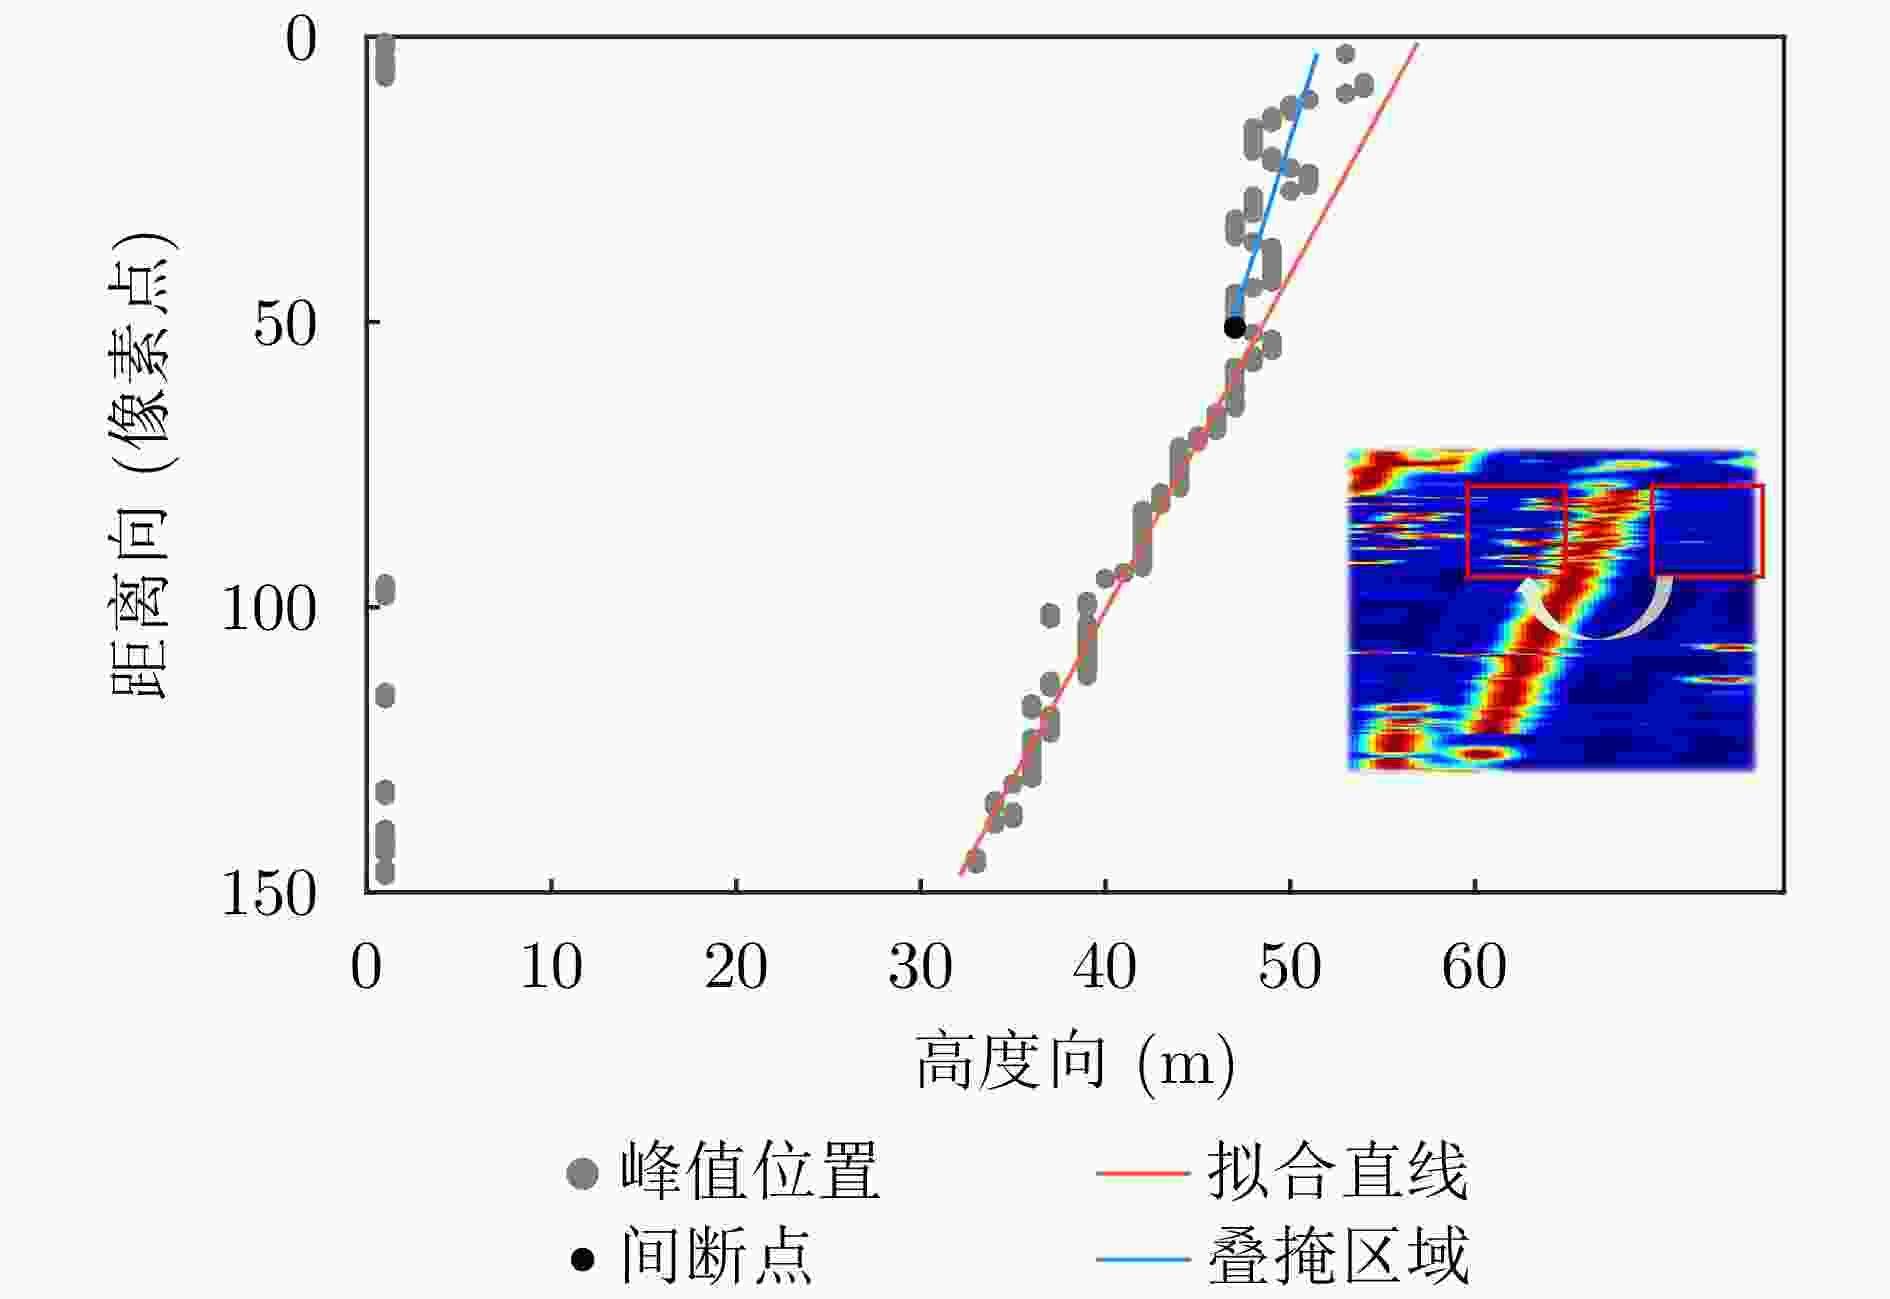
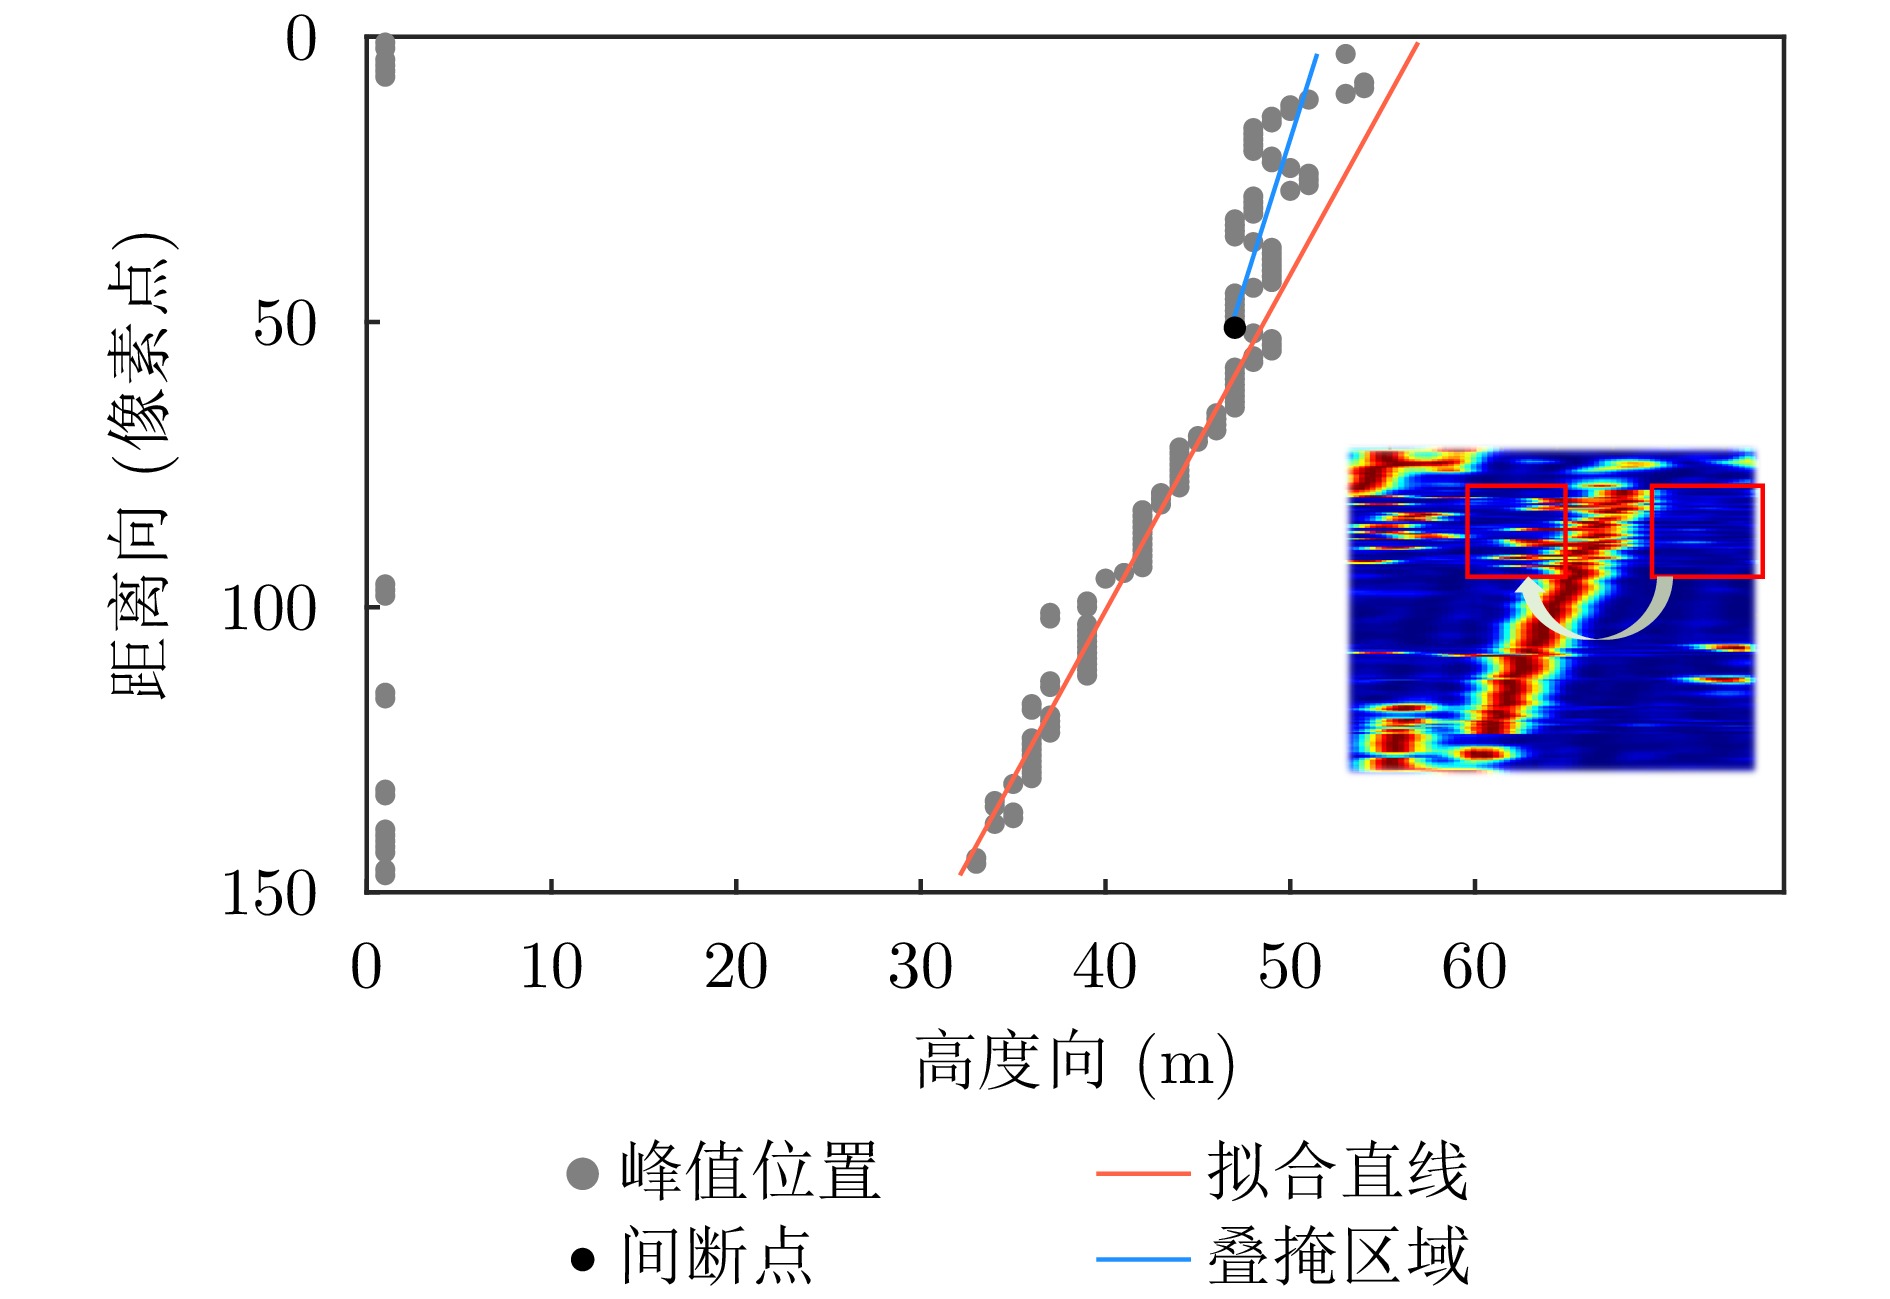
图 19 叠掩区域探测后显式几何连续性约束解叠掩效果图
Figure 19. The effect of explicit geometric continuity constraint unmasking after detecting the overlay region
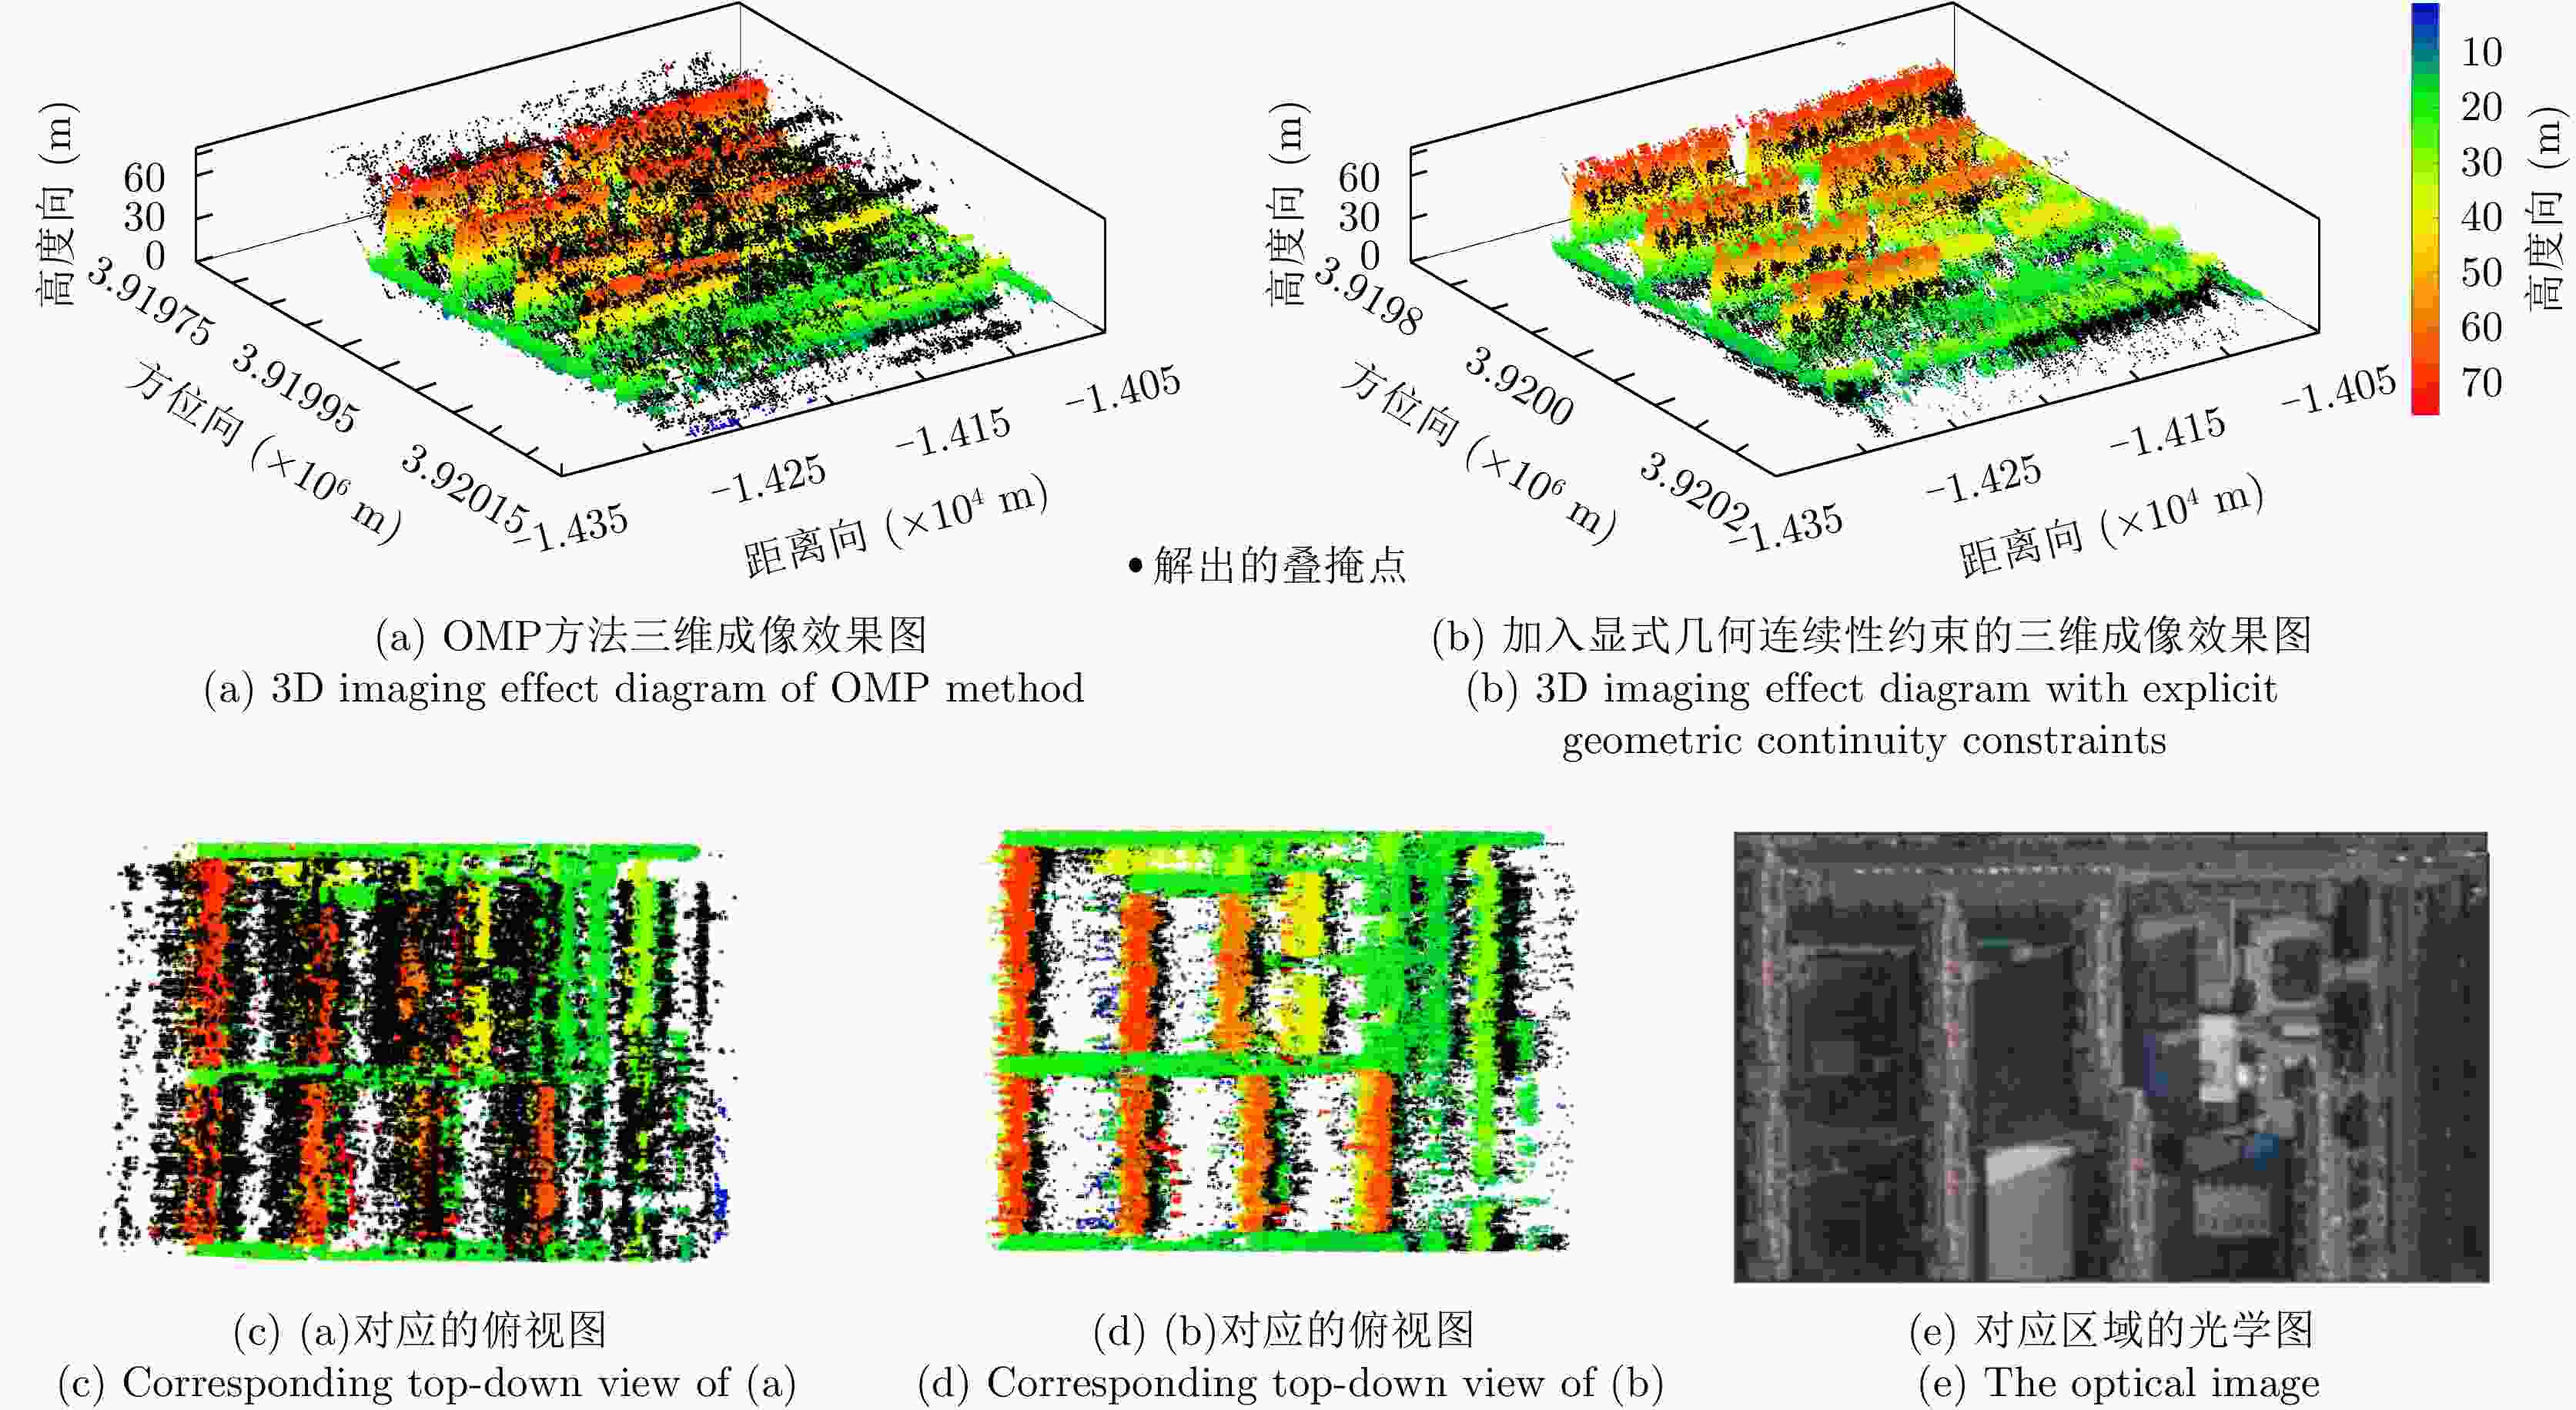
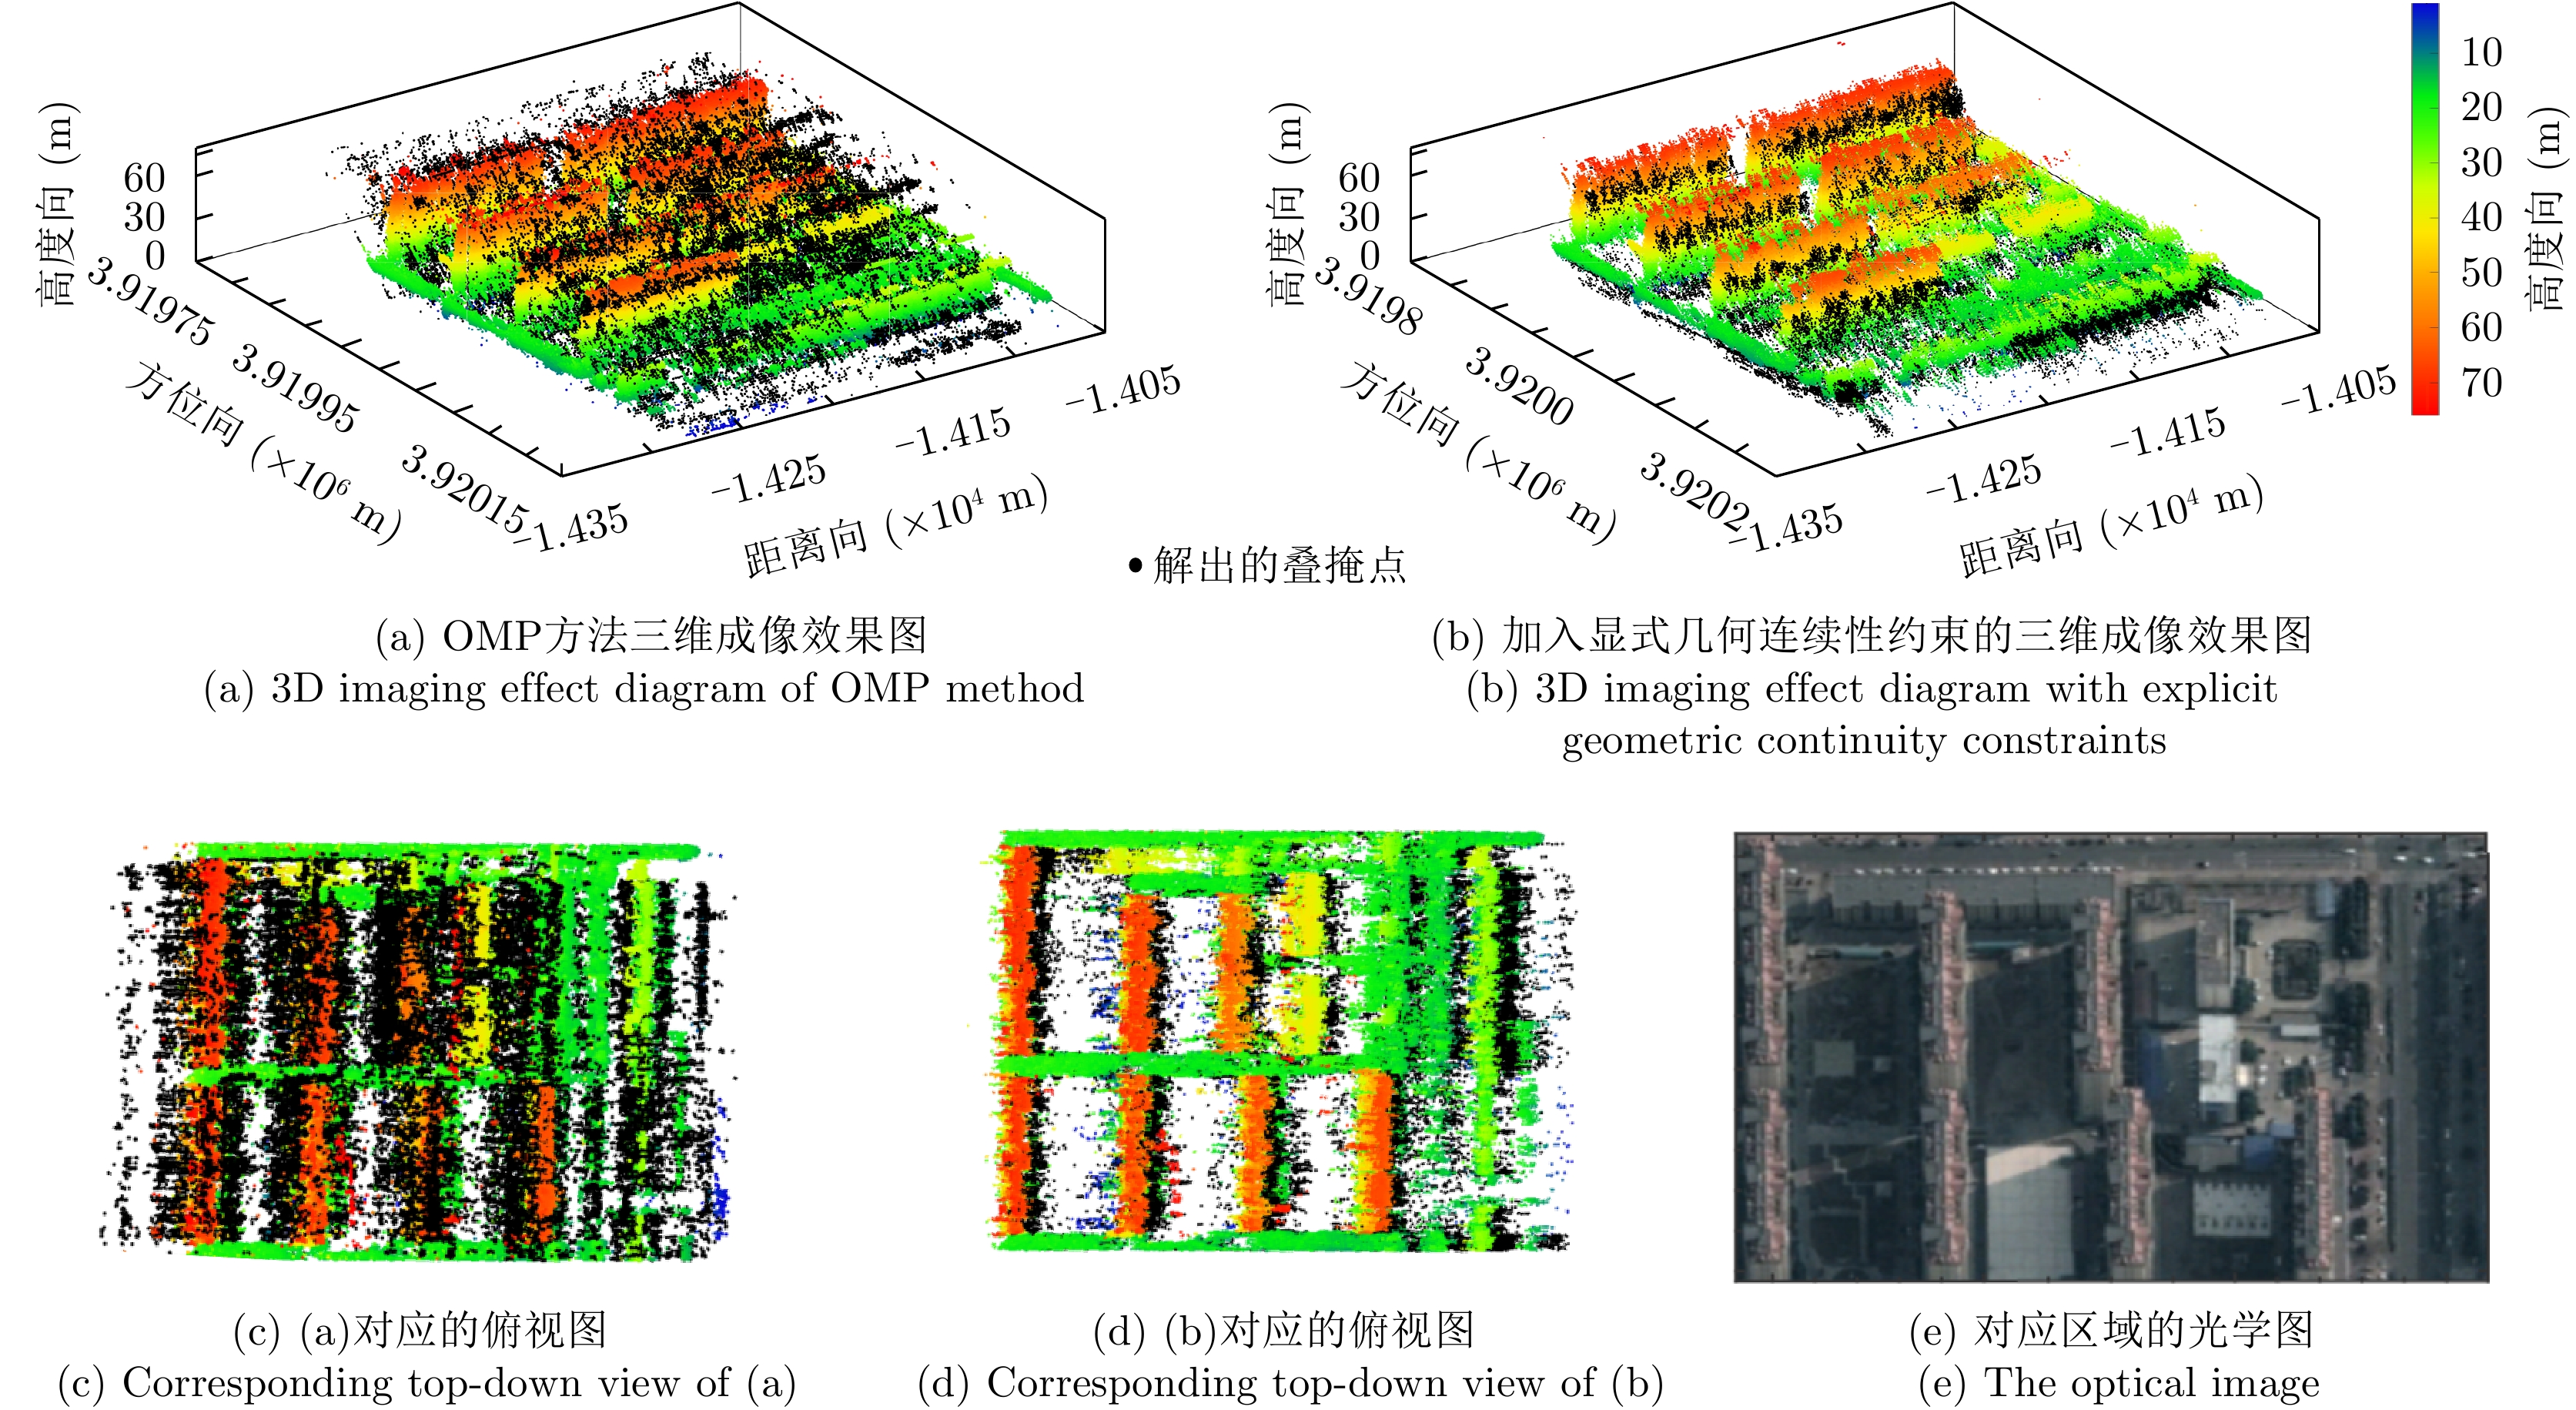
图 20 运城区域三维成像结果对比图
Figure 20. The comparison diagram of 3D imaging results shows in the Yuncheng region
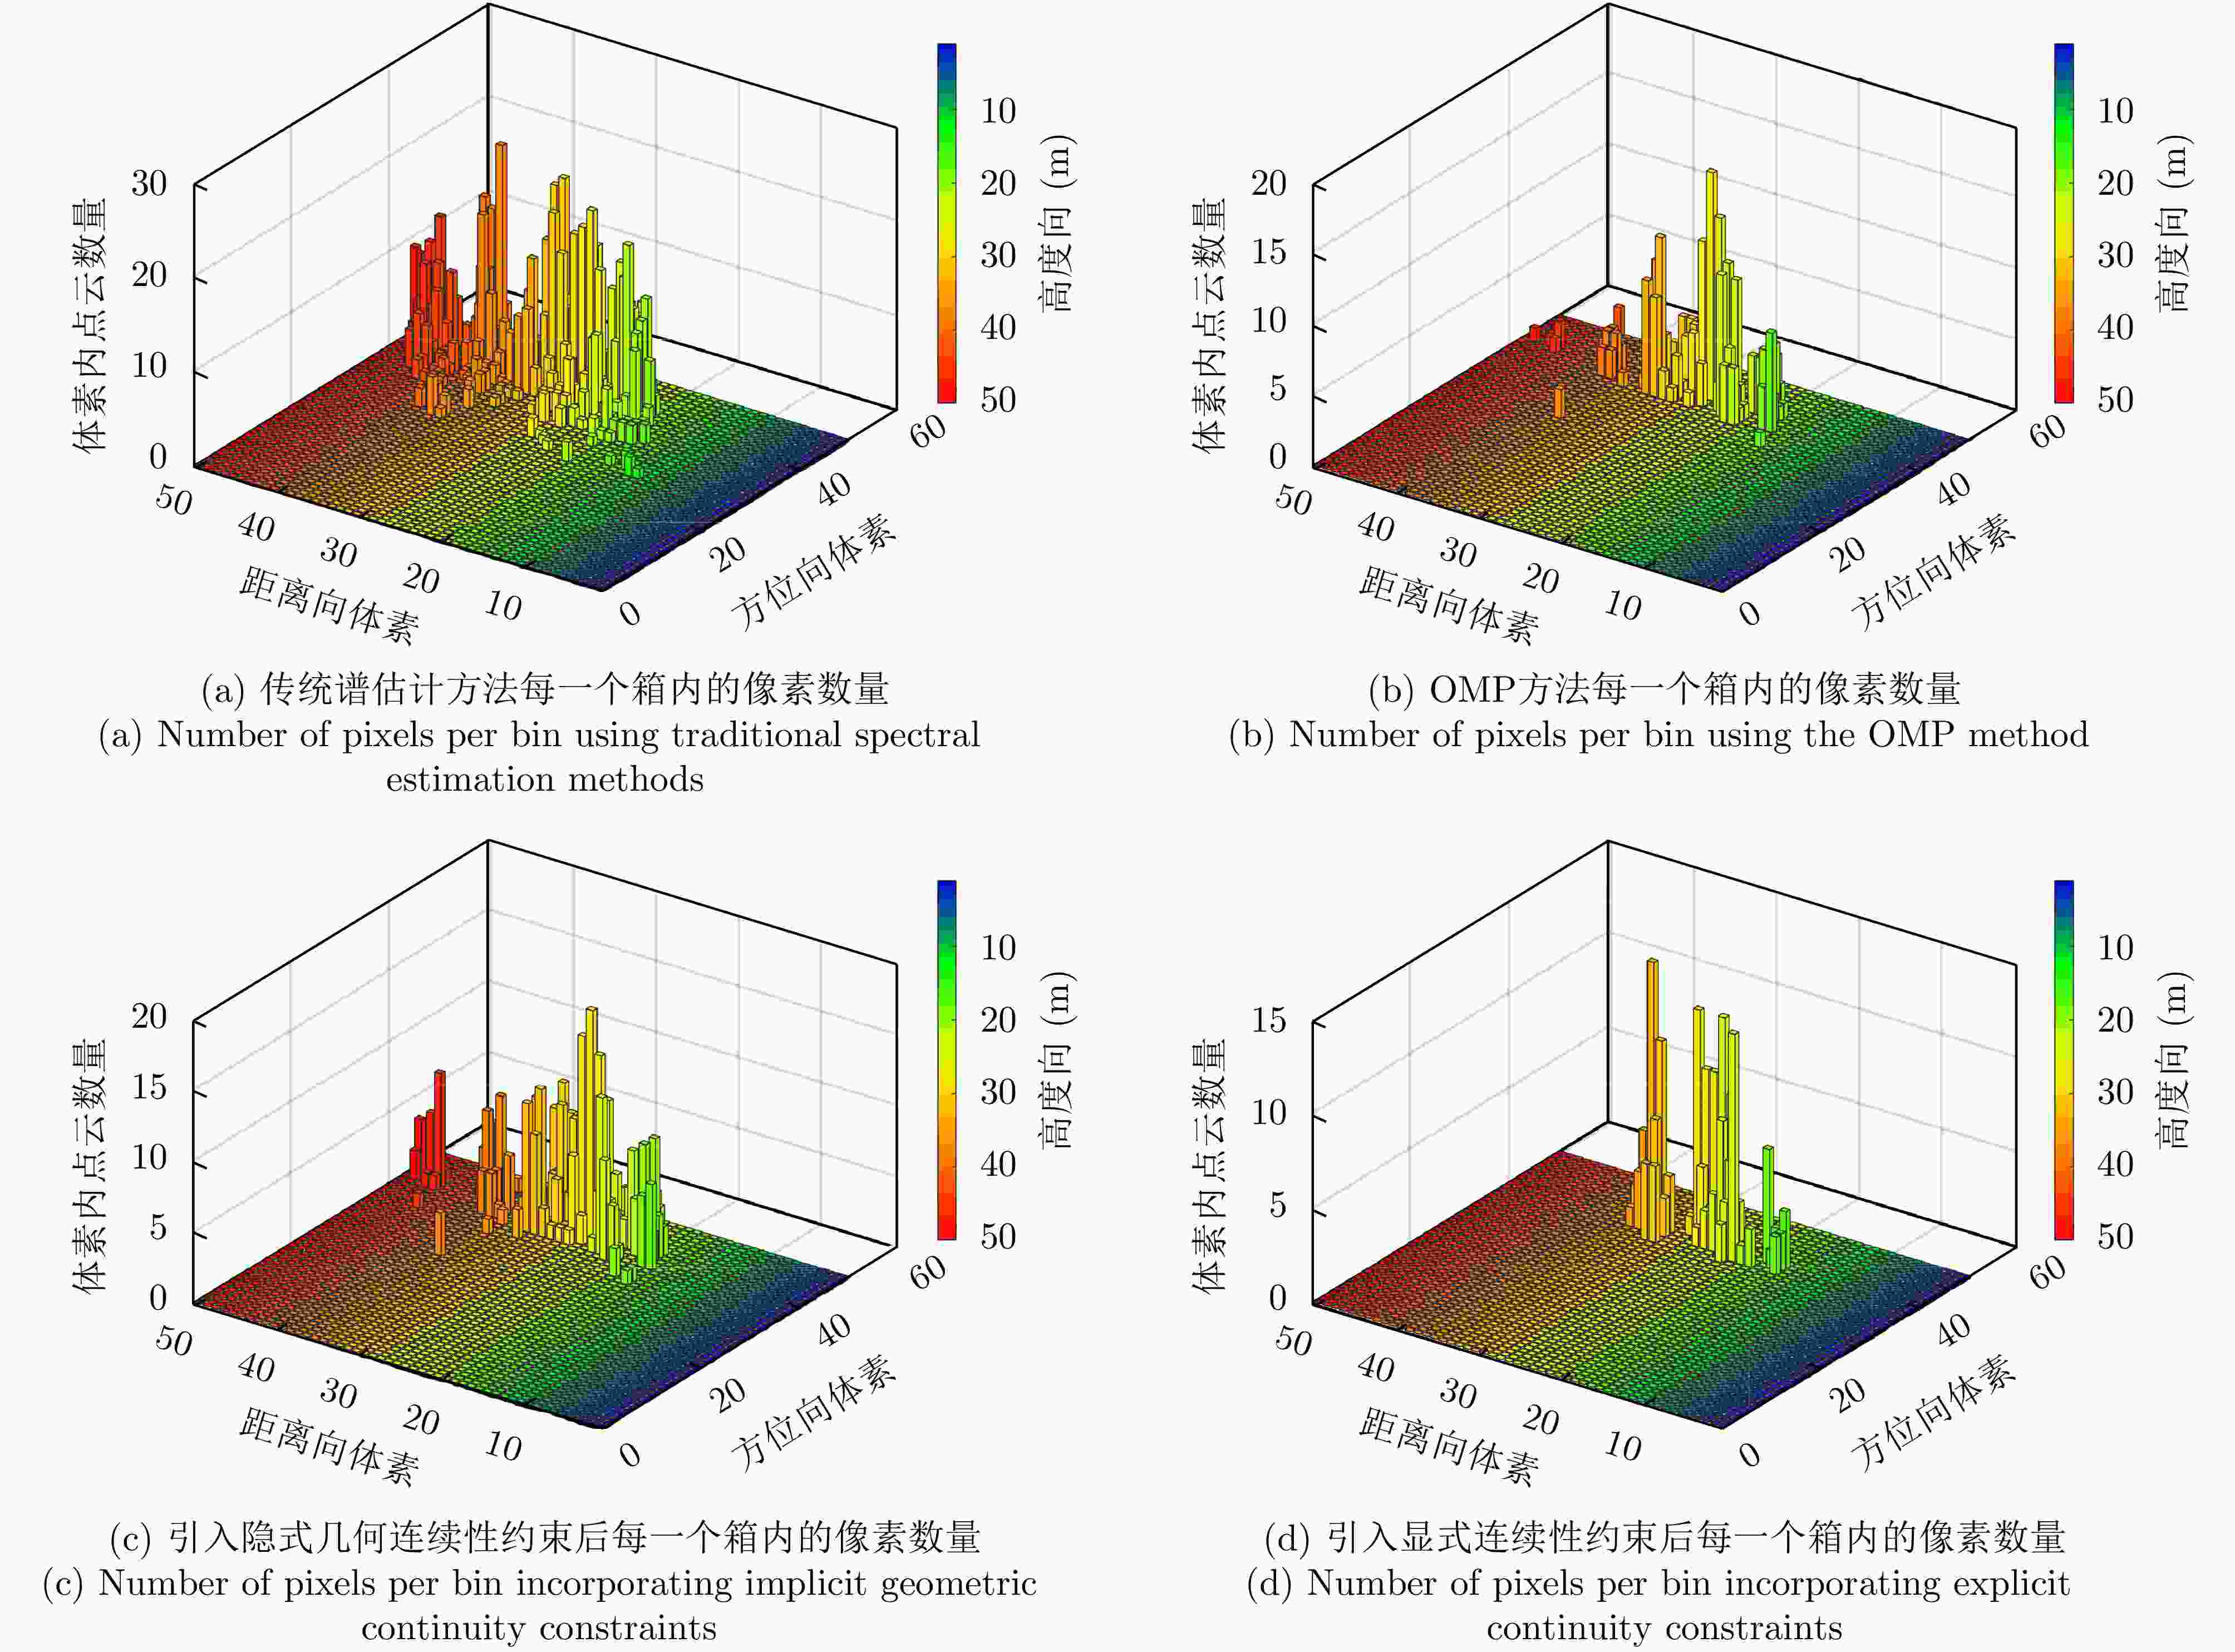
图 21 空间分体素后选取某一高度切面的体素内像素数量对比图
Figure 21. Comparison map of pixel counts within voxels at a specific height slice after spatial voxelization
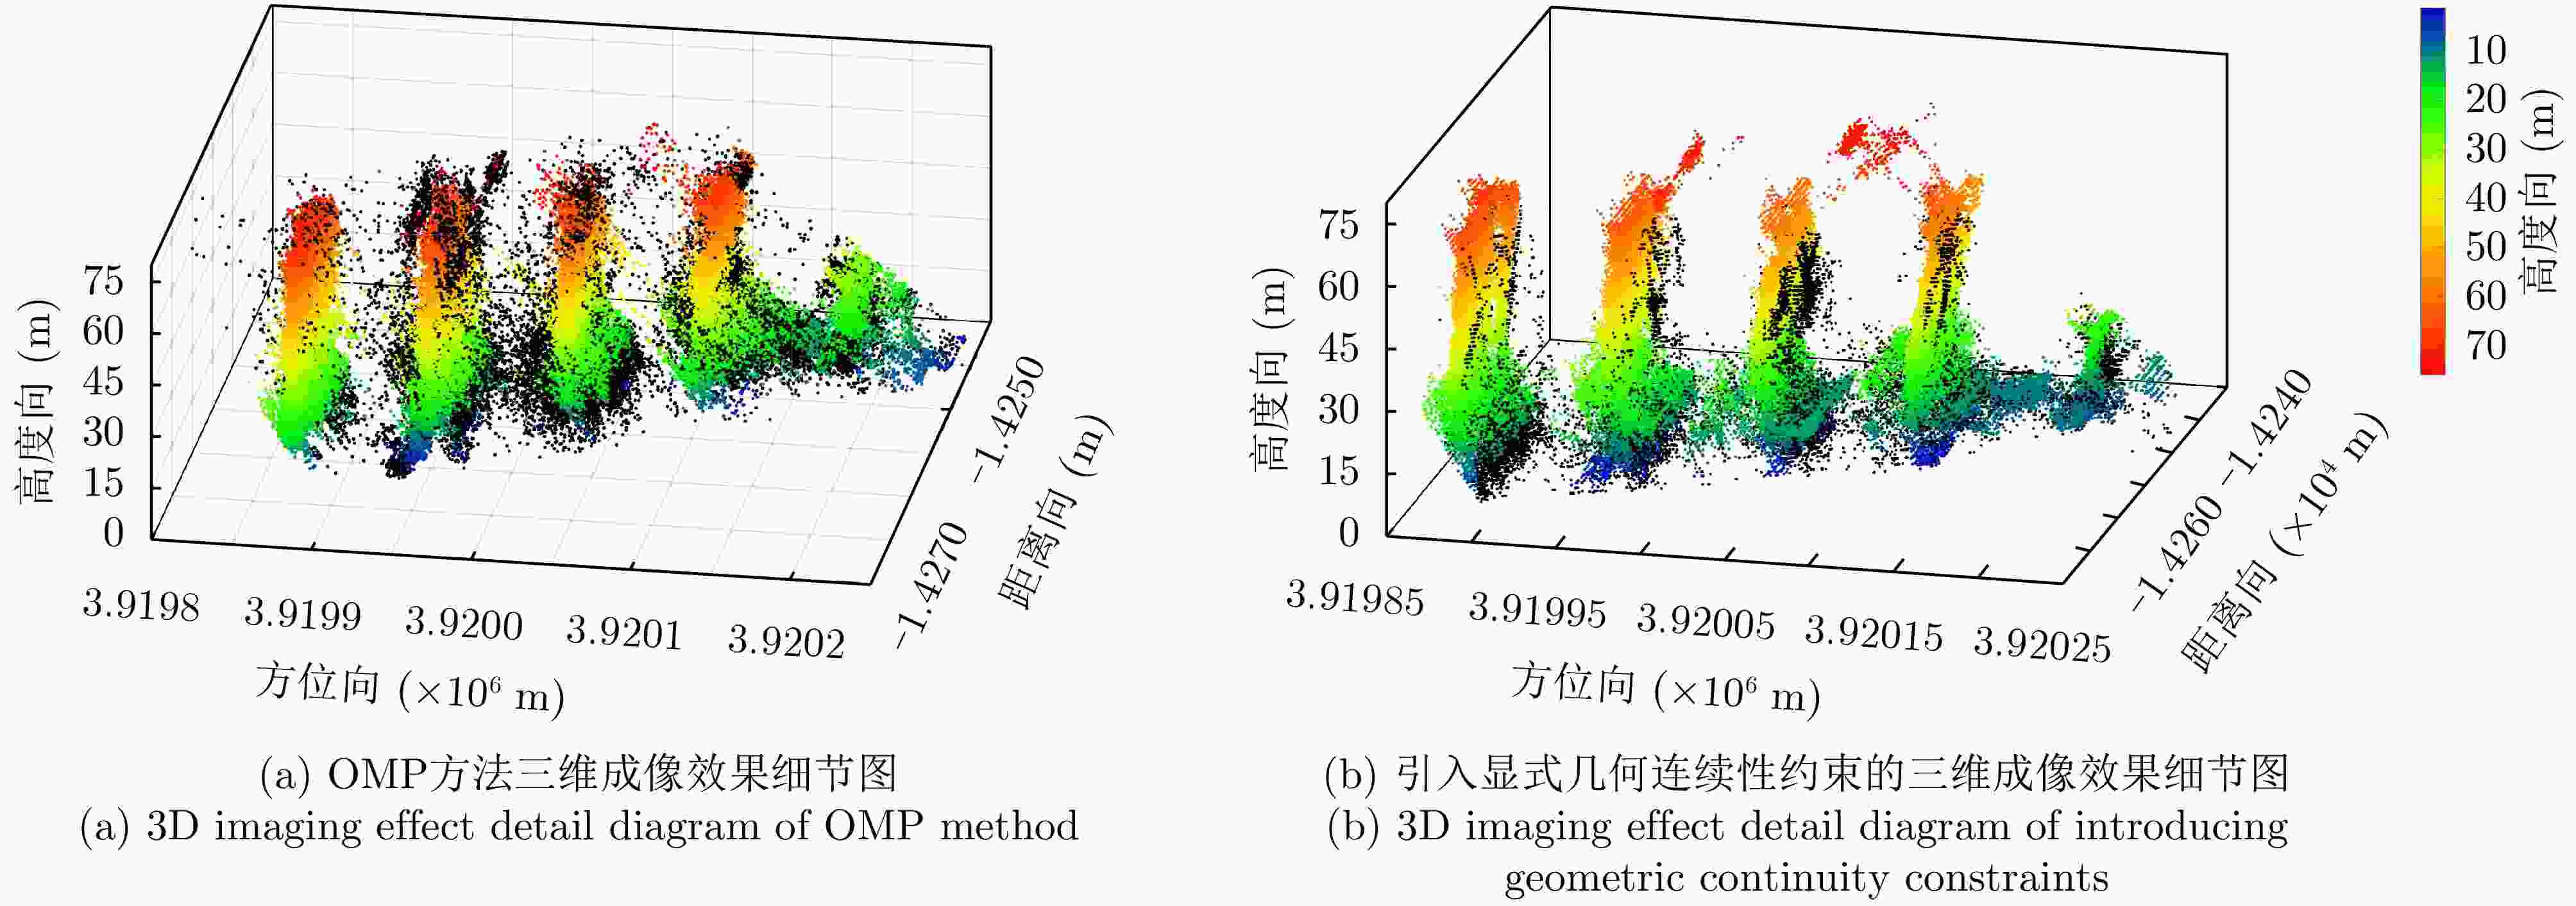
图 22 运城区域三维成像结果细节对比图
Figure 22. Detail comparison diagram of 3D imaging results in the Yuncheng region
表 1 机载阵列InSAR图像的主要参数(SARMV3D-3.0)
Table 1. Main parameters of airborne array InSAR images (SARMV3D-3.0)
参数 数据集1 (港口) 雷达高度(m) 400 波长(m) 0.021 分辨率(距离向×方位向) 0.13 m×0.19 m 入射角(区域中心) 45° 轨数 14 基线范围(m) [0, 3.9]  下载: 导出CSV
表 2 机载阵列InSAR图像的主要参数(SARMV3D-1.0)
Table 2. Main parameters of airborne array InSAR images (SARMV3D-1.0)
参数 数据集1 (运城) 数据集2 (峨眉) 雷达高度(m) 1667 2200 波长(m) 0.035 0.031 分辨率(距离向×方位向) 0.15 m×0.07 m 0.13 m×0.10 m 入射角(区域中心) 34° 34° 轨数 8 12 基线范围(m) [0, 0.6] [0, 1.35]
下载: 导出CSV
表 3 不同方法的指标对比
Table 3. Comparison of indicators of different methods
算法 高程分辨率(m) 三维重建熵 超分辨率(倍) 谱估计 23.2(Pref) 7.1 1.00 压缩感知 20.0 5.0 1.20 隐式约束 16.2 4.2 1.40 显式约束 5.0 2.2 4.60
下载: 导出CSV
-
[1] KNAELL K and CARDILLO G P. Radar tomography for the generation of three-dimensional images[J]. IEE Proceedings - Radar, Sonar and Navigation, 1995, 142(2): 54–60. doi: 10.1049/ip-rsn:19951791. [2] ZHU Xiaoxiang and BAMLER R. Superresolving SAR tomography for multidimensional imaging of urban areas: Compressive sensing-based TomoSAR inversion[J]. IEEE Signal Processing Magazine, 2014, 31(4): 51–58. doi: 10.1109/MSP.2014.2312098. [3] TEBALDINI S, NAGLER T, ROTT H, et al. Imaging the internal structure of an alpine glacier via L-band airborne SAR tomography[J]. IEEE Transactions on Geoscience and Remote Sensing, 2016, 54(12): 7197–7209. doi: 10.1109/TGRS.2016.2597361. [4] HUANG Yue, FERRO-FAMIL L, and REIGBER A. Under-foliage object imaging using SAR tomography and polarimetric spectral estimators[J]. IEEE Transactions on Geoscience and Remote Sensing, 2012, 50(6): 2213–2225. doi: 10.1109/TGRS.2011.2171494. [5] FORNARO G, LOMBARDINI F, and SERAFINO F. Three-dimensional multipass SAR focusing: Experiments with long-term spaceborne data[J]. IEEE Transactions on Geoscience and Remote Sensing, 2005, 43(4): 702–714. doi: 10.1109/TGRS.2005.843567. [6] REIGBER A and MOREIRA A. First demonstration of airborne SAR tomography using multibaseline L-band data[J]. IEEE Transactions on Geoscience and Remote Sensing, 2000, 38(5): 2142–2152. doi: 10.1109/36.868873. [7] HU Fengming, XU Feng, WANG R, et al. Conceptual study and performance analysis of tandem multi-antenna spaceborne SAR interferometry[J]. Journal of Remote Sensing, 2024, 4: 0137. doi: 10.34133/remotesensing.0137. [8] ZHU Xiaoxiang and BAMLER R. Super-resolution power and robustness of compressive sensing for spectral estimation with application to spaceborne tomographic SAR[J]. IEEE Transactions on Geoscience and Remote Sensing, 2012, 50(1): 247–258. doi: 10.1109/TGRS.2011.2160183. [9] 丁赤飚, 仇晓兰, 徐丰, 等. 合成孔径雷达三维成像—从层析、阵列到微波视觉[J]. 雷达学报, 2019, 8(6): 693–709. doi: 10.12000/JR19090.DING Chibiao, QIU Xiaolan, XU Feng, et al. Synthetic aperture radar three-dimensional imaging—from TomoSAR and array InSAR to microwave vision[J]. Journal of Radars, 2019, 8(6): 693–709. doi: 10.12000/JR19090. [10] ZHU Xiaoxiang, GE Nan, and SHAHZAD M. Joint sparsity in SAR tomography for urban mapping[J]. IEEE Journal of Selected Topics in Signal Processing, 2015, 9(8): 1498–1509. doi: 10.1109/JSTSP.2015.2469646. [11] JIAO Zekun, DING Chibiao, QIU Xiaolan, et al. Urban 3D imaging using airborne TomoSAR: Contextual information-based approach in the statistical way[J]. ISPRS Journal of Photogrammetry and Remote Sensing, 2020, 170: 127–141. doi: 10.1016/j.isprsjprs.2020.10.013. [12] JIAO Zekun, QIU Xiaolan, DONG Shuhang, et al. Preliminary exploration of geometrical regularized SAR tomography[J]. ISPRS Journal of Photogrammetry and Remote Sensing, 2023, 201: 174–192. doi: 10.1016/j.isprsjprs.2023.05.019. [13] 仇晓兰, 焦泽坤, 杨振礼, 等. 微波视觉三维SAR关键技术及实验系统初步进展[J]. 雷达学报, 2022, 11(1): 1–19. doi: 10.12000/JR22027.QIU Xiaolan, JIAO Zekun, YANG Zhenli, et al. Key technology and preliminary progress of microwave vision 3D SAR experimental system[J]. Journal of Radars, 2022, 11(1): 1–19. doi: 10.12000/JR22027. [14] 徐牧, 王雪松, 肖顺平. 基于改善极化相似性的极化SAR目标增强新方法[J]. 电子与信息学报, 2008, 30(5): 1047–1051. doi: 10.3724/SP.J.1146.2007.00754.XU Mu, WANG Xuesong, and XIAO Shunping. Target enhancement in POL-SAR imagery based on the improvement of polarization characteristics similarity[J]. Journal of Electronics & Information Technology, 2008, 30(5): 1047–1051. doi: 10.3724/SP.J.1146.2007.00754. [15] JIANG Sha, QIU Xiaolan, HAN Bing, et al. A quality assessment method based on common distributed targets for GF-3 polarimetric SAR data[J]. Sensors, 2018, 18(3): 807. doi: 10.3390/s18030807. [16] SONG Shujie, QIU Xiaolan, and SHANGGUAN Songtao. Study on the three dimension imaging methods of fully-polarised array InSAR[C]. IET International Radar Conference, Chongqing, China, 2023: 2999–3003. doi: 10.1049/icp.2024.1571. [17] CHENG Guozhen, HU Fengming, TIAN Jifan, et al. Geometric continuity-constrained SAR tomography for sparse array InSAR acquisitions[J]. IEEE Transactions on Geoscience and Remote Sensing, 2024, 62: 5228914. doi: 10.1109/TGRS.2024.3498835. [18] CHEN Sheng, BILLINGS S A, and LUO W. Orthogonal least squares methods and their application to non-linear system identification[J]. International Journal of Control, 1989, 50(5): 1873–1896. doi: 10.1080/00207178908953472. [19] 仇晓兰, 罗一通, 程遥, 等. SAR微波视觉三维成像数据集3.0[J/OL]. 雷达学报. https://radars.ac.cn/web/data/getData?dataType=SARMV3D, 2024.QIU Xiaolan, LUO Yitong, CHENG Yao, et al. SAR microwave vision 3D imaging dataset 3.0[J/OL]. Journal of Radars. https://radars.ac.cn/web/data/getData?dataType=SARMV3D, 2024. [20] 仇晓兰, 焦泽坤, 彭凌霄, 等. SARMV3D-1.0: SAR微波视觉三维成像数据集[J]. 雷达学报, 2021, 10(4): 485–498. doi: 10.12000/JR21112.QU Xiaolan, JIAO Zekun, PENG Lingxiao, et al. SARMV3D-1.0: Synthetic aperture radar microwave vision 3D imaging dataset[J]. Journal of Radars, 2021, 10(4): 485–498. doi: 10.12000/JR21112. [21] ZHU Xiaoxiang and BAMLER R. Very high resolution spaceborne SAR tomography in urban environment[J]. IEEE Transactions on Geoscience and Remote Sensing, 2010, 48(12): 4296–4308. doi: 10.1109/TGRS.2010.2050487. -


计量
- 文章访问数:
- HTML全文浏览量:
- PDF下载量:
- 被引次数: 0

