基于部件级三维参数化电磁模型的SAR目标物理可解释识别方法

文贡坚 马聪慧 丁柏圆 宋海波

项喆, 陈伯孝. 频率分集阵列的距离角度解耦的波束形成 (in English)[J]. 雷达学报, 2018, 7(2): 212-219. doi: 10.12000/JR16113
引用本文: 文贡坚, 马聪慧, 丁柏圆, 等. 基于部件级三维参数化电磁模型的SAR目标物理可解释识别方法[J]. 雷达学报, 2020, 9(4): 608–621. doi: 10.12000/JR20099
Xiang Zhe, Chen Baixiao. Range-angle Decoupled Transmit Beamforming with Frequency Diverse Array (in English)[J]. Journal of Radars, 2018, 7(2): 212-219. doi: 10.12000/JR16113
Citation: WEN Gongjian, MA Conghui, DING Baiyuan, et al. SAR target physics interpretable recognition method based on three dimensional parametric electromagnetic part model[J]. Journal of Radars, 2020, 9(4): 608–621. doi: 10.12000/JR20099

基于部件级三维参数化电磁模型的SAR目标物理可解释识别方法

DOI: 10.12000/JR20099
基金项目: 国家部委基金
详细信息
    作者简介:

    文贡坚(1972–),男,湖南宁乡人,教授,博士生导师,研究方向为遥感图像处理

    马聪慧(1987–),女,湖北襄阳人,博士,讲师。2017年在国防科技大学电子工程学院获得博士学位,现担任航天工程大学讲师。主要研究方向为SAR目标识别。E-mail: ma_conghui@yeah.net

    丁柏圆(1990–),男,安徽池州人,博士。2018年在国防科技大学电子工程学院获得博士学位,现为96901部队助理研究员。研究方向为SAR自动目标识别

    宋海波(1992–),男,内蒙古呼伦贝尔人,博士生。主要研究方向为SAR自动目标识别,特征提取

    通讯作者:

    文贡坚 wengongjian@sina.com

  • 责任主编:邢孟道 Corresponding Editor: XING Mengdao
  • 中图分类号: TN957

SAR Target Physics Interpretable Recognition Method Based on Three Dimensional Parametric Electromagnetic Part Model

Funds: The National Minstries Foundation
More Information
  • 摘要: 该文通过部件级三维参数化电磁模型(3D-PEPM)描述了复杂目标的电磁散射现象,并基于此模型提出了一种新的合成孔径雷达(SAR)目标识别方法。该方法首先根据雷达参数将3D-PEPM中各个散射体的散射响应投影到二维图像平面,预测每个散射体的位置和形状,然后根据3D-PEPM提供的先验信息评估3D-PEPM与SAR数据之间的相似程度,最后利用一种视角调整方法对整个过程进行优化,产生3D-PEPM和SAR数据之间的最终匹配分数,并根据该匹配分数完成识别决策。这种识别方法明确标识了SAR数据和3D-PEPM散射体之间的对应关系,具有清晰的物理可解释性,能够有效处理各种扩展条件下的SAR目标识别问题,仿真实验验证了该方法的有效性。


  • Frequency Diverse Arrays (FDA) radar has recently drawn much attention among the researchers. FDA differs from the traditional phased array by using a small frequency increment across the array elements, which results in a range-angle-dependent beam pattern. FDA radar system is first proposed in Ref. [1]. In FDA radar, a uniform interelement frequency offset is applied across the array elements. FDA radar with uniform small and large frequency offset frequency has been investigated in Refs. [17]. Small frequency offset has been exploited to generate range-dependent beampattern, while large frequency offset can get independent echoes from the target.

    Unlike the phased array, the range-angle dependency of the FDA beampattern allows the radar system to focus the transmit energy in a desired range-angle space. This unique feature of FDA helps to suppress the range-dependent interferences[8] and increases the received SINR consequently. Especially for the mainlobe interference and clutter, the FDA can achieve a significant improvement in SINR against the phased array because the FDA provides the increased Degrees Of Freedom (DOFs) in range domain. However, the FDA beampattern is shown to be periodic in range and time[2], which goes to maximum at multiple time and range values. With this multiple-maximum beampattern, the resulting SINR will be deteriorated when the interferers are located at any of the maxima. To improve SINR, FDA with Time-Dependent Frequency Offset (TDFO-FDA) was proposed to achieve a time-independent beampattern at the target location[9]. Nevertheless, the proposed beampattern is still periodic in range which will result in the loss of SINR. A nonuniformly spaced linear FDA with linear incremental frequency increment has also been studied in Ref. [10], and a nonrepeating beampattern has been obtained for range-angle imaging of targets. A uniformly spaced linear FDA with Logarithmically (Log-FDA) increasing frequency offset is proposed in Ref. [11]. The proposed strategy provides a nonperiodic beampattern with the single-maximum in space. In Ref. [12], the beampattern of FDA who transmits the pulsed signal has been studied. Lately, few more publications have done some work in decoupling the range-angle dependent beampattern of FDA[1316]. All these papers only address the properties of the FDA beampattern, and they do not study the common rule for the FDA configuration to form a single-maximum transmit beampattern.

    With the pioneer work on FDA radar, we aim to decouple the range and angle in the beampattern and provide a nonperiodic beampattern with the single-maximum in the illuminated range-angle space. In this paper, we propose a basic criteria for the FDA configuration, in which the element spacing and frequency increment are configurable, to form a single-maximum beampattern through mathematical analysis. This single-maximum beampattern, unlike the multiple-maxima beampattern, can help to further suppress range-dependent interferences, causing improved SINR and increased detect ability. The proposed rule for the FDA configuration will be helpful to design the FDA.

    The rest of the paper is organized as follows. In Section 2, the basic FDA model has been described and the basic criterion is derived for the FDA configuration to form a single-maximum beampattern through mathematical analysis. Moreover, several specific conditions are introduced. In Section 3, the beampattern has been plotted for the specific conditions discussed in Section 2. Finally, in Section 4 we conclude the paper.

    Consider an array of M transmit elements, we assume that the waveform radiated from each antenna element is identical with a frequency increment, as shown in Fig. 1. The radiated frequency from the m-th element is

    Figure  1.  FDA configuration
    fm=f0+Δfm, m=0,···,M1
    (1)

    where Dfm is the frequency increment of m-th element with reference to the carrier frequency f0. Specifically, Df0 = 0.

    Considering a given far-field point, the phase of the signal transmitted by the m-th element can be represented by

    ψm=2πfm(trmc)
    (2)

    where c and rm are the speed of light and the distance between the m-th element and the observed point, respectively.

    The range difference between individual elements is approximated by

    rm=r0dmsinθ0
    (3)

    where θ0 is the desired angle, dm is the spacing between the m-th element and the first element. Specifically, d0 = 0.

    So the phase difference between the m-th element and the first element is

    Δψm=ψmψ0=2π(fm(trmc)f0(tr0c))=2πΔfmt2πfmdmsinθ0c+2πΔfmr0c
    (4)

    In Eq. (4), the third term is important because it shows that the FDA radiation pattern depends on both the range and the frequency increment. Taking the first element as the reference for the array, the steering vector can be expressed as

    a(θ,r,t)=[1,···,exp(j2πΔfm(tc+r)+fmdmsinθc)]T
    (5)

    where [·]T denotes the transpose operator.

    In the pusled-FDA, for t[Te2,Te2] , Te is the pulsewidth, the maximum value of phase variance[12] during the pulse duration can be derived as

    ξ=maxm2πΔfmTe
    (6)

    When the phase variance ξ is small enough, the beampattern of the pulsed-FDA can be viewed as quasi-static. Actually, in practical radar systems, duty cycle other than pulse duration is often used to describe the characterization of the pulsed-waveform. Then, the phase variance ξ can be further written as

    |ξ|=maxm2π|Δfm|frdt=2πdtmaxmρm1
    (7)

    where dt is the duty cycle, which is usually small. Eq. (7) holds when maxmρm is also small.

    So under the condition Eq. (7), the time t can be neglected. So Eq. (5) can be simplified as

    a(θ,r)=[1,···,exp(j2πΔfmr+fmdmsinθc)]T
    (8)

    Throughout this paper, we assume a narrow-band system where the propagation delays manifest as phase shifts to the transmitted signals and Eq. (7) is satisfied. To steer the maximum at an expected target location ( θ 0, r0), the complex weights are configured as a( θ 0, r0), so the transmit beampattern can be expressed

    AF(θ,r)=|aH(θ0,r0)a(θ,r)|=|M1m=0exp(j2πΔfm(rr0)fmdm(sinθsinθ0)c)|

    (9)

    where [·]H denotes the conjugate transpose operator.

    It is easy to see that the beam direction will vary as a function of the range and angle, which means the beampattern is range-angle dependent. Since the beampattern is coupled in the range and angle, the target’s range and angle cannot be estimated directly by the FDA beamformer output. Note that the beampattern is also related to Dfm and dm, so the desired single-maximum beampattern can be obtained by setting the proper Dfm and dm.

    In Eq. (9), when m = 0, the exponential term is equal to 1. To obtain the maximum value of the beampattern, the exponential terms should be all equal to 1 for m=1,2,···,M1 . So the phase of the exponential term should be the integral multiple of 2π , which can be expressed as

    Δfm(rr0)f0dm(sinθsinθ0)Δfmdm(sinθsinθ0)c=Lm
    (10)

    where Lm is an integer, e.g. Lm = 0, ±1,···, m=1,2,···,M1 .

    The Eq. (10) can be rewritten as

    r=Lmc+f0dm(sinθsinθ0)Δfm+dm(sinθsinθ0)+r0
    (11)

    Since dm(sinθsinθ0)r0 , the term dm(sinθ sinθ0) in Eq. (8) can be neglected. The curves formed by Eq. (11) will be called as range-angle distribution curves throughout the paper. Then Eq. (11) can be approximately expressed as

    Δfm(rr0)f0dm(sinθsinθ0)=Lmc, m=1,2,···,M1
    (12)

    Rewrite Eq. (12) into matrix form as

    Ax=b
    (13)

    where A=[Δf1f0d1Δf2f0d2ΔfM1f0dM1] , x=[rr0sinθsinθ0] , b=[L1cL2cLM1c] , Lm = 0, ±1, ···, m=1,2,···, M – 1.

    To decouple the range and angle, the beam-pattern should have the unique maximum point in the range-angle distribution diagram, which means the Eq. (13) has the unique solution ( θ 0, r0). The necessary and sufficient condition of that the Eq. (13) has the unique solution is

    rank(A)=rank(˜A)=2
    (14)

    where rank (·) is the rank of a matrix, ˜A=(A,b) . When rank(A)=rank(˜A)=1 , the Eq. (13) has infinite solutions, corresponding to the conventional FDA condition, which will be discussed in detail later.

    To satisfy rank (A) = 2, dmPΔfm , P is a constant.

    To satisfy rank(A)=rank(˜A) , Lm=Qdm or Lm=SΔfm , Lm is an integer, and assume that Q, S are the minimum non-zero constants to satisfy the equations. Since dmPΔfm must be satisfied, the two equations cannot be hold at the same time but when Lm = 0, m=1,2,···, M–1.

    In the following, under the condition of dmPΔfm,Lm=0,±1 ,···, we make a summary with different parameter configurations:

    (1) when Lm = 0, the Eq. (13) has the unique solution ( θ 0, r0);

    (2) when Lm=Qdm0 , LmSΔfm , the Eq. (10) has the solutions (arcsin(sin(θ0) kQλ0),r0),λ0=cf0,k=0,±1,±2,··· . When |sin(θ0)kQλ0|1 , the angle grating lobes will occur at angle arcsin(sin(θ0)kQλ0) in the beampattern. Otherwise, the Eq. (13) has no solution, resulting in no angle grating lobes;

    (3) when Lm=SΔfm0,LmQdm , the Eq. (13) has the (θ0,r0+Skc) , k=0,±1,±2,··· , which means the range grating lobes will occur at r0+Skc in the beampattern.

    Note that in array theory, when the adjacent element spacing is less than half the wavelength, the angle grating lobes will never appear. If Qλ0=±1 and θ0=0 , where the element spacing is λ 0, then the grating lobes will occur at angle ±90°. But Lm=SΔfm can always be satisfied since Lm is an integer whose range is [,+] . The range grating lobes will always occur at range r0+Skc in the beampattern. The position of the range grating lobe changes with different S. For example, S = 0.01, the distance between the grating lobe and the mainlobe is 3000 km. So if r0±Sc is out of the illuminated range space [Rmin,Rmax] , the beampattern has a single-maximum point ( θ 0, r0) in the illuminated range space, which means the range and angle are decoupled.

    So we can conclude that the beampattern of the FDA is always range-periodic, the grating lobes will always occur at range r0+Skc , k=0,±1,±2,··· . To obtain the single-maximum beampattern in the illuminated range space [Rmin,Rmax] , the designing criteria for the FDA is dmPΔfm , and 2Sc>RmaxRmin , |sin(θ0)±Qλ0|>1 , k=0,±1,±2,··· , Lm=0,±1,··· , m=1,2,··· ,M – 1, P is a constant, Q, S are the minimum non-zero constants to satisfy the equations Lm= SΔfm0 and Lm=Qdm0 .

    Once the range and angle is decoupled, the target’s range and angle can be estimated directly by the FDA beamformer output. Also the 2-dementional MUSIC algorithm[16] for estimating the target’s range and angle can be used as well.

    For the conventional FDA, Δfm=mΔf , dm = md, Df and d are configurable parameters to control the frequency increment and the element spacing. When Lm = nm, n=0,±1,±2,··· , m=1,2,···,M1 , we can get rank(A)=rank (˜A)=1 . Under this circumstance, the Eq. (13) has infinite solutions. The solutions form the range-angle dependent curves, which have expressions as:

    r=f0dΔfsinθf0dsinθ0Δf+r0+ncΔf
    (15)

    In Eq. (15), the expression is no longer related to m, which means the range-angle curve for different element coincides with each other, as depicted in Fig. 2(a). In the range-angle distri-bution diagram, the curve is periodic in range, and the range difference between the adjacent curves is c/Df. The corresponding beampattern is depicted as Fig. 3(a).

    For the Expf-FDA, whose frequency incre-ment is exponentially increased, Δfm=(bm 1)Δf , dm = md. b is a configurable constant. The range solution rises when b gets larger. The range-angle distribution curves and the beampattern are depicted in Fig. 2(b) and Fig. 3(b), respectively.

    Likewise, for the Logd-FDA, whose element spacing is logarithmically increased, Δfm=mΔf , dm=log(m+1)d. When Lm = nm, n=0,±1, ±2,··· , m=1,2,···,M1 , we can get rank(A)= rank(˜A)=2 , so the range grating lobes will occur in the beampattern as depicted in Fig. 3(c), and the range difference between the grating lobe and the mainlobe is c/Df. The corresponding range-angle distribution diagram is depicted in Fig. 2(c).

    For another kind of FDA, called Expf-Logd-FDA, where the frequency increment is exponentially increased and the element spacing is logarithmically increased, Δfm=(bm1)Δf , dm=log(m+1)d . The range-angle distribution curves and beampattern are depicted in Fig. 2(d) and Fig. 3(d), respectively.

    Bampattern expressed in Eq. (9) and the range-angle distribution curves expressed in Eq. (11) were simulated and plotted for different kinds of FDA discussed in Section 2. The results are discussed and compared with the different kinds of FDA. The illuminated range space is (0 km, 800 km]. To generate these plots, the values of the configurable parameters have been taken as listed in Tab. 1. To avoid angle grating lobes, the parameter d is less than half the wavelength.

    Table  1.  Parameters for simulations
    Parameter Value Parameter Value
    Element number M 8 d 0.1 m
    Reference frequency f0 1 GHz b 1.4
    {\Delta}f 1 kHz Desired point
    ( \theta_0, r0)
    (0°, 400 km)
     | Show Table
    DownLoad: CSV

    The range-angle distribution curves are de-picted in Fig. 2. The curves with different color represent the range-angle distribution for different elements except the reference element in the FDA. It is easy to see that the range-angle distribution of the elements are the same in conventional FDA, and the range difference between the adjacent curves is c/Df = 300 km, which is consistent with the analysis in Section 2. For the Expf-FDA and Expf-Logd-FDA, Δfm =(1.4m1)Δf , the range between the first grating lobe and the mainlobe is 3e6 km, which is not in the illuminated space. So the curves of the elements in the range-angle distribution diagram have the single intersection point, which means that the beampattern has the single-maximum point in the illuminated range space. But for the Logd-FDA, when Lm = nm, the distance between the grating lobe and the mainlobe is c/Df = 300 km according to the analysis in Section 2. So in the range-angle distribution diagram, the curves have 3 intersection points, the range difference between adjacent intersection points is 300 km.

    The beampatterns are depicted in Fig. 3. Similar to the range-angle curve in Fig. 2, the beampattern of the conventional FDA is a range-angle-dependent beampattern. For the Expf-FDA and Expf-Logd-FDA, the beampatterns have a single-maximum point in the illuminated space corresponding to the single intersection point in the range-angle distribution diagram. For the Logd-FDA, the beampattern has 3 range grating lobes corresponding to the 3 intersection points in the range-angle distribution diagram. For the latter 3 FDAs, the contour of the beampattern is an ellipse, which is because the range-angle distribution curves are tightly distributed. The direction of the major axis of the ellipse is corresponding to the most tightness distribution direction of the range-angle distribution curves.

    Figure  2.  The range-angle distribution diagram for different element

    In the meanwhile, we analyze the range and angle solutions of different FDAs in Fig. 4. The Expf-FDA and the Exp-Logd-FDA have the same range solution, and the range solution of conventional FDA and Logd-FDA are the same. That is because the bandwidth across the whole array is the same for each pair. The same situation occurs for the angle solution, if the arrays have the same array aperture, they have the same angle solutions.

    Figure  4.  Range and angle section views of beampattern

    We choose the target position at (400 km, 20°), and the transmit beampattern is depicted in Fig. 5. Similar to Fig. 3, we can see that the single maximum beam is formed at the target position.

    Figure  5.  Range versus angle normalized beampattern (target position at (400 km, 20°))
    Figure  3.  Range versus angle normalized beampattern

    In this paper, we propose a basic criteria for the FDA configuration to provide a single-maximum beampattern in the illuminated space. The single-maximum beampattern can be generated by configuring the element spacing and frequency increment of the FDA. Through the analysis, we can find out that the beampattern of FDA is always range-periodic. Results show that a single-maximum beampattern can be generated with the corresponding criteria by choosing the proper frequency increment. As this paper describes the transmitter only, designing an appropriate receiver is our future work.

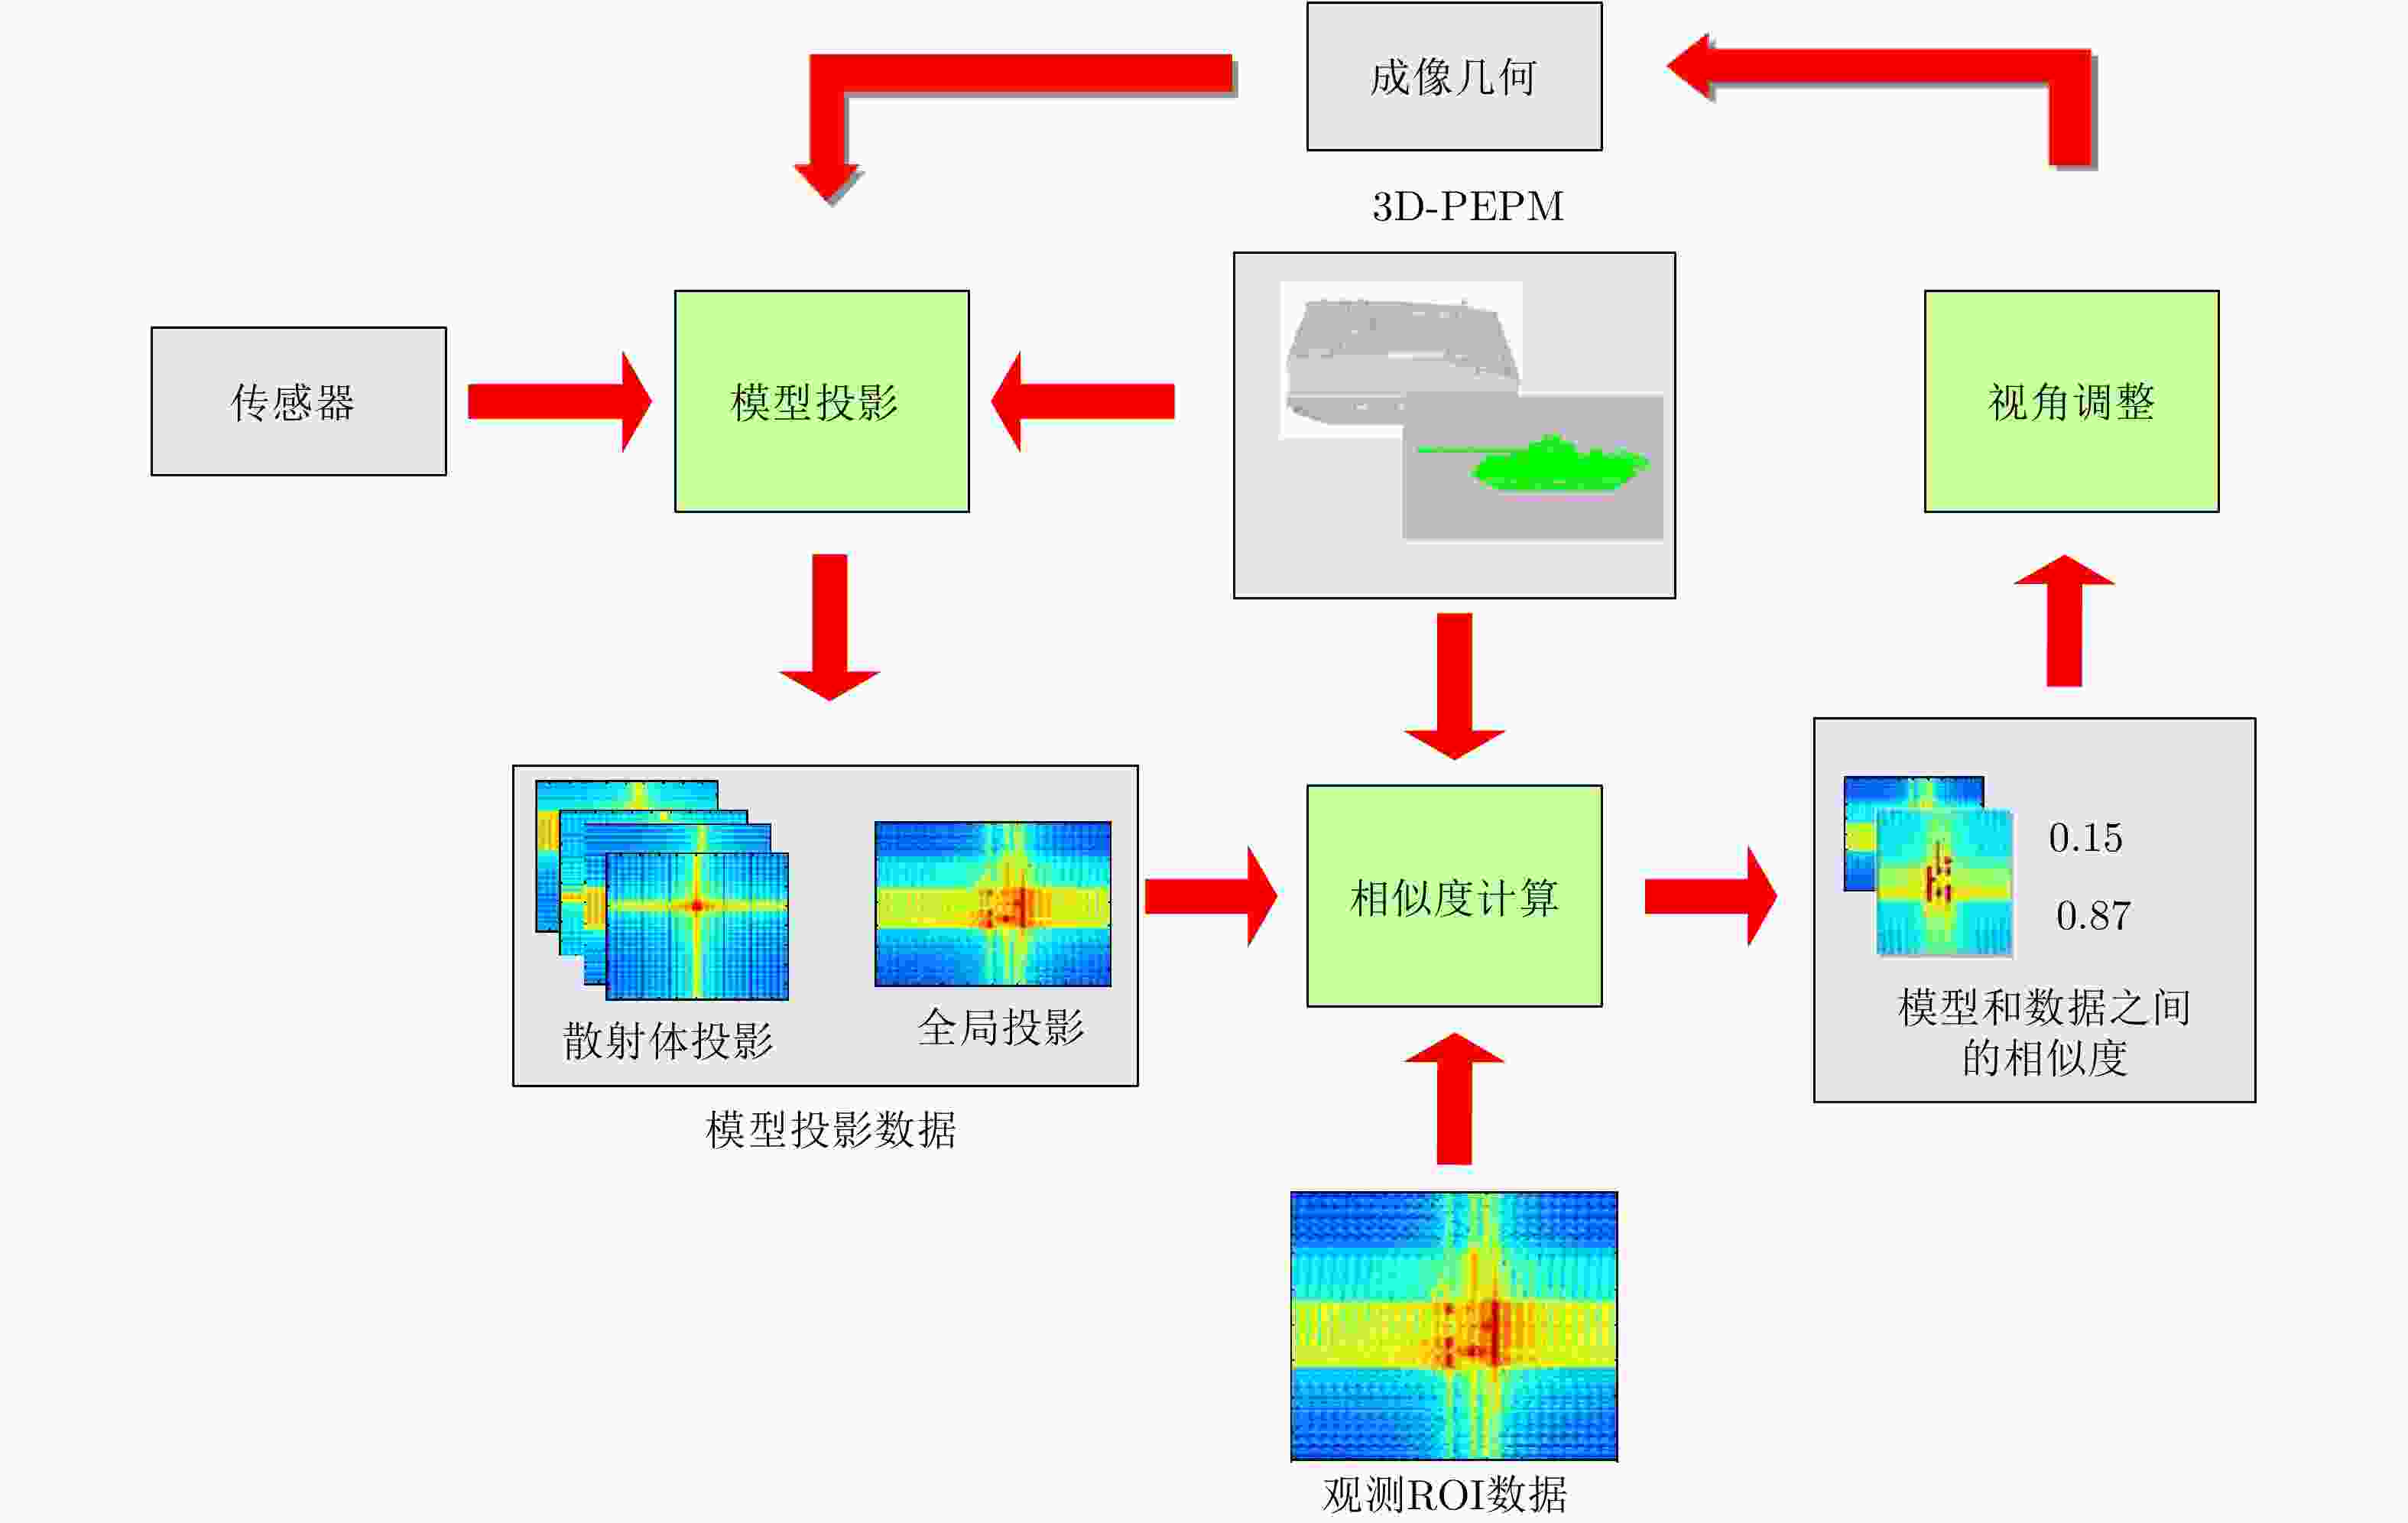
  • 图  1  基于3D-PEPM ATR框架的流程图

    Figure  1.  The flow chart based on 3D-PEPM ATR framework

    图  2  SAR成像几何

    Figure  2.  SAR imaging geometry

    图  3  几何和辐射校正阵列

    Figure  3.  Geometric and radiometric correction array

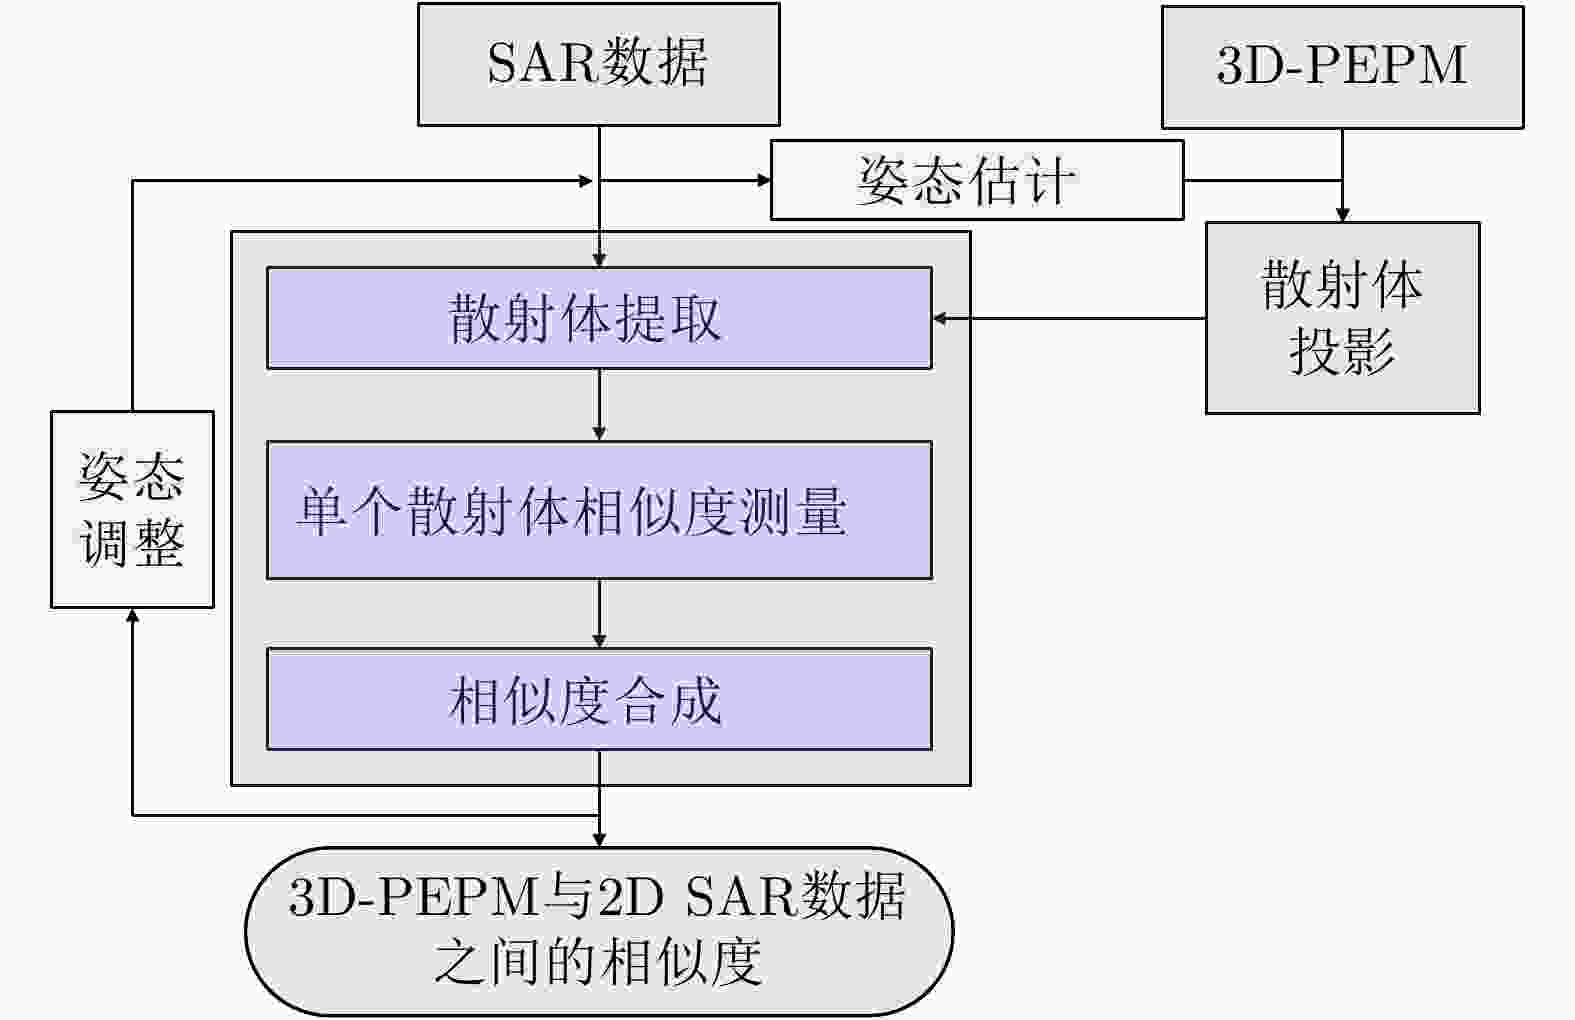
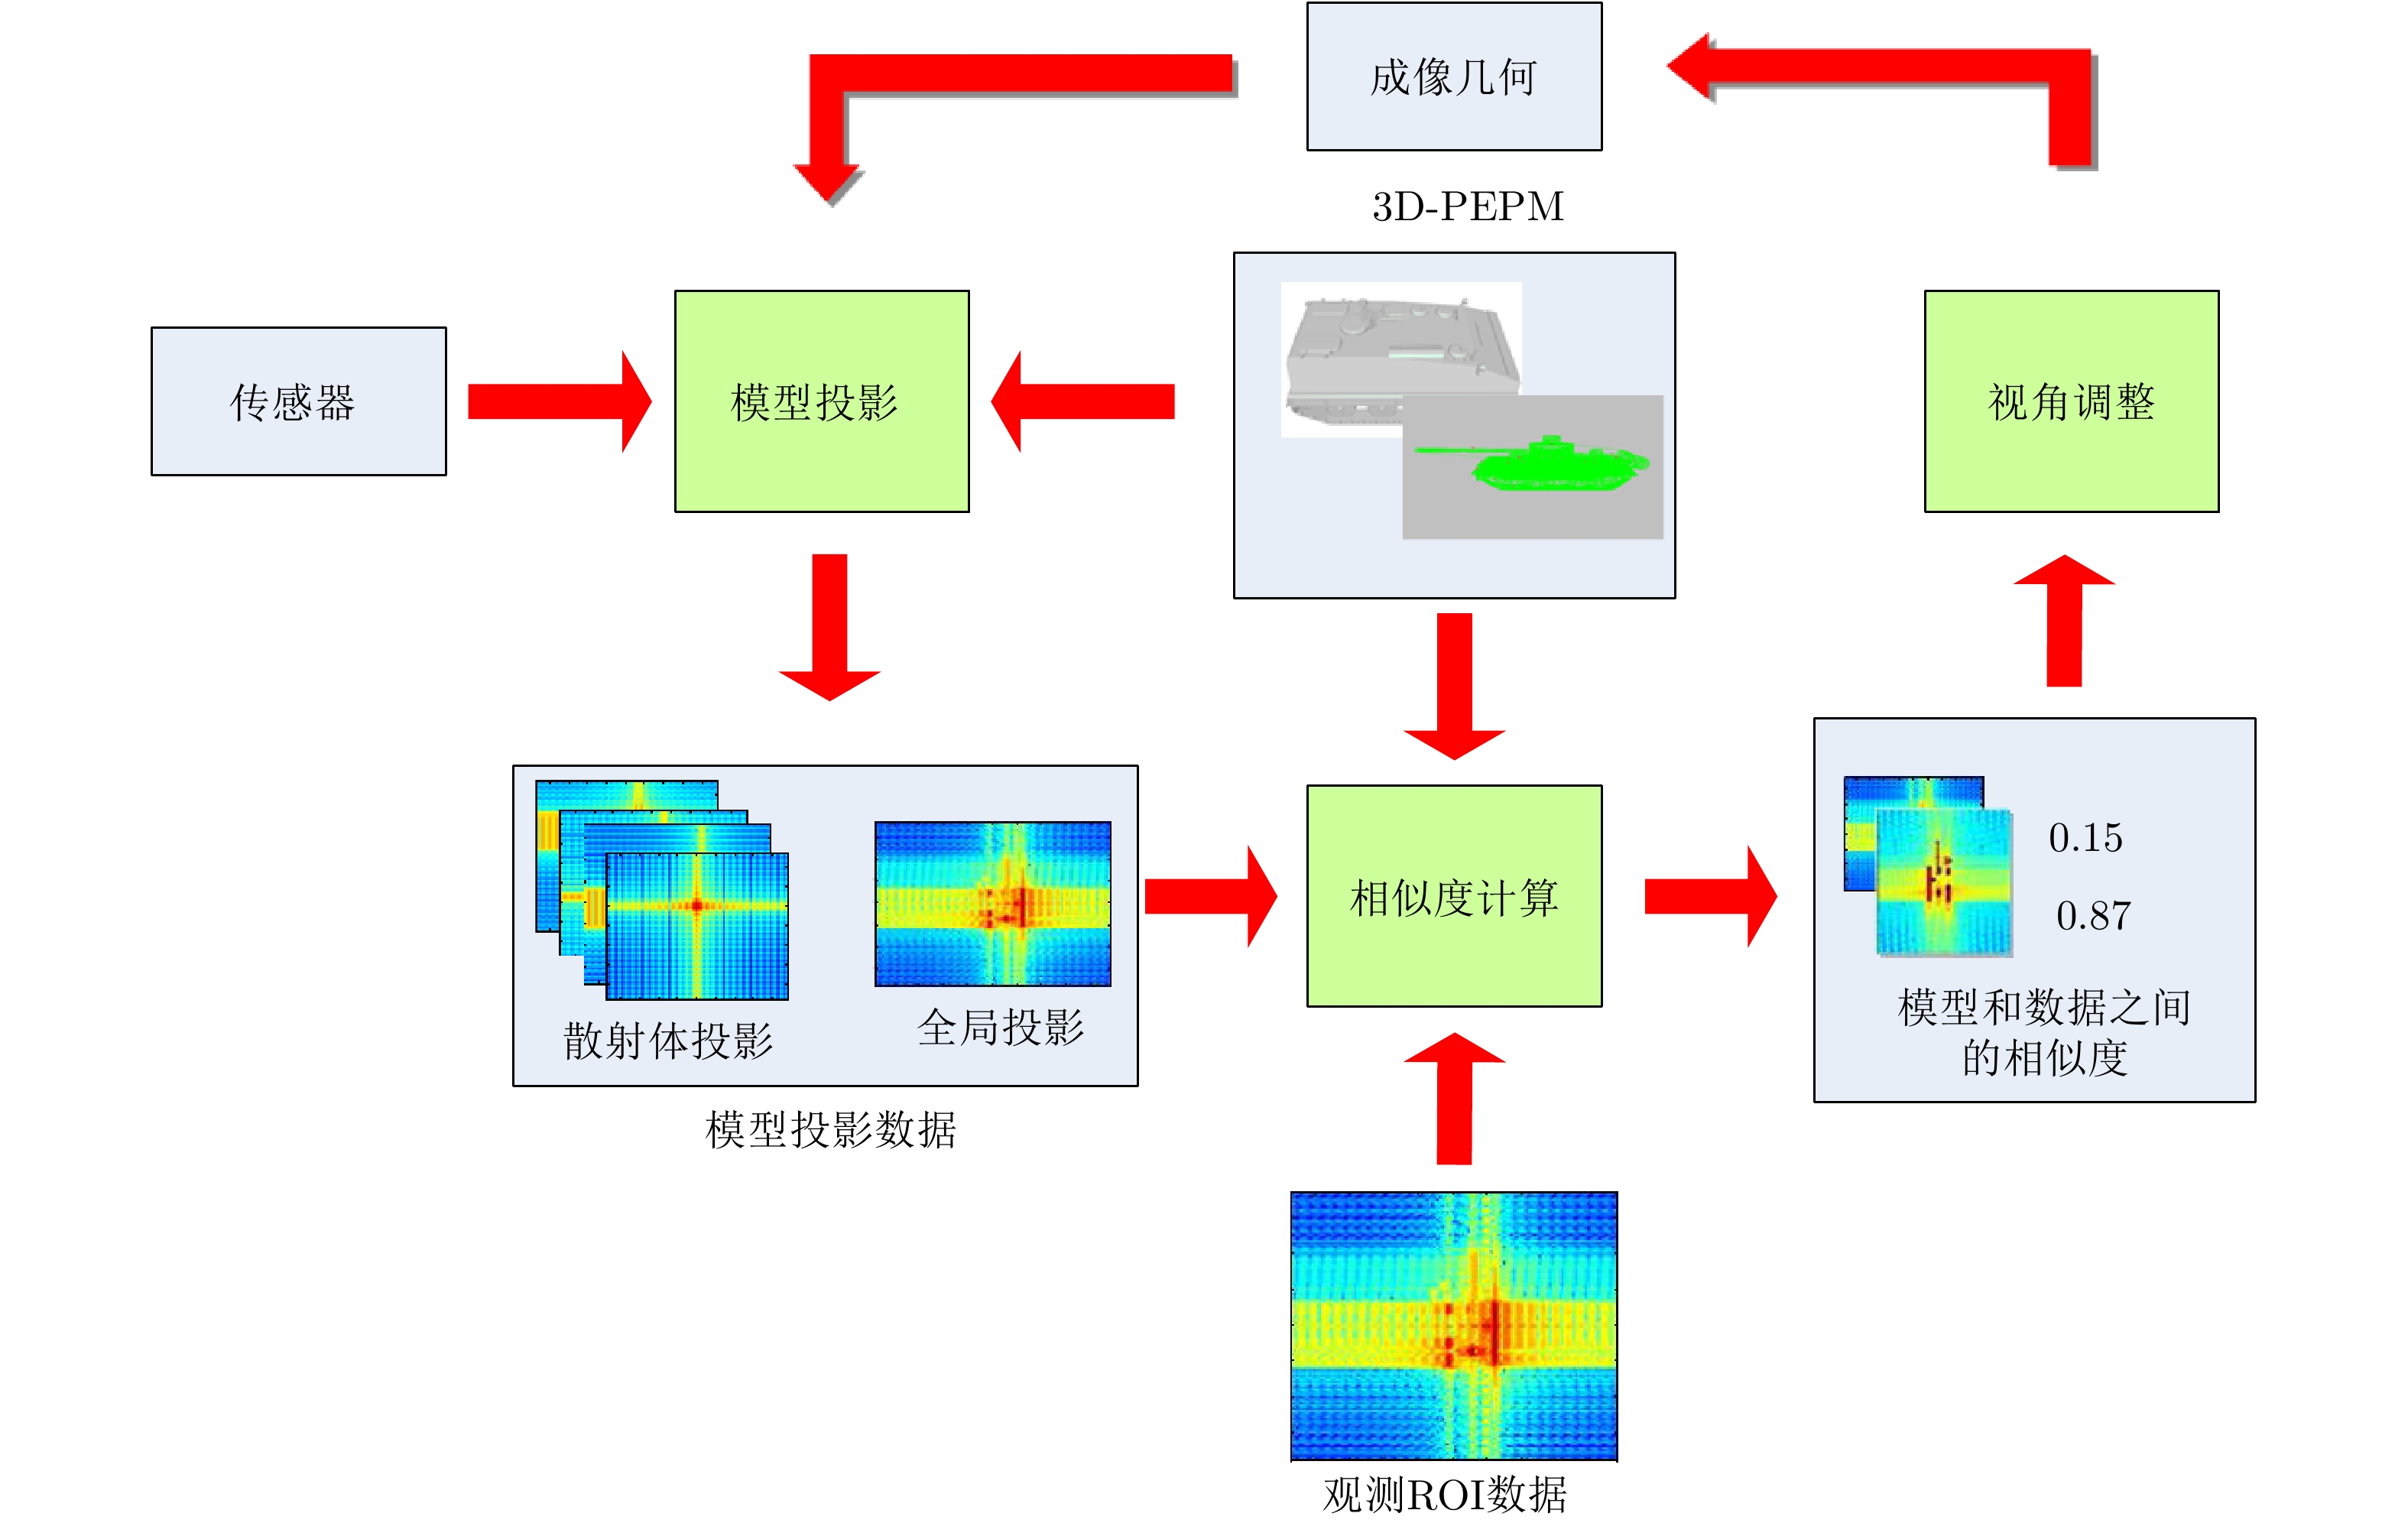
    图  4  相似度测量框架

    Figure  4.  Similarity measurement framework

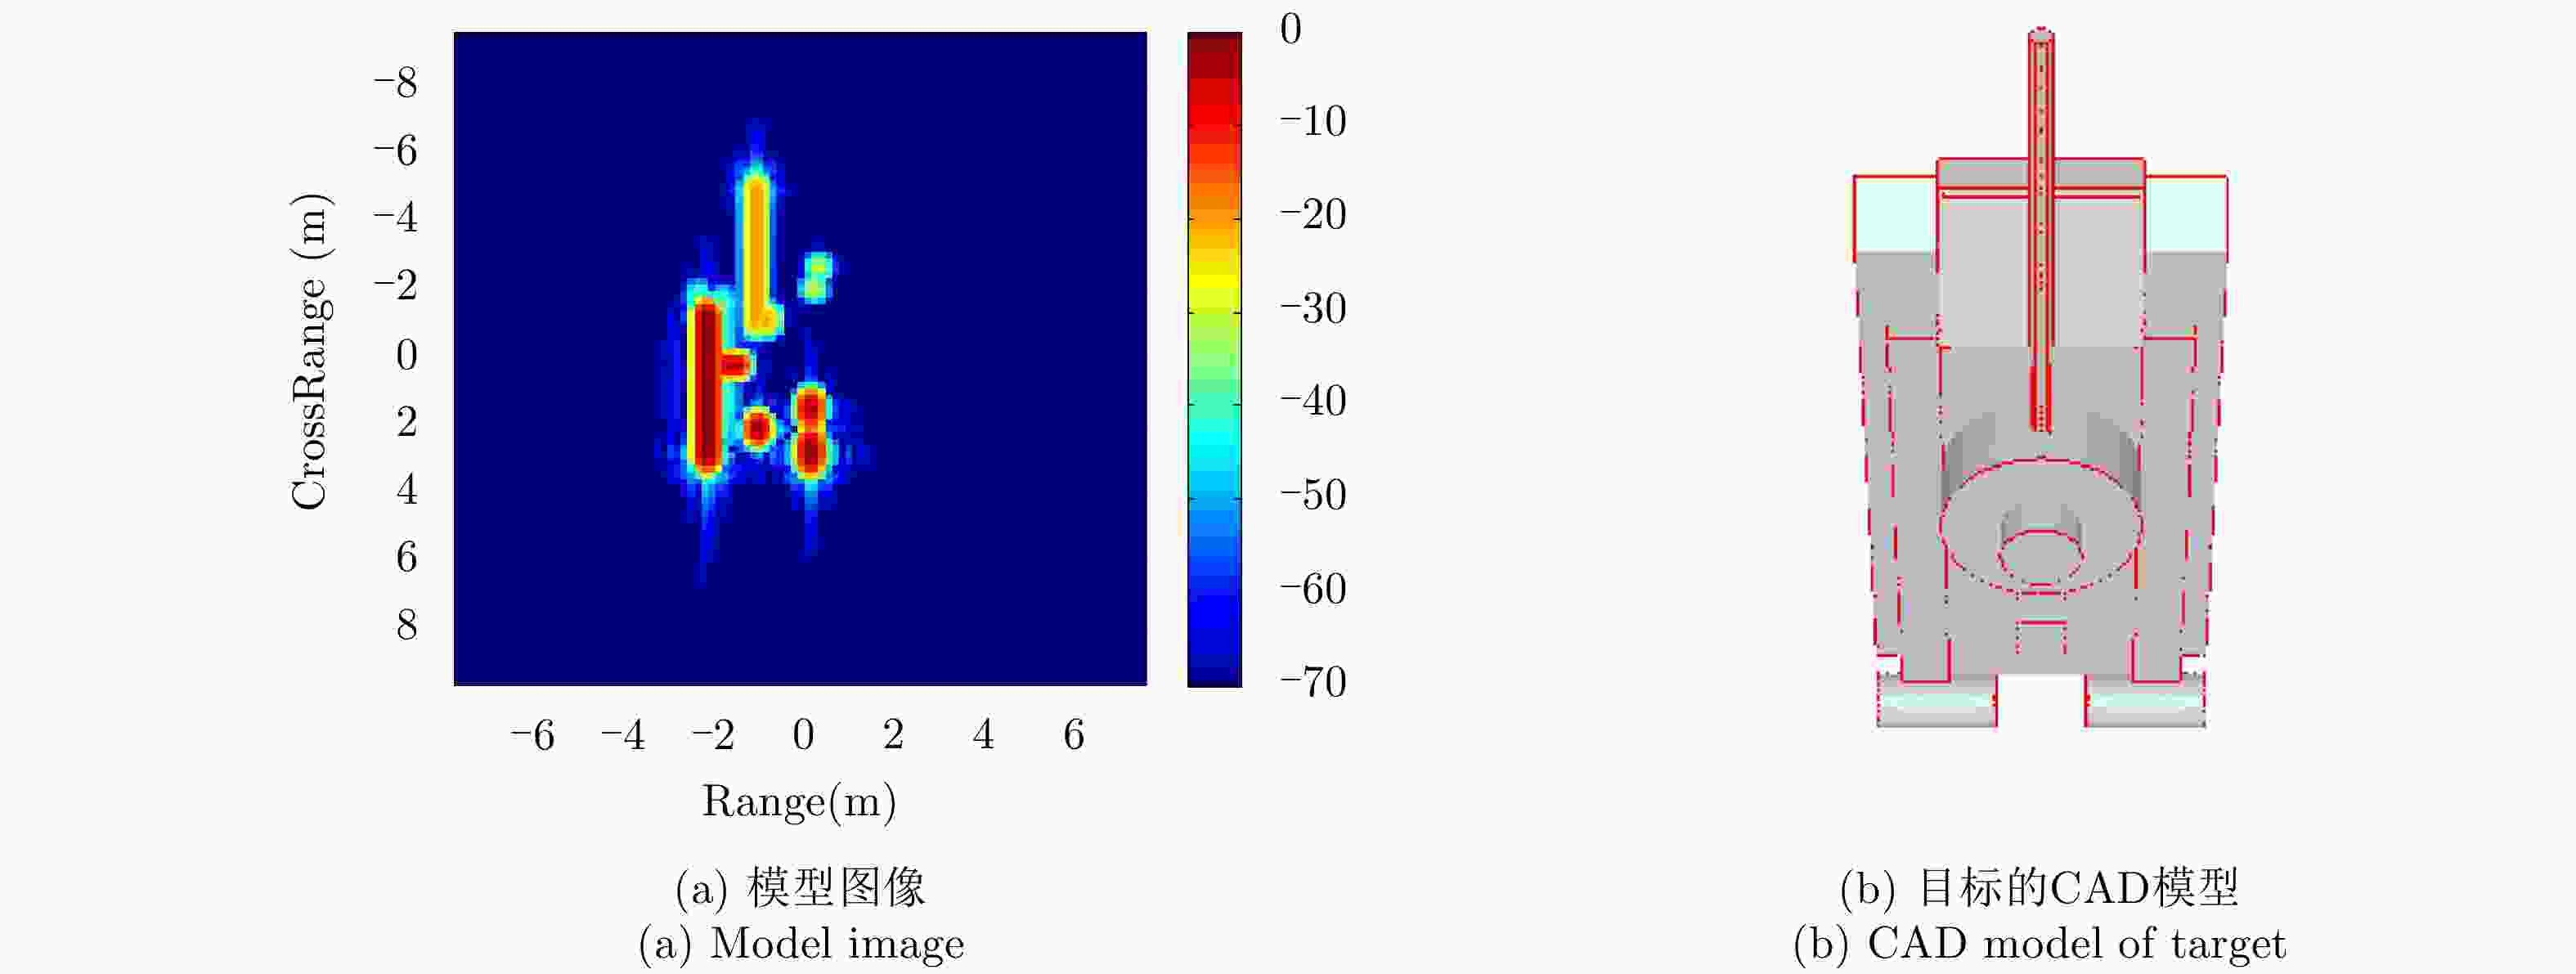
    图  5  简易坦克的CAD模型

    Figure  5.  CAD model of the simple tank

    图  6  简易坦克中的散射体

    Figure  6.  Scatterers in the simple tank

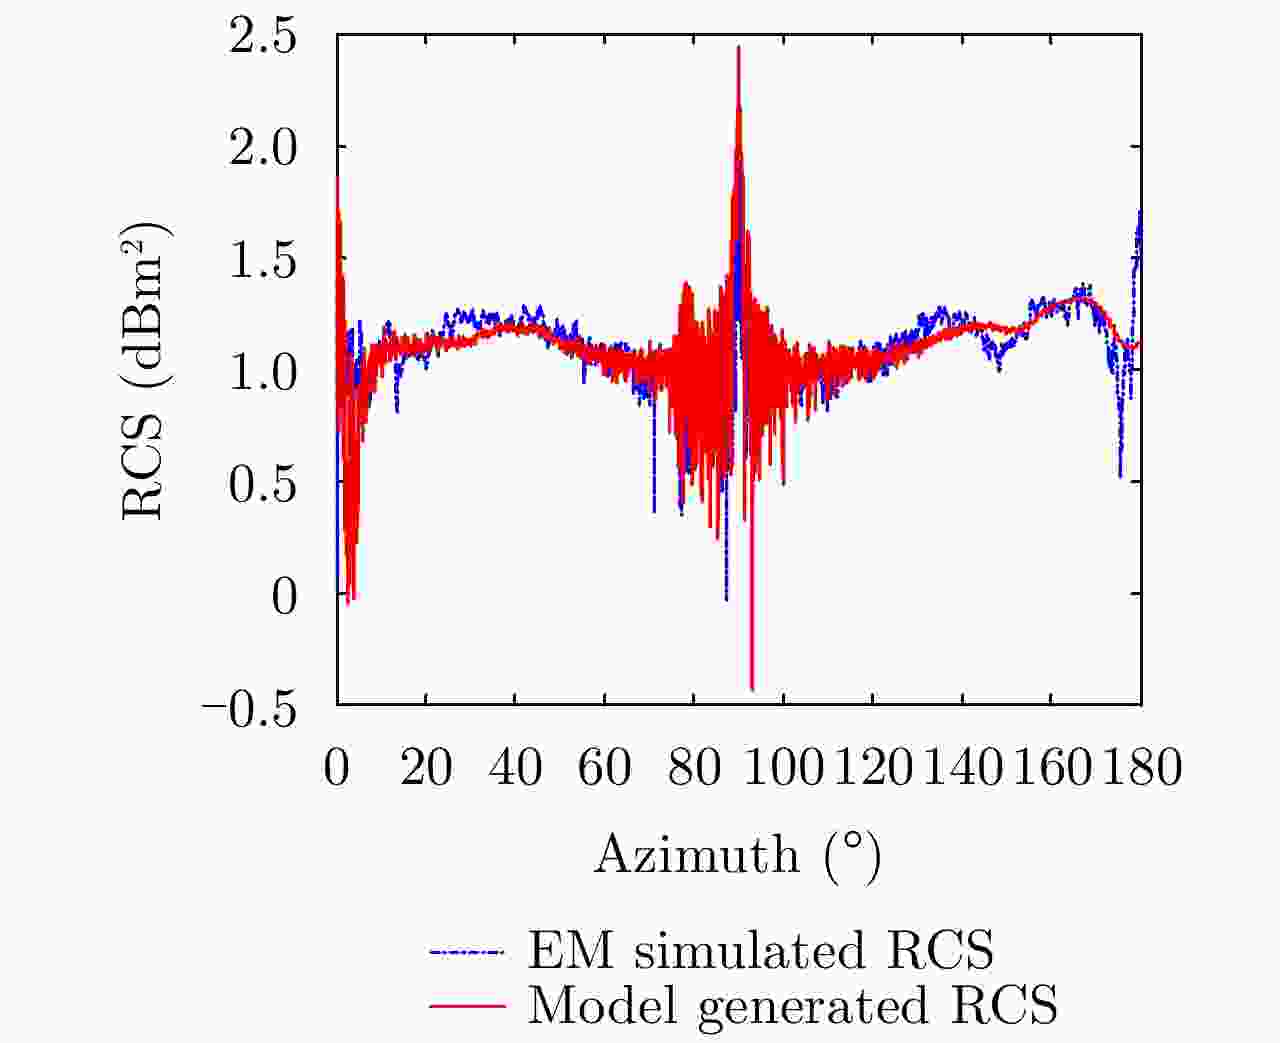
    图  7  模型和EM仿真软件产生的目标RCS对比

    Figure  7.  Comparison of target RCS generated by 3D-PEPM and EM simulation software

    图  8  不同视角下基于3D-PEPM生成的图像

    Figure  8.  Images generated from different perspectives based on 3D-PEPM

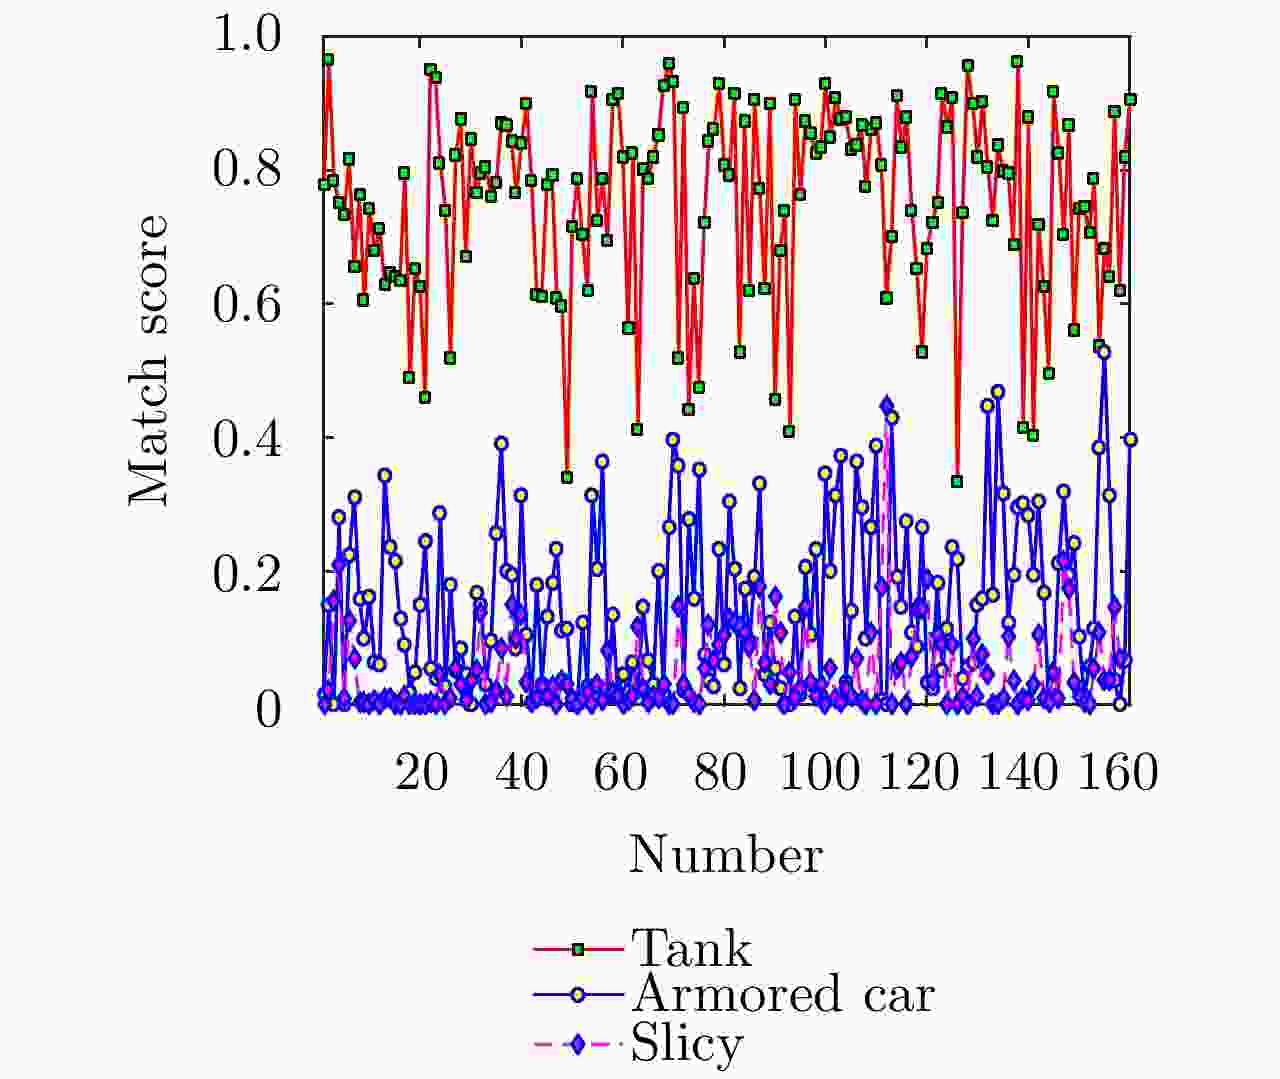
    图  9  相同视角下3个模型的观测图像

    Figure  9.  Observation images of three models in the same perspective

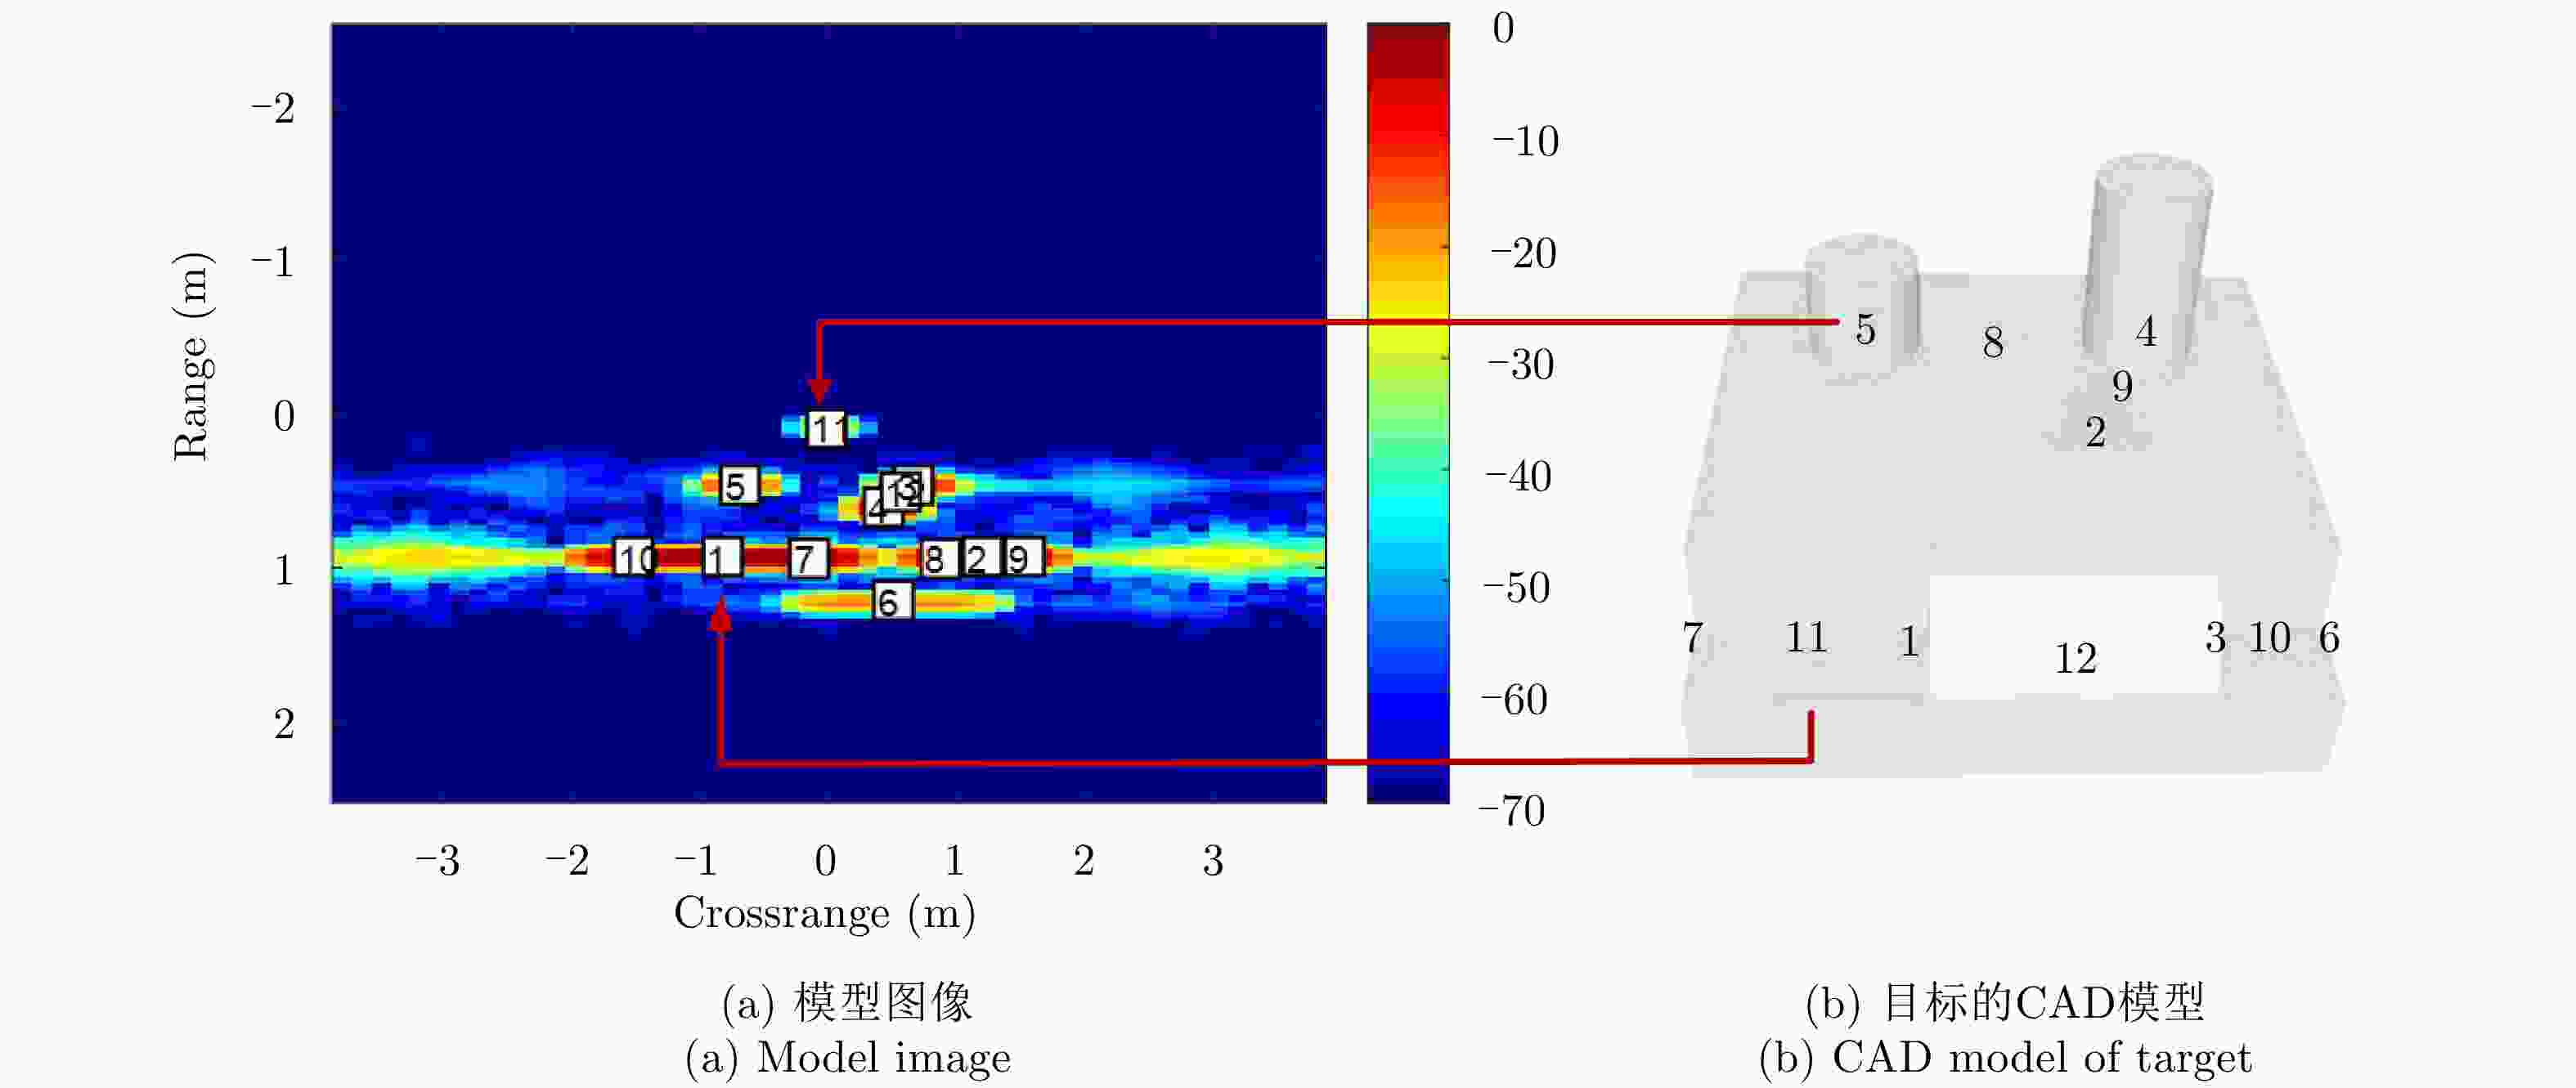
    图  10  模型图像和3D-PEPM物理相关的散射体

    Figure  10.  Model image and 3D-PEPM physically related scatterers

    图  11  模型图像和3D-PEPM物理相关的散射体

    Figure  11.  Model image and 3D-PEPM physically related scatterers

    图  12  相同视角下3个模型的观测图像

    Figure  12.  Observation images of three models in the same perspective

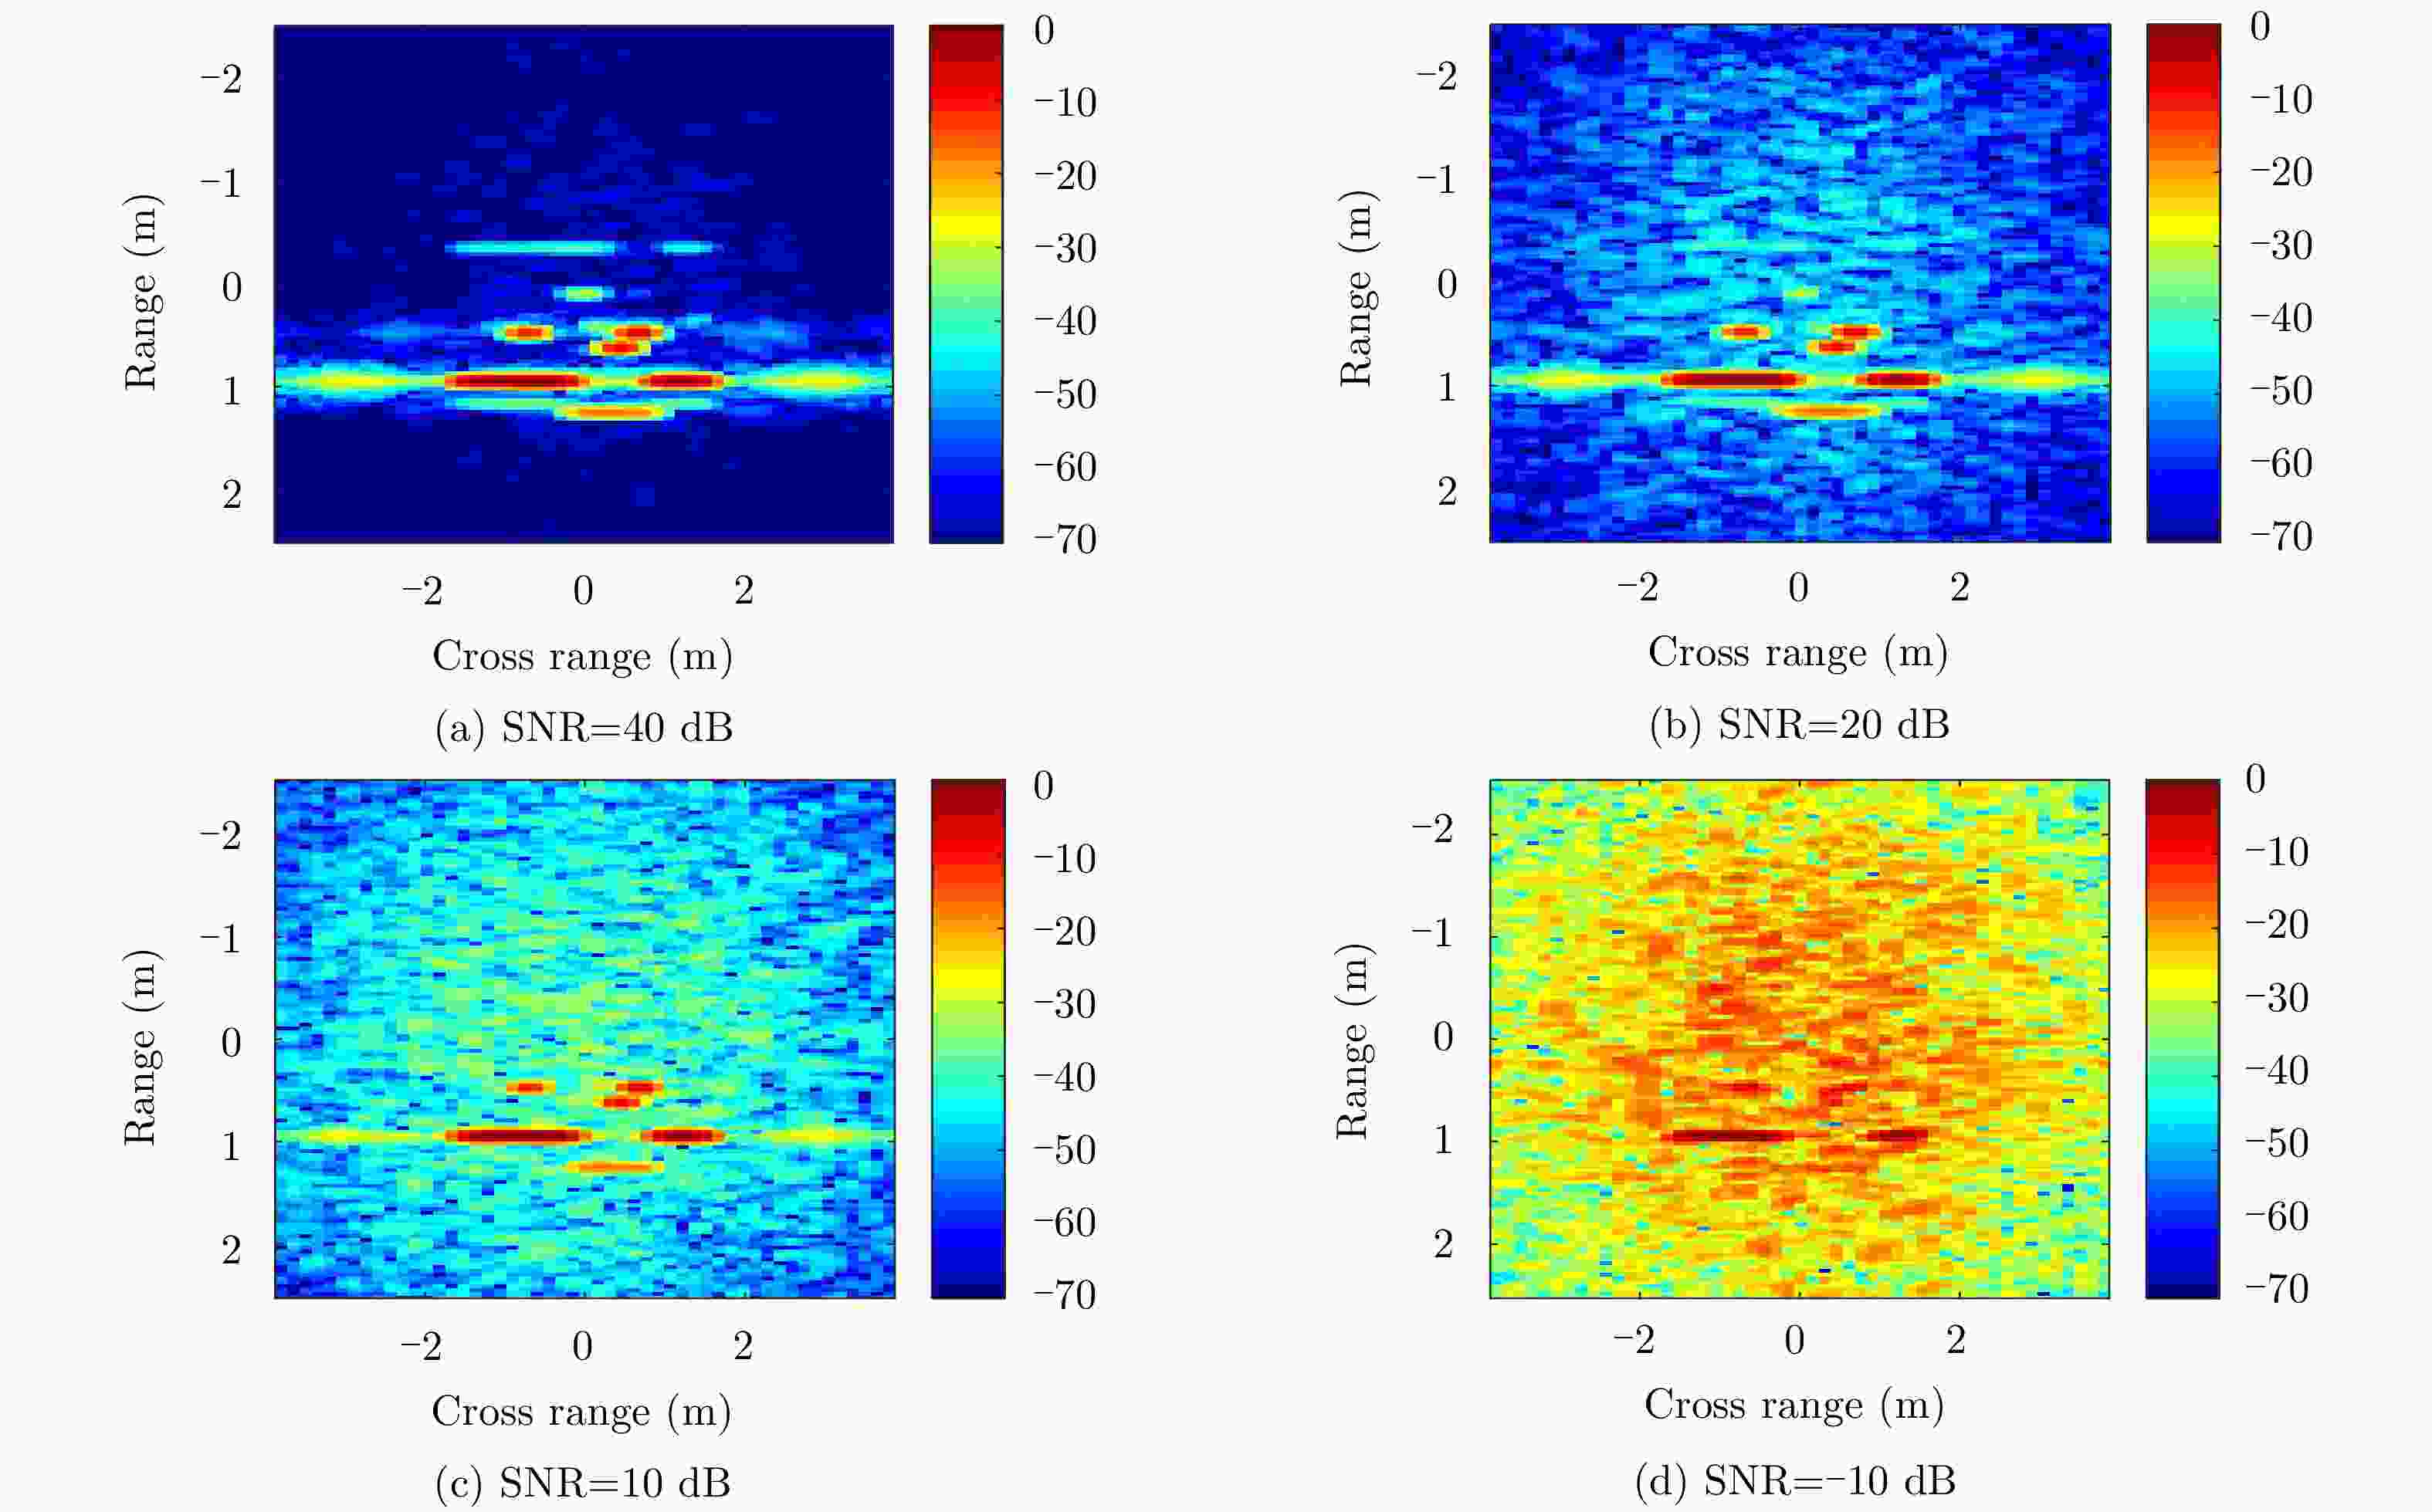
    图  13  Slicy目标在不同信噪比下的仿真图像

    Figure  13.  The simulated images of the slicy target under different SNR

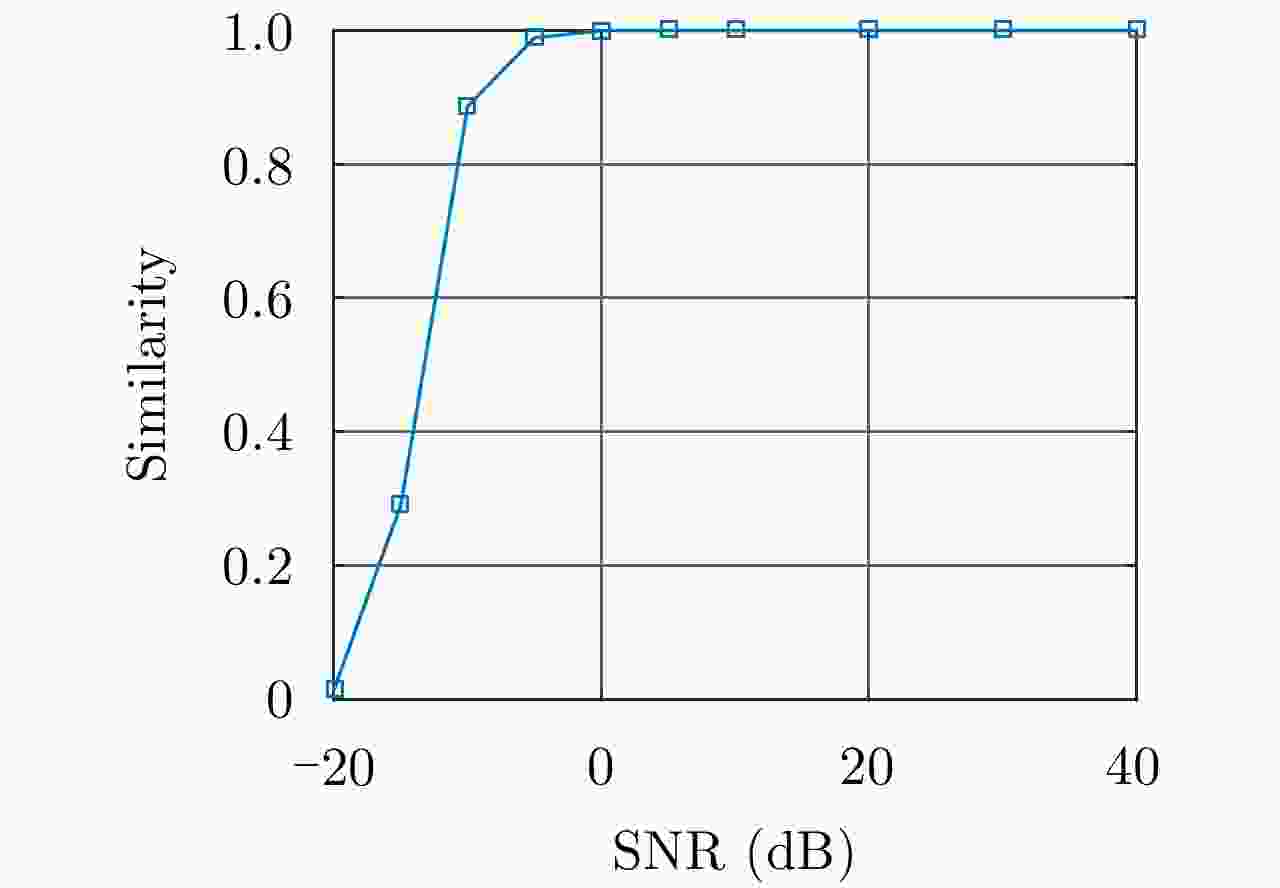
    图  14  不同噪声水平下的相似度

    Figure  14.  Similarity under different noise levels

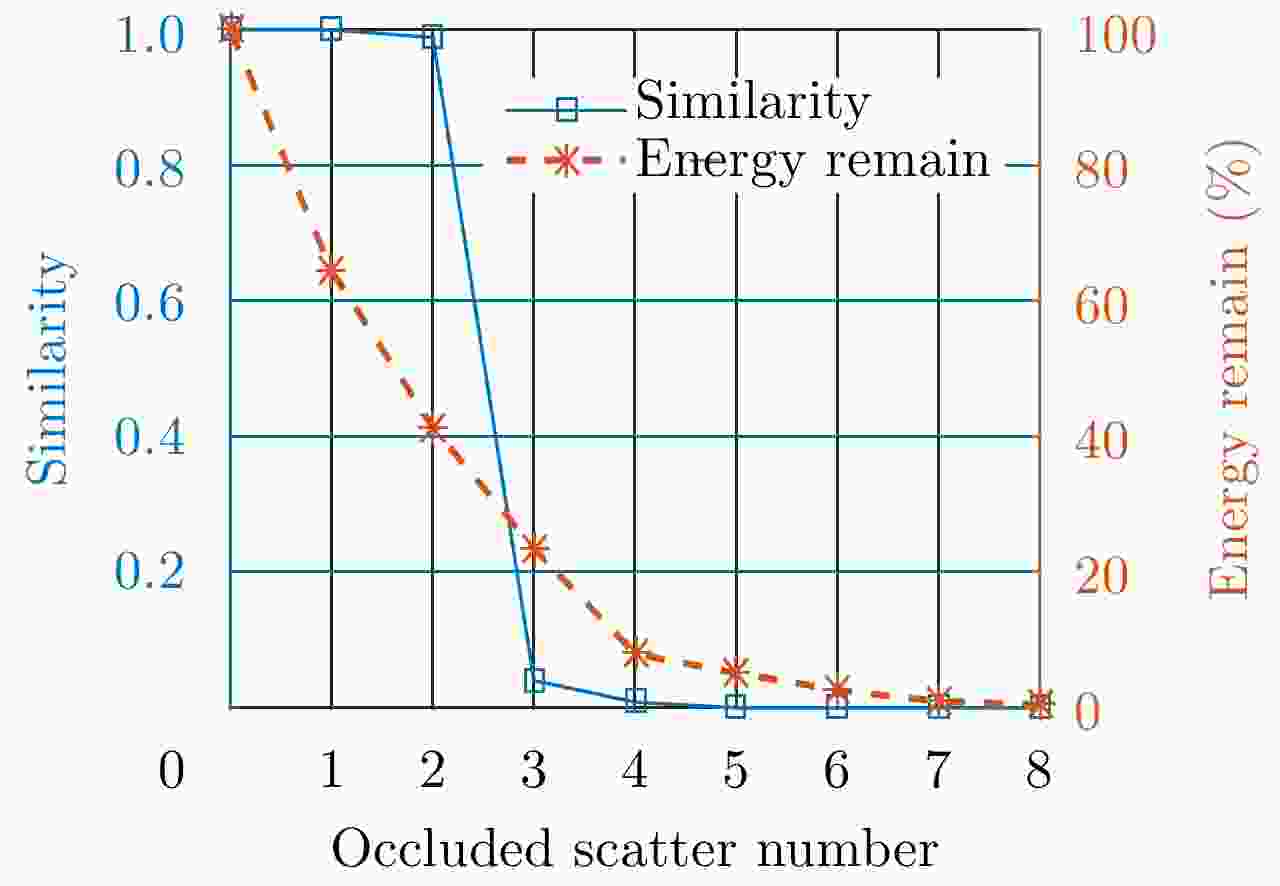
    图  15  散射体遮挡下的相似度测量性能

    Figure  15.  Performance of similarity measurement under scatterer occlusion

    表  1  参数的统计模型

    Table  1.   Statistical model of parameters

    特征属性均值方差
    距离向位置xx0σ2x=f2Downrange
    方位向位置yy0σ2y=f2Crossrange
    幅度log10(|A|)lg(|A|0)σ2A=0.5
    长度LL0σ2L=(2fCrossrange)2
    下载: 导出CSV

    表  2  模型投影和从数据估计得到的散射体参数的对比

    Table  2.   Comparison between model projection and scatterer parameters estimated from data

    序号模型投影得到的散射体参数从数据估计得到的散射体参数相似度
    X(m)Y(m)L(m)AX(m)Y(m)L(m)A
    1–1.9320.5674.4161.000–1.9320.4874.2651.0000.643
    2–0.9011.7720.6490.532–0.9001.7800 0.1930.254
    30.1811.2120.7080.4580.1821.2100.6950.0950.902
    40.1812.4001.0570.3280.1832.3940.8680.1140.705
    50.181–1.1260.6680.0910.178–1.1680.6330.0480.841
    6–1.601000.067–1.730–0.00100.0760.664
    7–1.068–3.0314.3770.052–0.929–2.8794.2760.0440.351
    8–0.772–1.2640.6470.010–0.770–1.2620.6970.0180.922
    9–1.431000.008–1.548–0.00200.0450.689
    100.338–2.5980.3250.0060.340–2.32400.0010.227
    下载: 导出CSV
  • [1] EL-DARYMLI K, GILL E W, MCGUIRE P, et al. Automatic target recognition in synthetic aperture radar imagery: A state-of-the-art review[J]. IEEE Access, 2016, 4: 6014–6058. doi: 10.1109/ACCESS.2016.2611492
    [2] NOVAK L M, OWIRKA G J, BROWER W S, et al. The automatic target-recognition system in SAIP[J]. The Lincoln Laboratory Journal, 1997, 10(2): 187–202.
    [3] PARK J I, PARK S H, and KIM K T. New discrimination features for SAR automatic target recognition[J]. IEEE Geoscience and Remote Sensing Letters, 2013, 10(3): 476–480. doi: 10.1109/LGRS.2012.2210385
    [4] NICOLI L P and ANAGNOSTOPOULOS G C. Shape-based recognition of targets in synthetic aperture radar images using elliptical Fourier descriptors[C]. SPIE 6967, Automatic Target Recognition XVIII, Orlando, USA, 2008.
    [5] MISHRA A K. Validation of PCA and LDA for SAR ATR[C]. The TENCON 2008 - 2008 IEEE Region 10 Conference, Hyderabad, India, 2008: 1–6.
    [6] 宦若虹, 杨汝良. 基于小波域NMF特征提取的SAR图像目标识别方法[J]. 电子与信息学报, 2009, 31(3): 588–591. doi: 10.3724/SP.J.1146.2007.01808

    HUAN Ruohong and YANG Ruliang. Synthetic aperture radar images target recognition based on wavelet domain NMF feature extraction[J]. Journal of Electronics &Information Technology, 2009, 31(3): 588–591. doi: 10.3724/SP.J.1146.2007.01808
    [7] DONG Ganggang and KUANG Gangyao. Classification on the monogenic scale space: Application to target recognition in SAR image[J]. IEEE Transactions on Image Processing, 2015, 24(8): 2527–2539. doi: 10.1109/TIP.2015.2421440
    [8] POTTER L C and MOSES R L. Attributed scattering centers for SAR ATR[J]. IEEE Transactions on Image Processing, 1997, 6(1): 79–91. doi: 10.1109/83.552098
    [9] MOSES P L, POTTER L C, and GUPTA I J. Feature extraction using attributed scattering center models for model-based automatic target recognition (ATR)[R]. AFRL-SN-WP-TR-2006-1004, 2005.
    [10] LIU Xian, HUANG Yulin, PEI Jifang, et al. Sample discriminant analysis for SAR ATR[J]. IEEE Geoscience and Remote Sensing Letters, 2014, 11(12): 2120–2124. doi: 10.1109/LGRS.2014.2321164
    [11] HUANG Yulin, PEI Jifang, YANG Jianyu, et al. Neighborhood geometric center scaling embedding for SAR ATR[J]. IEEE Transactions on Aerospace and Electronic Systems, 2014, 50(1): 180–192. doi: 10.1109/TAES.2013.110769
    [12] DING Jun, CHEN Bo, LIU Hongwei, et al. Convolutional neural network with data augmentation for SAR target recognition[J]. IEEE Geoscience and Remote Sensing Letters, 2016, 13(3): 364–368.
    [13] CHEN Sizhe, WANG Haipeng, XU Feng, et al. Target classification using the deep convolutional networks for SAR images[J]. IEEE Transactions on Geoscience and Remote Sensing, 2016, 54(8): 4806–4817. doi: 10.1109/TGRS.2016.2551720
    [14] ROSS T D, BRADLEY J J, HUDSON L J, et al. SAR ATR: So what’s the problem? An MSTAR perspective[C]. SPIE 3721, Algorithms for Synthetic Aperture Radar Imagery VI, Orlando, USA, 1999: 606–610.
    [15] KEYDEL E R, LEE S W, and MOORE J T. MSTAR extended operating conditions: A tutorial[C]. SPIE 2757, Algorithms for Synthetic Aperture Radar Imagery III, Orlando, USA, 1996: 228–242.
    [16] JONES III G and BHANU B. Recognition of articulated and occluded objects[J]. IEEE Transactions on Pattern Analysis and Machine Intelligence, 1999, 21(7): 603–613. doi: 10.1109/34.777371
    [17] DIEMUNSCH J R and WISSINGER J. Moving and stationary target acquisition and recognition (MSTAR) model-based automatic target recognition: Search technology for a robust ATR[C]. SPIE 3370, Algorithms for Synthetic Aperture Radar Imagery V, Orlando, USA, 1998: 481–492.
    [18] HUANG Peikang, YIN Hongcheng, and XU Xiaojian. Radar Target Characteristics[M]. Beijing: Publishing House of Electronics Industry, 2006.
    [19] CHIANG H C, MOSES R L, and POTTER L C. Model-based Bayesian feature matching with application to synthetic aperture radar target recognition[J]. Pattern Recognition, 2001, 34(8): 1539–1553. doi: 10.1016/S0031-3203(00)00089-3
    [20] ZHOU Jianxiong, SHI Zhiguang, XIAO Cheng, et al. Automatic target recognition of SAR images based on global scattering center model[J]. IEEE Transactions on Geoscience and Remote Sensing, 2011, 49(10): 3713–3729. doi: 10.1109/TGRS.2011.2162526
    [21] JACKSON J A. Three-dimensional feature models for synthetic aperture radar and experiments in feature extraction[D]. [Ph. D. dissertation], Ohio State University, 2009.
    [22] 文贡坚, 朱国强, 殷红成, 等. 基于三维电磁散射参数化模型的SAR目标识别方法[J]. 雷达学报, 2017, 6(2): 115–135. doi: 10.12000/JR17034

    WEN Gongjian, ZHU Guoqiang, YIN Hongcheng, et al. SAR ATR based on 3D parametric electromagnetic scattering model[J]. Journal of Radars, 2017, 6(2): 115–135. doi: 10.12000/JR17034
    [23] GIUSTI E, MARTORELLA M, and CAPRIA A. Polarimetrically-persistent-scatterer-based automatic target recognition[J]. IEEE Transactions on Geoscience and Remote Sensing, 2011, 49(11): 4588–4599. doi: 10.1109/TGRS.2011.2164804
    [24] TANG Tao and SU Yi. Object recognition based on feature matching of scattering centers in SAR imagery[C]. The 5th International Congress on Image and Signal Processing, Chongqing, China, 2012: 1073–1076.
    [25] MARTORELLA M, GIUSTI E, DEMI L, et al. Target recognition by means of polarimetric ISAR images[J]. IEEE Transactions on Aerospace and Electronic Systems, 2011, 47(1): 225–239. doi: 10.1109/TAES.2011.5705672
    [26] SAVILLE M A, SAINI D K, and SMITH J. Commercial vehicle classification from spectrum parted linked image test-attributed synthetic aperture radar imagery[J]. IET Radar, Sonar & Navigation, 2016, 10(3): 569–576.
    [27] RICHARDS J A. Target model generation from multiple synthetic aperture radar image[D]. [Ph. D. dissertation], 1996, MIT.
    [28] HE Yang, HE Siyuan, ZHANG Yunhua, et al. A forward approach to establish parametric scattering center models for known complex radar targets applied to SAR ATR[J]. IEEE Transactions on Antennas and Propagation, 2014, 62(12): 6192–6205. doi: 10.1109/TAP.2014.2360700
    [29] ZHOU Jianxiong, SHI Zhiguang, and FU Qiang. Three-dimensional scattering center extraction based on wide aperture data at a single elevation[J]. IEEE Transactions on Geoscience and Remote Sensing, 2015, 53(3): 1638–1655. doi: 10.1109/TGRS.2014.2346509
    [30] VOICU L I, PATTON R, and MYLER H R. Multicriterion vehicle pose estimation for SAR ATR[C]. SPIE 3721, Algorithms for Synthetic Aperture Radar Imagery VI, Orlando, USA, 1999: 3721.
    [31] CUI Xunxue, ZHANG Jichun, and ZHOU Pucheng. Hypothesis testing for target detection model in sensor networks[C]. The 7th International Conference on Fuzzy Systems and Knowledge Discovery, Yantai, China, 2010.
    [32] BOSE R. Lean CLEAN: Deconvolution algorithm for radar imaging of contiguous targets[J]. IEEE Transactions on Aerospace and Electronic Systems, 2011, 47(3): 2190–2199. doi: 10.1109/TAES.2011.5937291
    [33] SHAFER G. A Mathematical Theory of Evidence[M]. Princeton: Princeton University Press, 1976.
    [34] FELZENSZWALB P F, GIRSHICK R B, MCALLESTER D, et al. Object detection with discriminatively trained part-based models[J]. IEEE Transactions on Pattern Analysis and Machine Intelligence, 2010, 32(9): 1627–1645. doi: 10.1109/TPAMI.2009.167
  • 期刊类型引用(7)

    1. 黄钟泠,吴冲,姚西文,王立鹏,韩军伟. 基于时频分析的SAR目标微波视觉特性智能感知方法与应用. 雷达学报. 2024(02): 331-344 . 本站查看
    2. 丁柏圆,周春雨. 结合三维电磁散射模型和深度学习的SAR目标识别框架设计. 航天电子对抗. 2024(02): 34-38+64 . 百度学术
    3. 张旭,徐丰,金亚秋. 典型几何基元的高频散射建模方法梳理. 雷达学报. 2022(01): 126-143 . 本站查看
    4. 顾丹丹,廖意,王晓冰. 雷达目标特性知识引导的智能识别技术进展与思考. 制导与引信. 2022(04): 57-64 . 百度学术
    5. 邢孟道,谢意远,高悦欣,张金松,刘嘉铭,吴之鑫. 电磁散射特征提取与成像识别算法综述. 雷达学报. 2022(06): 921-942 . 本站查看
    6. 陆金文,闫华,殷红成,张磊,董纯柱. 用于三维散射中心SBR建模的边缘绕射修正. 西安电子科技大学学报. 2021(02): 117-124+189 . 百度学术
    7. 陆金文,闫华,张磊,殷红成. 基于弹跳射线技术的三维GTD模型构建方法. 系统工程与电子技术. 2021(08): 2028-2036 . 百度学术

    其他类型引用(4)

  • 加载中
图(15) / 表(2)
计量
  • 文章访问数: 2625
  • HTML全文浏览量: 1100
  • PDF下载量: 226
  • 被引次数: 11
出版历程
  • 收稿日期:  2020-07-08
  • 修回日期:  2020-08-19
  • 网络出版日期:  2020-08-28

目录

/

返回文章
返回