
 作者中心
作者中心 专家审稿
专家审稿 责编办公
责编办公 编辑办公
编辑办公
Multi-feature Combination Track-to-track Association Based on Histogram Statistics Feature
-
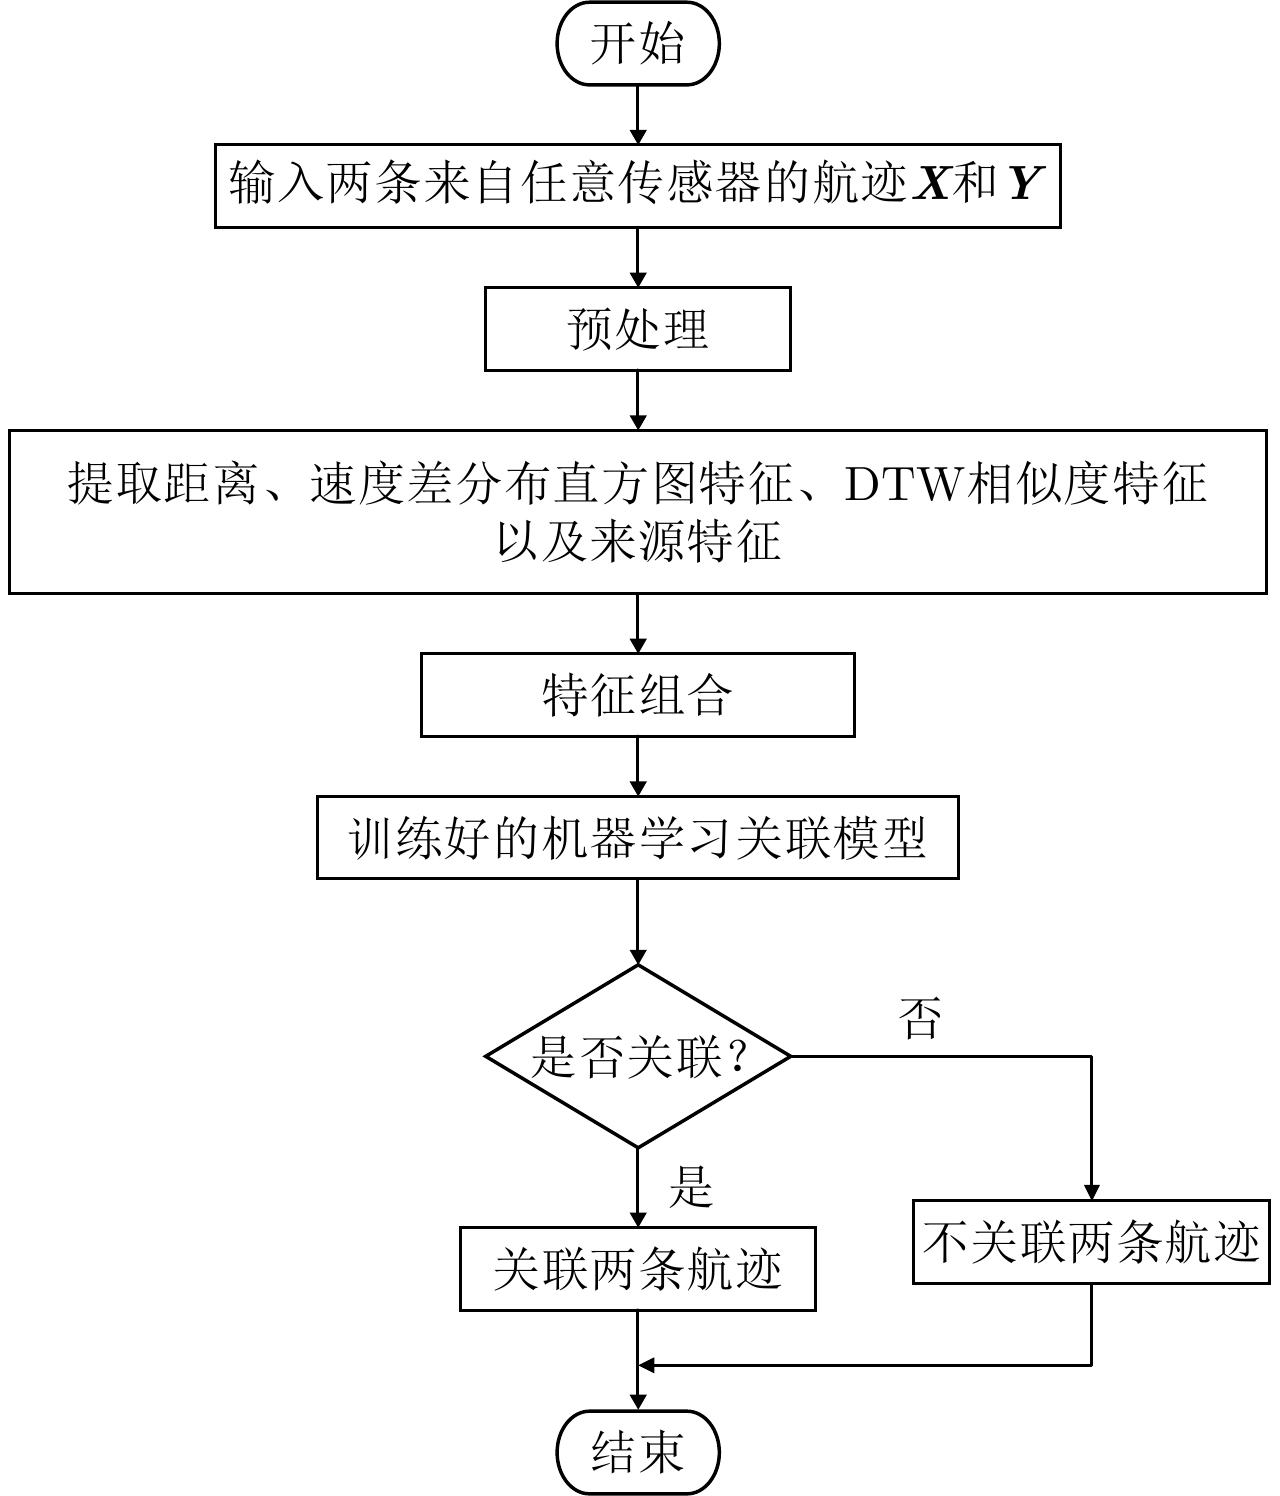
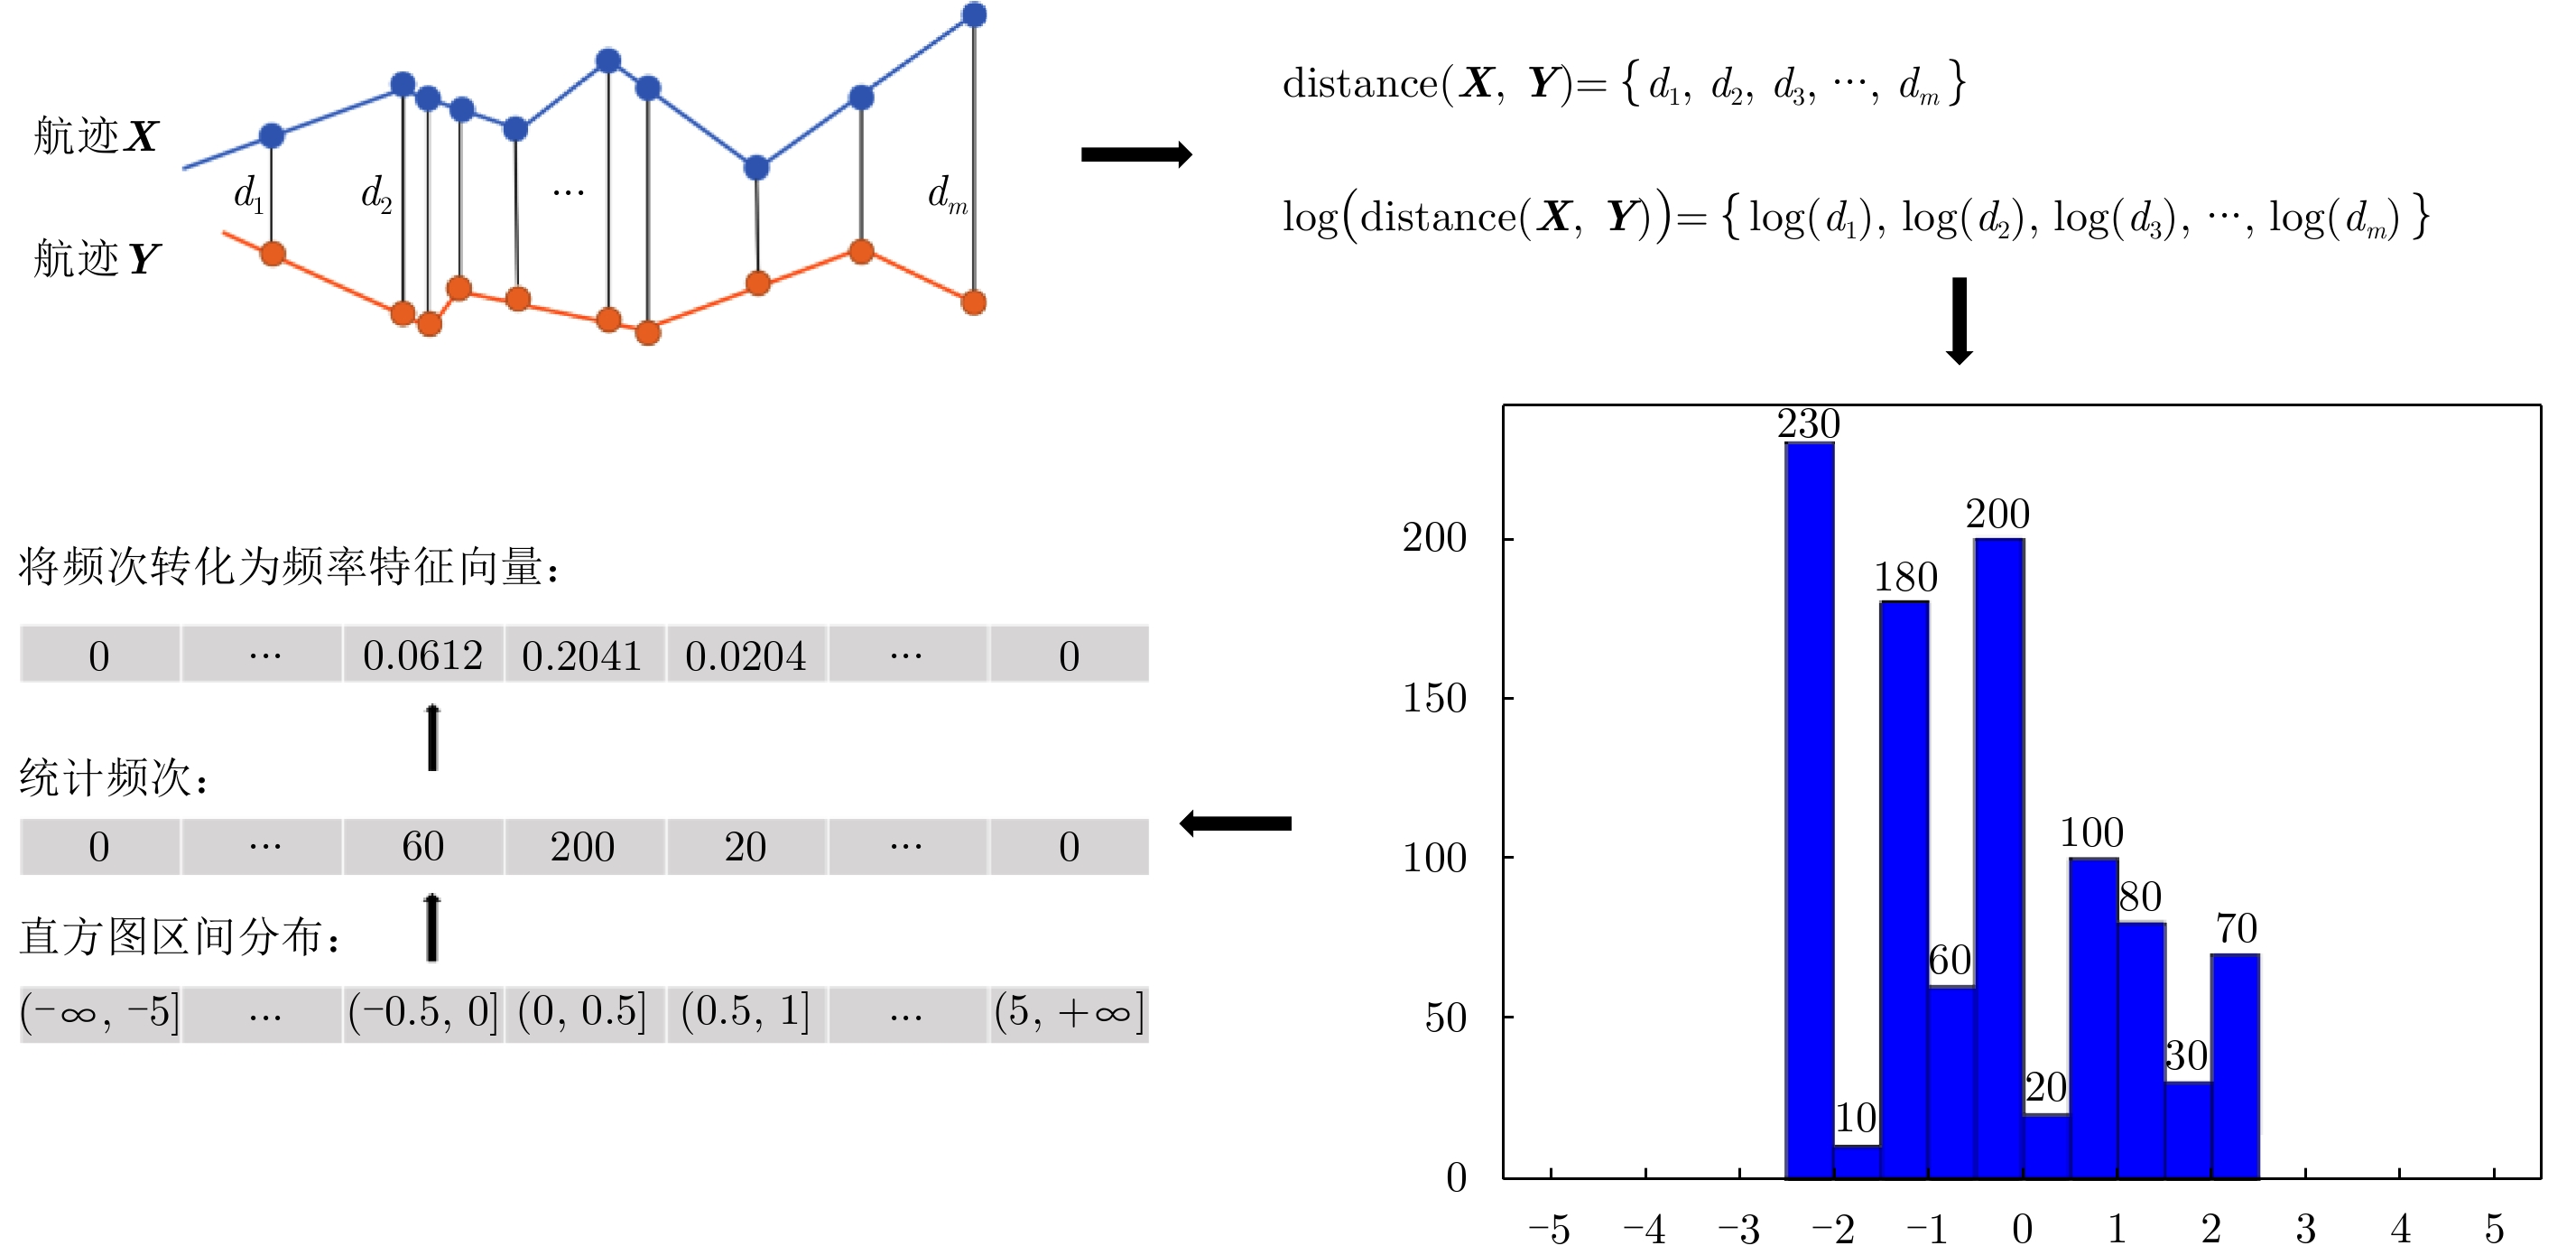
摘要: 现有的航迹关联方法主要有基于统计和基于模糊数学两大类方法。基于统计的方法大多依赖阈值的设置,基于模糊数学的方法参数设置复杂,且多数方法相关比较时只考虑单个航迹点的信息。针对现有问题,该文首先从航迹的整体出发,在传统欧式距离度量的基础上,提出了一种距离分布直方图的特征并提取了航迹的相似特征,有效地利用了航迹间的整体特性,具有较好的抗噪声性能以及关联准确率。其次充分考虑了船舶运动特征以及不同数据源位置精度,提取了航迹间的速度差分布直方图特征、传感器来源特征。然后将这些特征组合并利用机器学习的方法训练关联模型,有效地避免了需要人工设定阈值以及参数设置复杂的问题。最后,该文构建了一个真实的船舶数据集,实验结果表明距离分布直方图特征相比传统的距离特征总体关联准确率提高了3.23%~11.65%,组合特征相较于单一的距离分布直方图特征总体关联准确率提高了0.068%,验证了该文方法的有效性。Abstract: Existing track-to-track association methods are mainly based on statistics and fuzzy mathematics. However, most methods based on statistics depend on thresholds, and parameters based on fuzzy mathematics are complex to set. In addition, most methods only consider the information of a single track point in comparison. To solve the existing problems, this paper presents a distance distribution histogram feature to extract the similarity features of a trajectory and measure them using the standardized Euclidean distances; this method effectively utilizes the characteristics of the whole trajectory and has a good anti-noise performance and accuracy. The motion features of ships and the location accuracy of different data sources were fully considered. After obtaining the histogram features of velocity difference and the source features of sensors, the authors combined them and trained association models using machine learning, which effectively avoids the problem of manually setting thresholds and complex parameter settings. Finally, a real ship data set was constructed. The experimental results show that compared with the traditional distance feature, the overall association accuracy was improved by 3.23%~11.65% using the distance distribution histogram feature, and by 0.068% using the combination feature, which verifies the effectiveness of the proposed method.
-

图 1 距离分布直方图特征计算示意图
Figure 1. Schematic diagram of feature calculation of distance distribution histogram
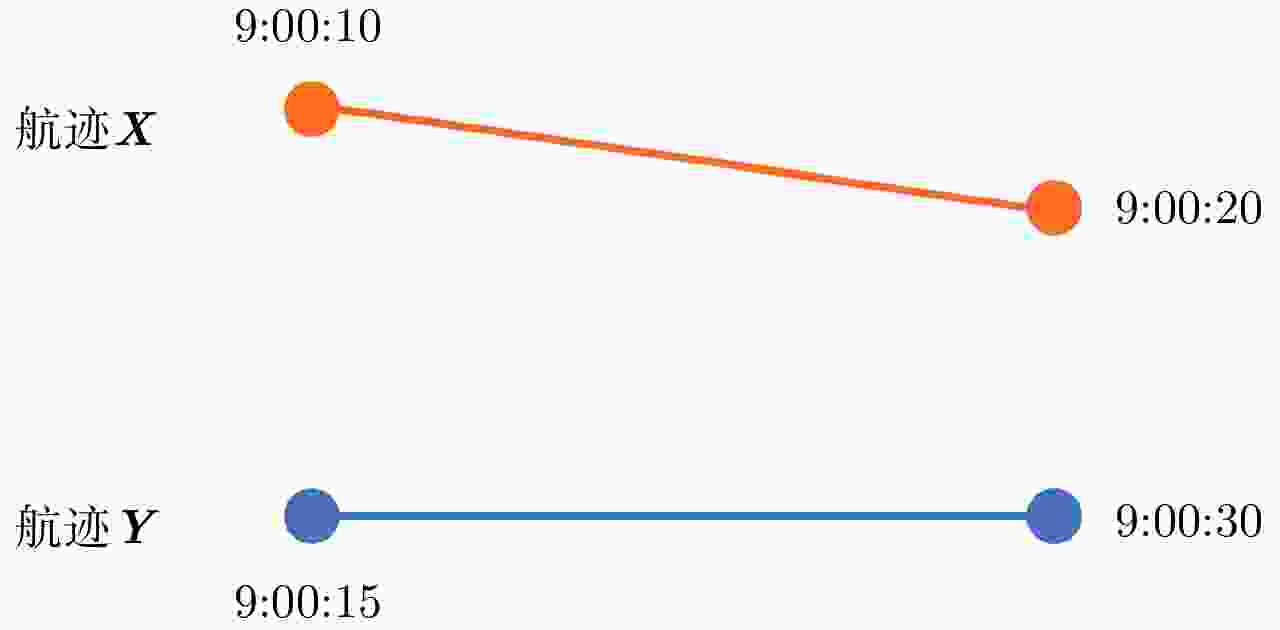
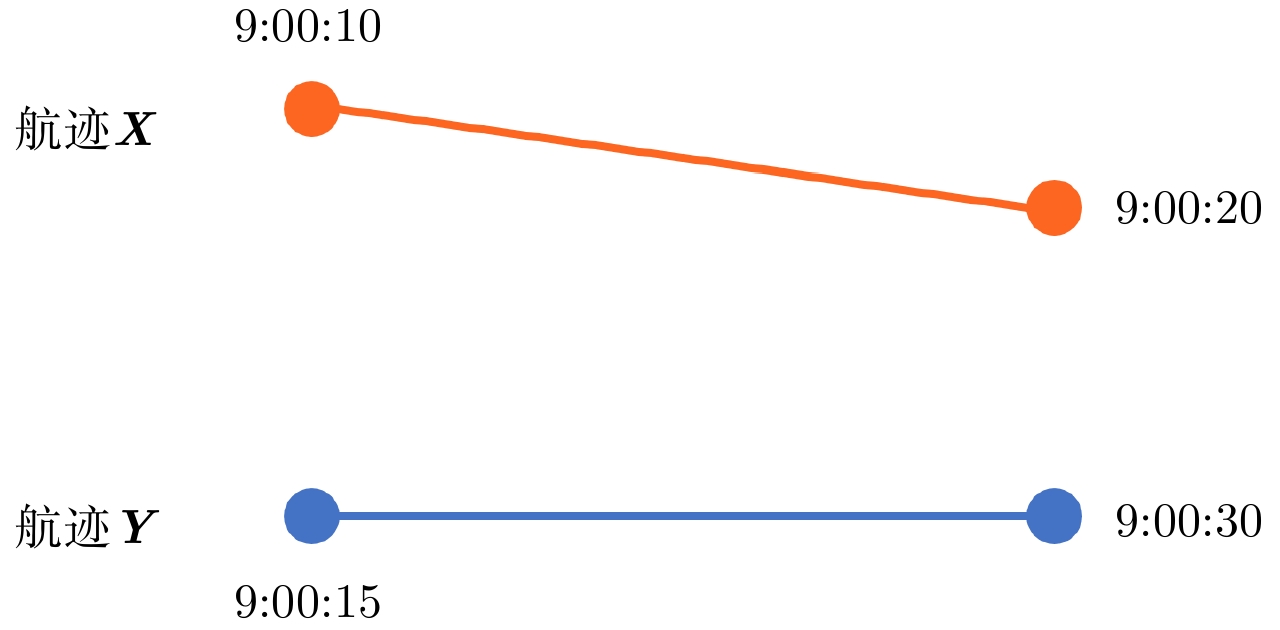
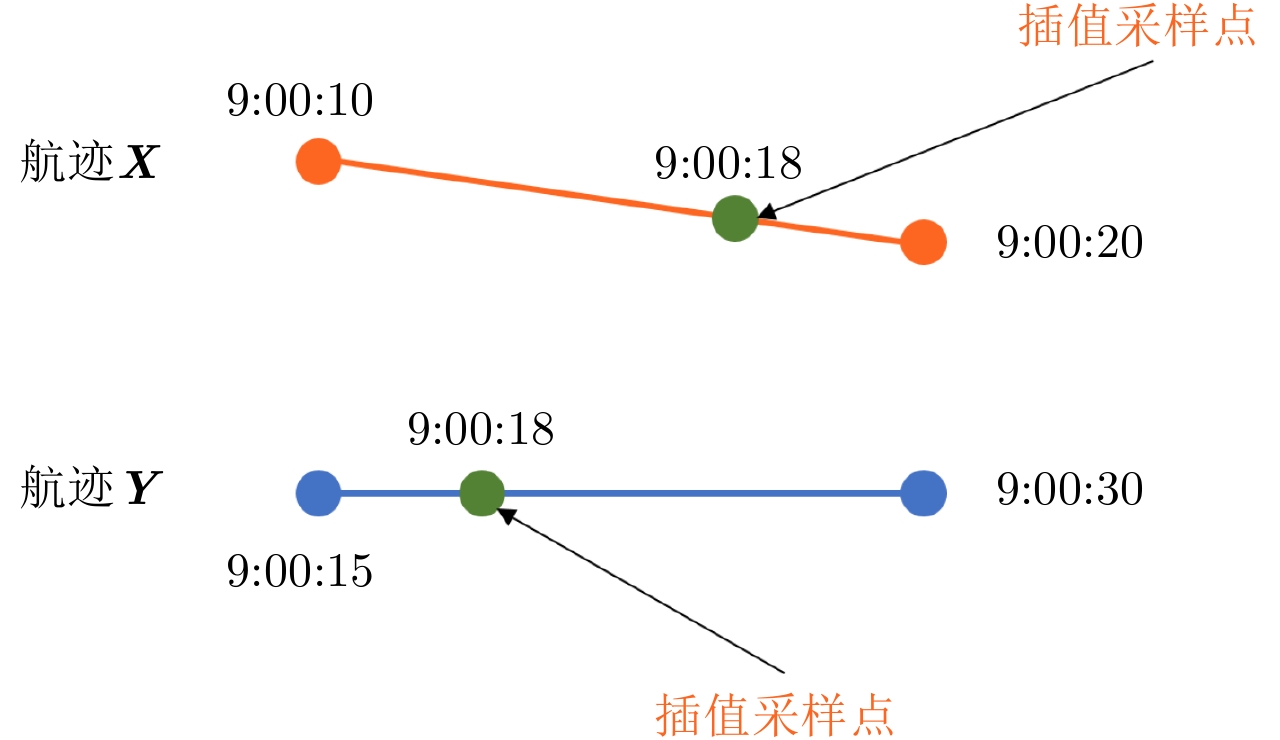
图 5 两条航迹对应点时间不同示意图
Figure 5. Different timings of the corresponding points on the two tracks
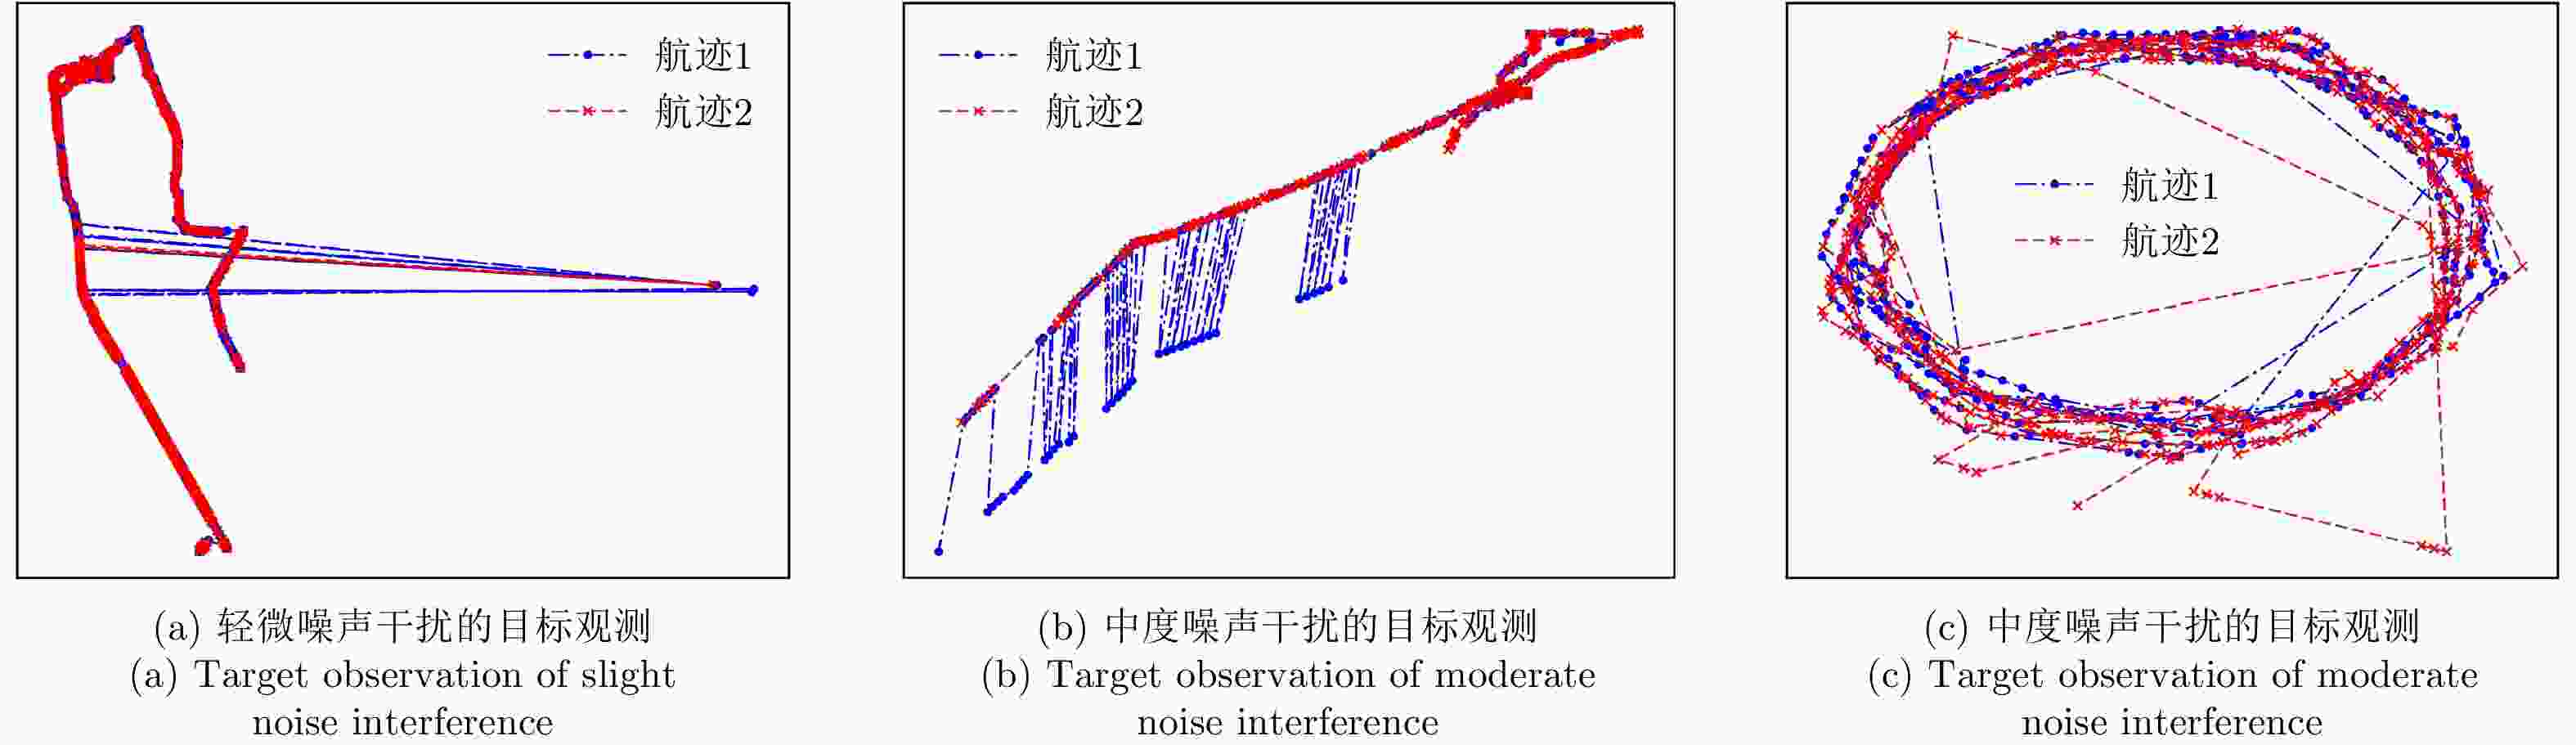
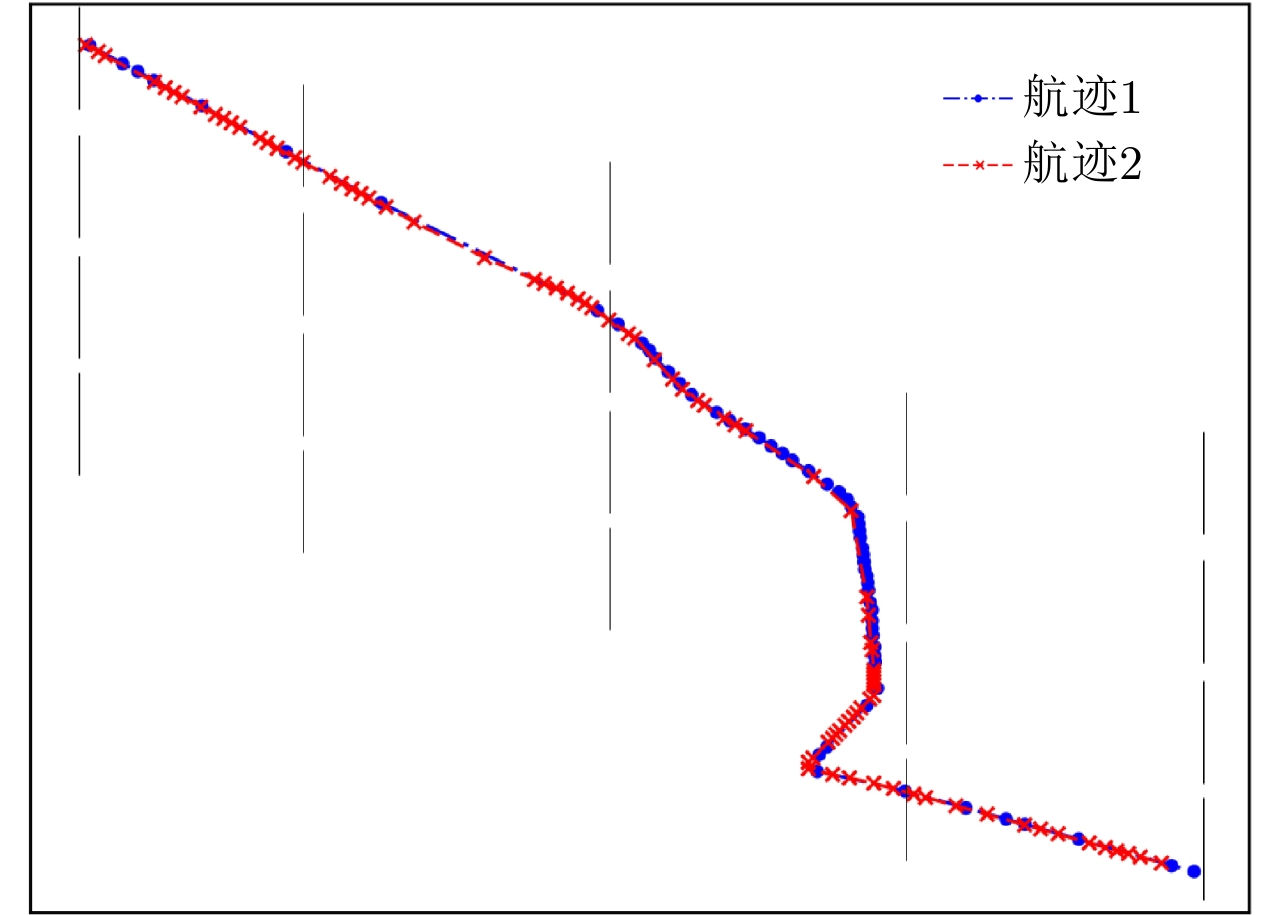
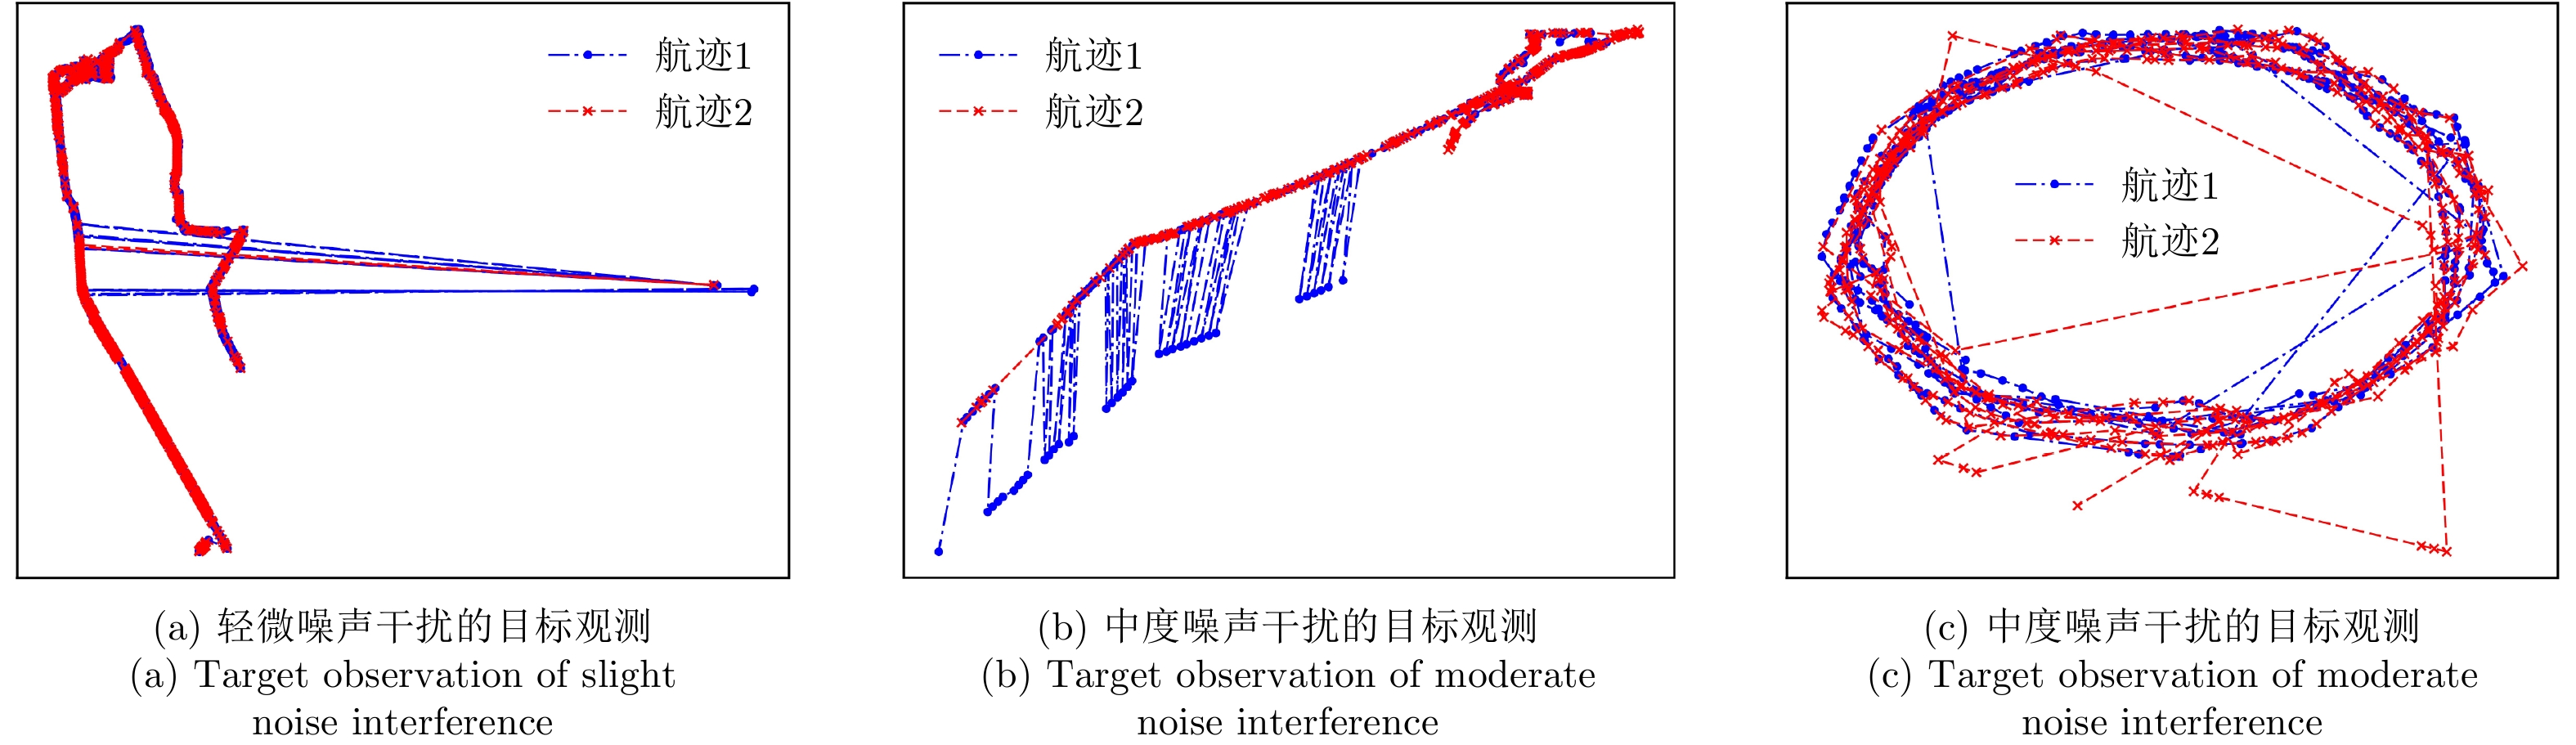
图 9 传统距离特征无法识别而距离分布直方图能够识别的目标
Figure 9. The targets that can’t be identified by traditional distance feature but can be identified by distance distribution histogram
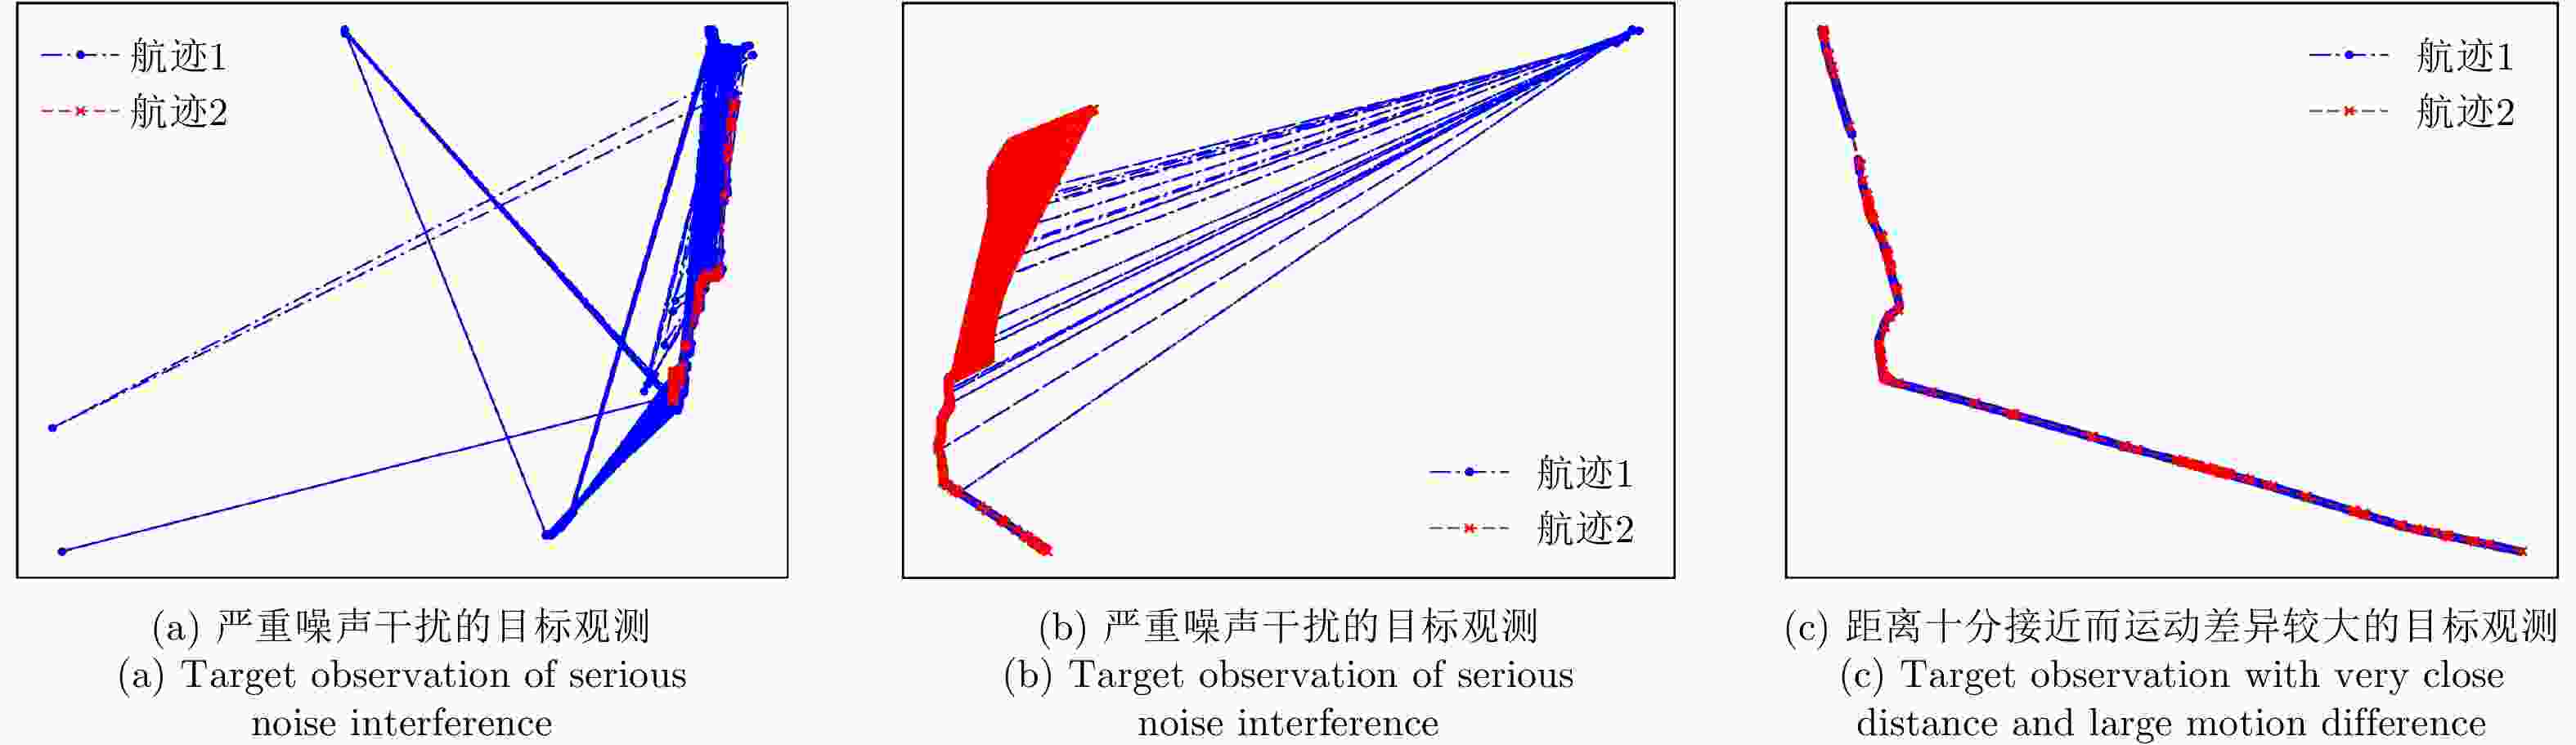
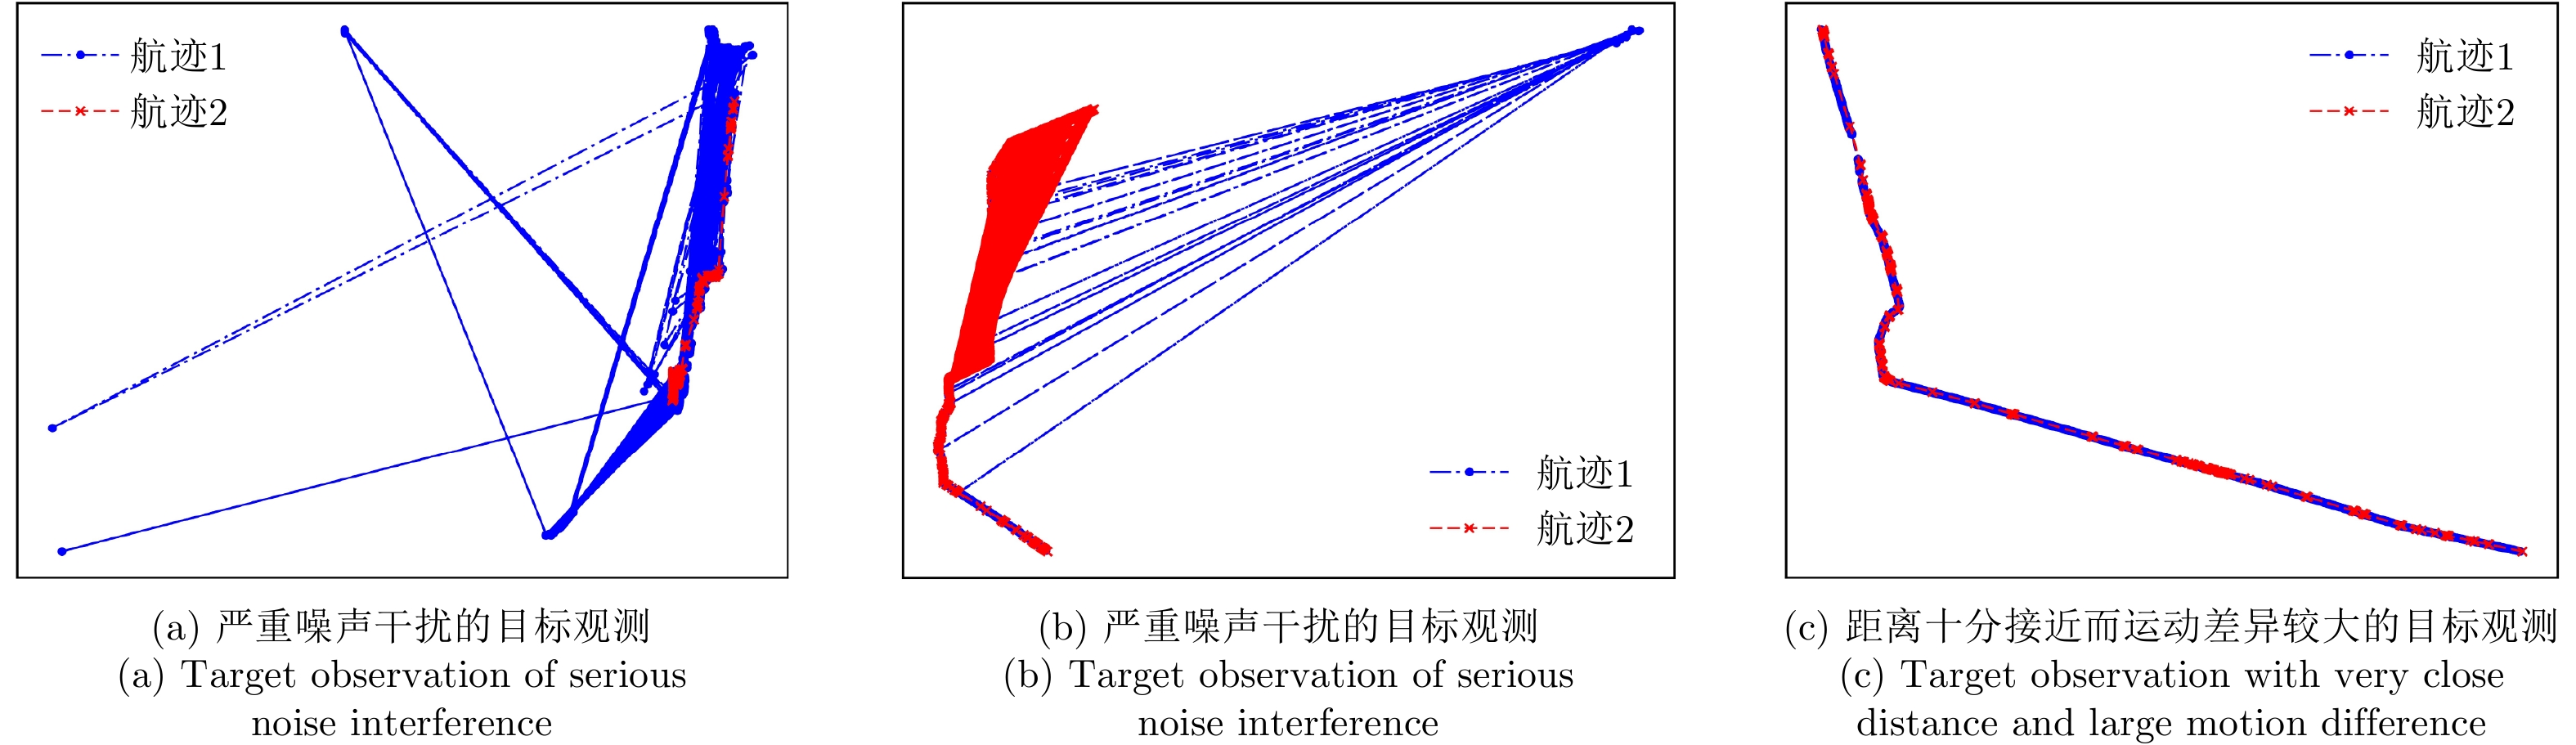
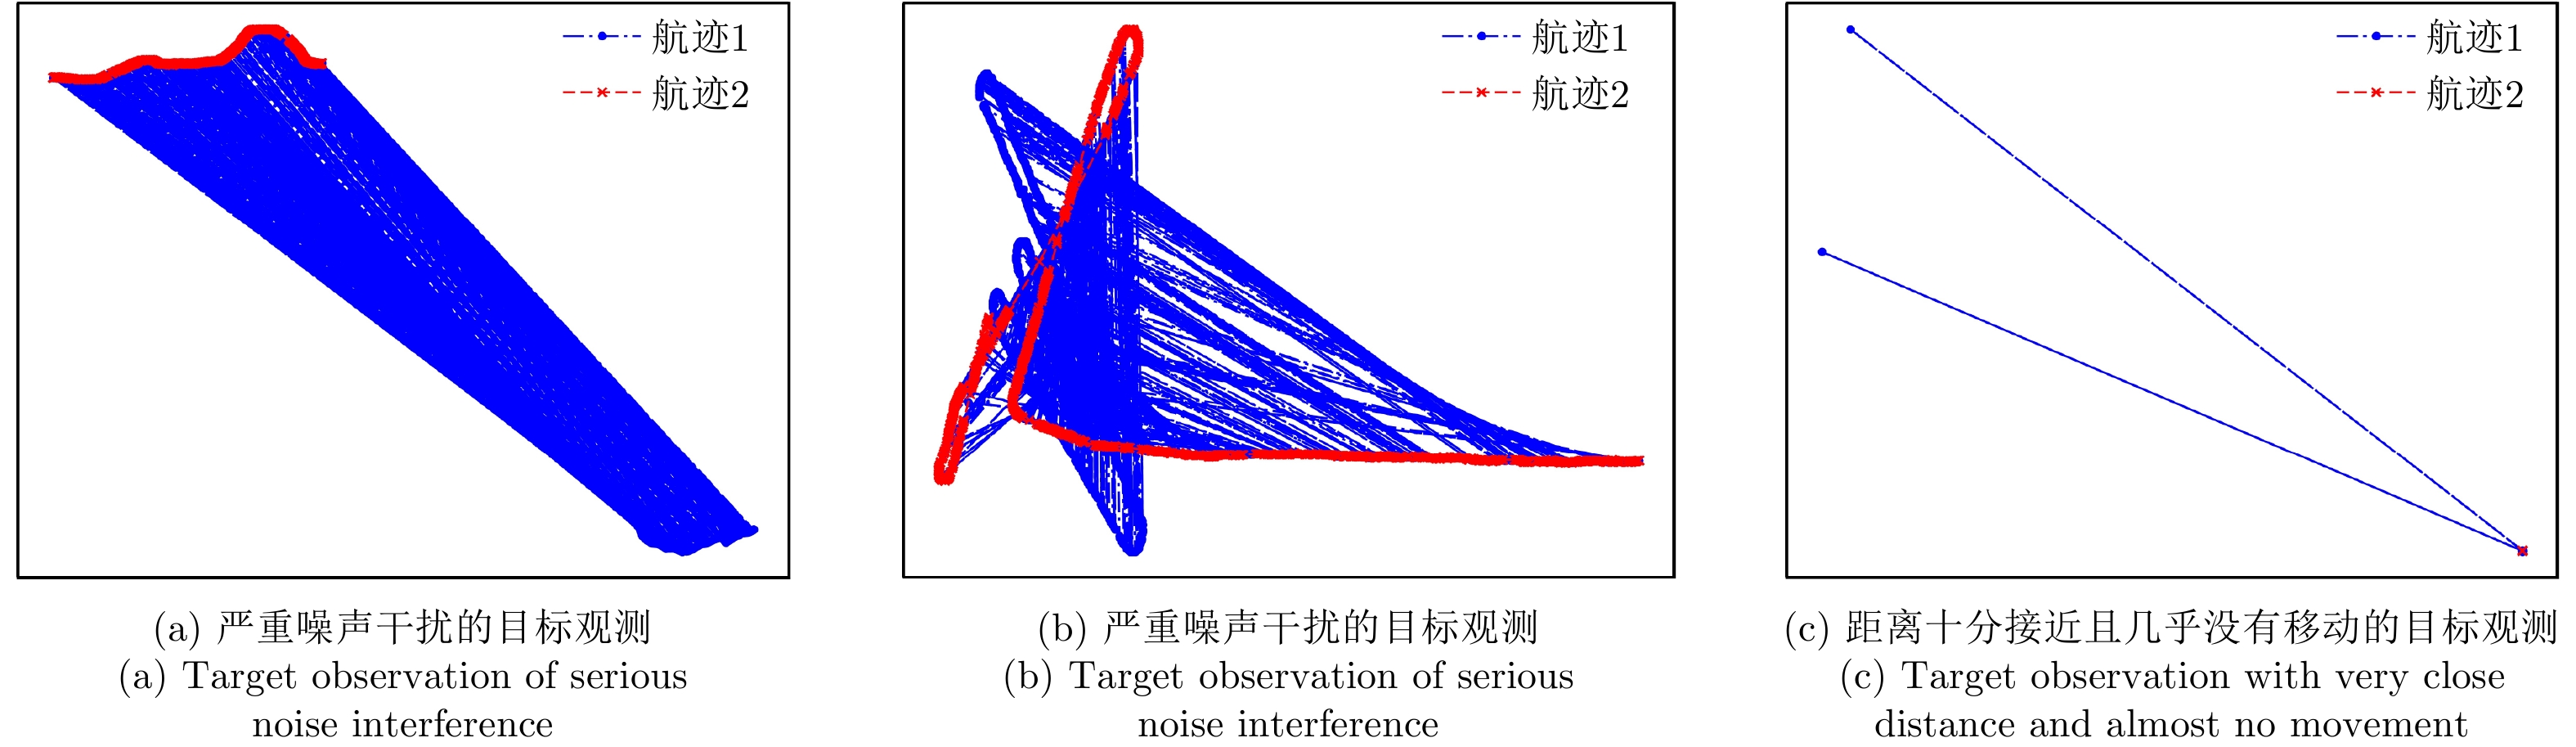
图 10 距离分布直方图特征关联失败的目标
Figure 10. The targets of distance distribution histogram feature error association
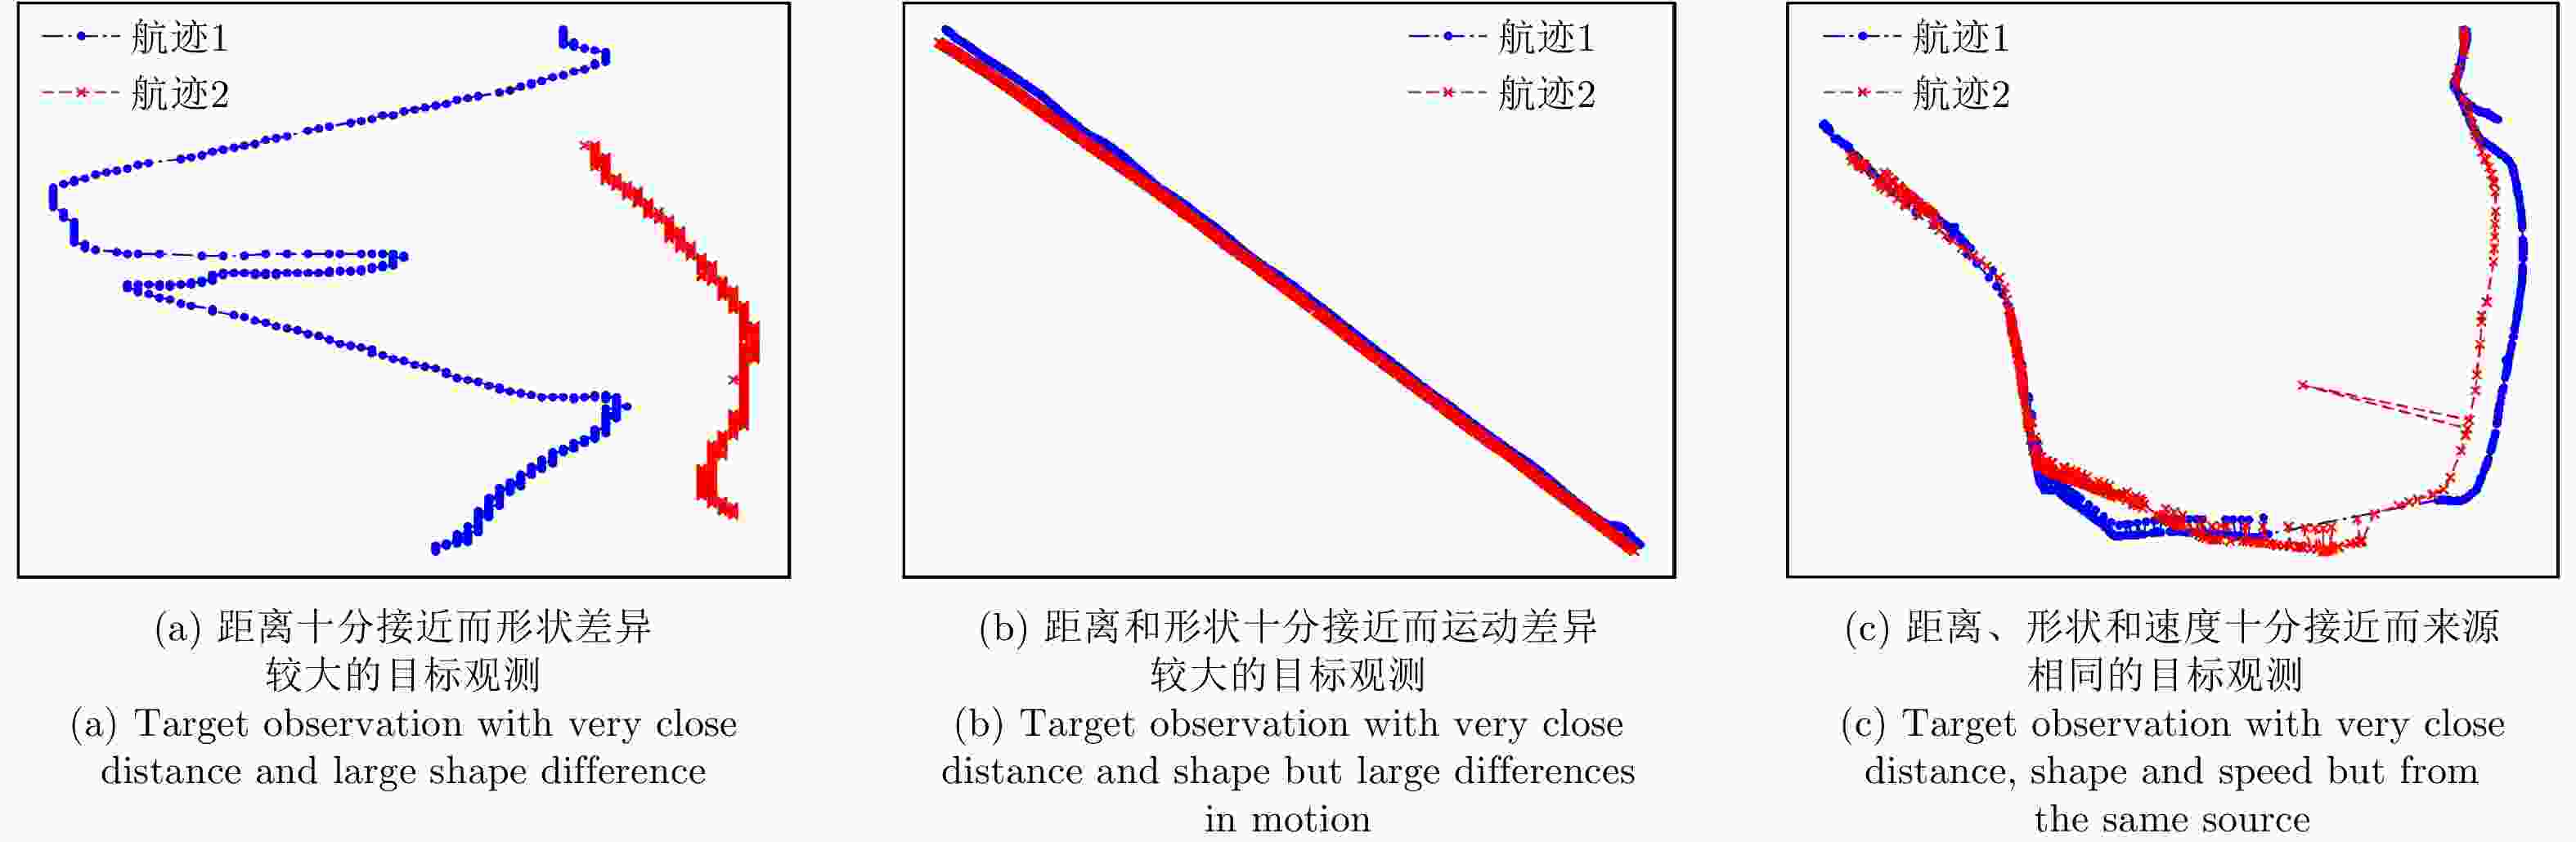
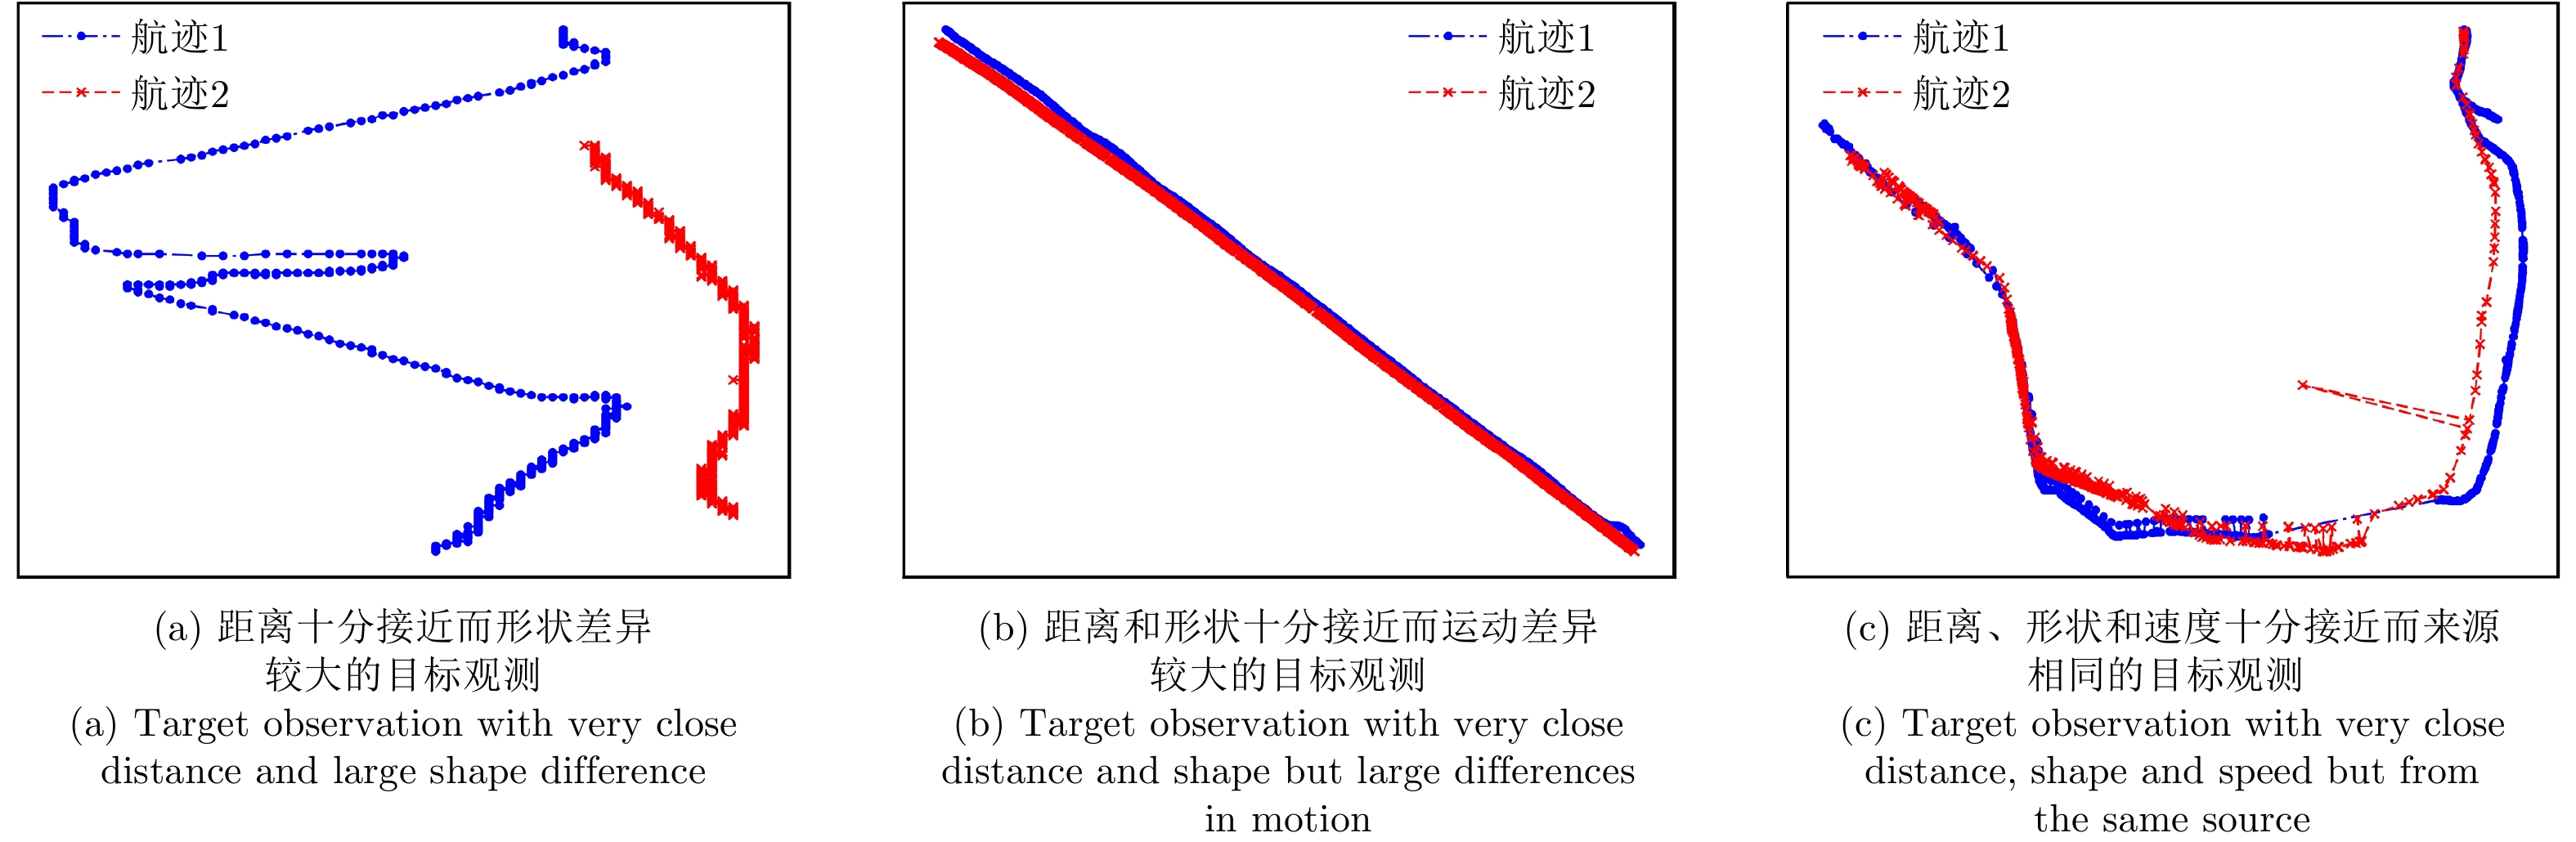
图 12 单一特征错误关联组合特征正确识别情况
Figure 12. Correct identification of single feature miscorrelation combination features
表 1 平均距离特征阈值方法与机器学习方法指标对比
Table 1. Comparison of average distance characteristics threshold method and machine learning method index
阈值 精度 查准率 查全率 F1 机器学习 – 0.9478 0.9617 0.9590 0.9603 精度最高阈值 4524.7 0.8906 0.9170 0.9170 0.9170 平均数阈值 76231.5 0.5998 1.0000 0.3927 0.5640 中位数阈值 8878.8 0.8142 0.9948 0.7218 0.8366  下载: 导出CSV
表 2 加权距离特征阈值方法与机器学习方法指标对比
Table 2. Comparison of weighted distance characteristics threshold method and machine learning method index
阈值 精度 查准率 查全率 F1 机器学习 – 0.9264 0.9538 0.9335 0.9435 精度最高阈值 0.0003 0.8626 0.9822 0.8062 0.8856 平均数阈值 0.2681 0.4528 1.0000 0.1679 0.2902 中位数阈值 0.0008 0.8080 0.9858 0.7190 0.8335
下载: 导出CSV
表 3 最大距离特征阈值方法与机器学习方法指标对比
Table 3. Comparison of maximum distance characteristics threshold method and machine learning method index
阈值 精度 查准率 查全率 F1 机器学习 – 0.8636 0.8904 0.9043 0.8973 精度最高阈值 14024.4 0.8036 0.9377 0.7520 0.8346 平均数阈值 108357.6 0.6094 0.9696 0.4026 0.5866 中位数阈值 20853.2 0.7713 0.9471 0.6917 0.7995
下载: 导出CSV
表 4 不同特征指标对比
Table 4. Comparison of different characteristics
特征 精度 查准率 查全率 F1 AUC 距离分布直方图 0.9801 0.9826 0.9873 0.9849 0.9768 平均距离 0.9478 0.9617 0.9590 0.9390 0.9426 加权距离 0.9264 0.9538 0.9335 0.9435 0.9373 最大距离 0.8636 0.8904 0.9043 0.8973 0.8446
下载: 导出CSV
表 5 组合特征指标对比
Table 5. Comparison of composite features
组合特征 精度 查准率 查全率 F1 AUC DDH 0.9801 0.9858 0.9840 0.9849 0.9783 DDH+DTW 0.9829 0.9859 0.9882 0.9870 0.9804 DDH+DTW+SDDH 0.9842 0.9873 0.9887 0.9880 0.9820 DDH+DTW+SDDH+数据来源特征 0.9869 0.9901 0.9901 0.9901 0.9855
下载: 导出CSV
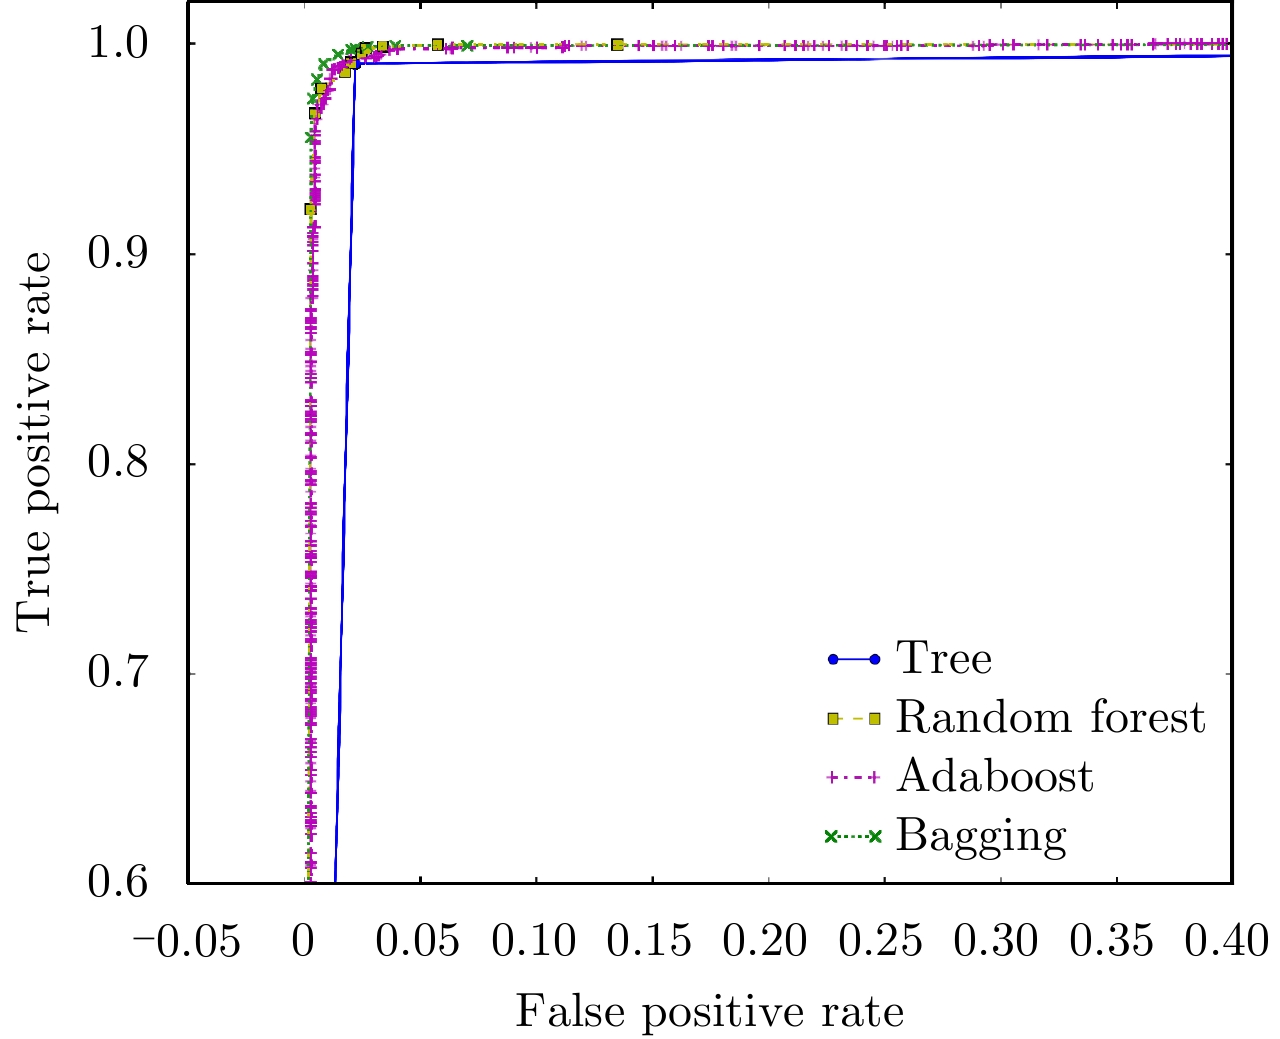
表 6 不同机器学习方法指标对比
Table 6. Comparison of different machine learning indicators
学习方法 精度 查准率 查全率 F1 AUC Tree 0.9863 0.9887 0.9906 0.9896 0.9843 Random forest 0.9873 0.9896 0.9910 0.9903 0.9978 Adaboost 0.9885 0.9915 0.9910 0.9913 0.9965 Bagging 0.9916 0.9925 0.9948 0.9936 0.9979
下载: 导出CSV
-
[1] 杨威, 陈杰, 李春升. 面向目标特性精细提取的SAR数据融合成像处理方法[J]. 雷达学报, 2015, 4(1): 29–37. doi: 10.12000/JR15017YANG Wei, CHEN Jie, and LI Chun-sheng. SAR data fusion imaging method oriented to target feature extraction[J]. Journal of Radars, 2015, 4(1): 29–37. doi: 10.12000/JR15017 [2] 李伟, 王兴亮, 邹鲲, 等. 基于数据融合和陷波滤波的MIMO雷达抗欺骗干扰算法[J]. 雷达学报, 2012, 1(3): 246–252. doi: 10.3724/SP.J.1300.2012.20060LI Wei, WANG Xing-liang, ZOU Kun, et al. Anti deceptive jamming for MIMO radar based on data fusion and notch filtering[J]. Journal of Radars, 2012, 1(3): 246–252. doi: 10.3724/SP.J.1300.2012.20060 [3] LIGGINS M E, HALL D L, and LLINAS J. Handbook of Multisensor Data Fusion: Theory and Practice[M]. 2nd ed., Boca Raton, FL: CRC Press, 2009. [4] 何友, 王国宏, 陆大䋮, 等. 多传感器信息融合及应用[M]. 第2版, 北京: 电子工业出版社, 2007.HE You, WANG Guo-hong, LU Da-jin, et al. Multisensor Information Fusion with Applications[M]. 2nd ed., Beijing: Publishing House of Electronics Industry, 2007. [5] CHANG C and YOUENS L C. Measurement correlation for multiple sensor tracking in a dense target environment[J]. IEEE Transactions on Automatic Control, 1982, 27(6): 1250–1252. doi: 10.1109/TAC.1982.1103107 [6] Bar-Shalom Y. On the track-to-track correlation problem[J]. IEEE Transactions on Automatic Control, 1981, 26(2): 571–572. doi: 10.1109/TAC.1981.1102635 [7] AZIZ A M, TUMMALA M, and CRISTI R. Fuzzy Logic Data Correlation Approach in Multisensor-Multitarget Tracking Systems[M]. Elsevier North-Holland, Inc, 1999. https://www.sciencedirect.com/science/article/pii/S0165168499000080. [8] SMITH III J F. Fuzzy logic multisensor association algorithm[C]. Proceedings of SPIE Signal Processing, Sensor Fusion, and Target Recognition VI, Orlando, FL, USA, 1997: 76–87. doi: 10.1117/12.280788. [9] YANG Y T, LIANG Y, YANG Y B, et al. Asynchronous track-to-track association algorithm based on dynamic time warping distance[C]. Proceedings of the 34th Control Conference, Hangzhou, China, 2015: 4772–4777. [10] 董凯, 王海鹏, 刘瑜. 基于拓扑统计距离的航迹抗差关联算法[J]. 电子与信息学报, 2015, 37(1): 50–55. doi: 10.11999/JEIT140244DONG Kai, WANG Hai-peng, and LIU Yu. Anti-bias track association algorithm based on topology statistical distance[J]. Journal of Electronics &Information Technology, 2015, 37(1): 50–55. doi: 10.11999/JEIT140244 [11] STONE L D, TRAN T M, and WILLIAMS M L. Improvement in track-to-track association from using an adaptive threshold[C]. Proceedings of the 12th International Conference on Information Fusion, Seattle, WA, USA, 2009: 1627–1633. [12] AGRAWAL R, FALOUTSOS C, and SWAMI A N. Efficient similarity search in sequence databases[C]. Proceedings of the 4th International Conference on Foundations of Data Organization and Algorithms, Berlin, Heidelberg, Germany, 1993: 69–84. [13] BARCZEWSKA K and DROZD A. Comparison of methods for hand gesture recognition based on dynamic time warping algorithm[C]. Proceedings of 2013 Federated Conference on Computer Science and Information Systems, Poland, 2013: 207–210. [14] BANKÓ Z and ABONYI J. Correlation based dynamic time warping of multivariate time series[J]. Expert Systems with Applications, 2012, 39(17): 12814–12823. doi: 10.1016/j.eswa.2012.05.012 [15] CASACUBERTA F, VIDAL E, and RULOT H. On the metric properties of dynamic time warping[J]. IEEE Transactions on Acoustics, Speech, and Signal Processing, 1987, 35(11): 1631–1633. doi: 10.1109/TASSP.1987.1165065 [16] HUANG B and KINSNER W. ECG frame classification using dynamic time warping[C]. Proceedings of 2002 Canadian Conference on Electrical and Computer Engineering, Winnipeg, Manitoba, Canada, 2002: 1105–1110. [17] JABLONSKI B. Quaternion dynamic time warping[J]. IEEE Transactions on Signal Processing, 2012, 60(3): 1174–1183. doi: 10.1109/TSP.2011.2177832 [18] FU C X, ZHANG P L, JIANG J, et al. A Bayesian approach for sleep and wake classification based on dynamic time warping method[J]. Multimedia Tools and Applications, 2017, 76(17): 17765–17784. doi: 10.1007/s11042-015-3053-z [19] BAUMANN M, OZDOGAN M, RICHARDSON A D, et al. Phenology from landsat when data is scarce: Using MODIS and dynamic time-warping to combine multi-year landsat imagery to derive annual phenology curves[J]. International Journal of Applied Earth Observation and Geoinformation, 2017, 54: 72–83. doi: 10.1016/j.jag.2016.09.005 [20] VARATHARAJAN R, MANOGARAN G, PRIYAN M K, et al. Wearable sensor devices for early detection of Alzheimer disease using dynamic time warping algorithm[J]. Cluster Computing, 2017(6): 1–10. doi: 10.1007/s10586-017-0977-2 [21] ZHOU N C, WANG J, and WANG Q G. A novel estimation method of metering errors of electric energy based on membership cloud and dynamic time warping[J]. IEEE Transactions on Smart Grid, 2017, 8(3): 1318–1329. doi: 10.1109/TSG.2016.2619375 [22] WAN Y, CHEN X L, and SHI Y. Adaptive cost dynamic time warping distance in time series analysis for classification[J]. Journal of Computational and Applied Mathematics, 2017, 319: 514–520. doi: 10.1016/j.cam.2017.01.004 [23] SINGER R A and KANYUCK A J. Computer Control of Multiple Site Track Correlation[M]. Tarrytown, NY, USA: Pergamon Press, Inc., 1971. [24] DITZLER W R. A demonstration of multisensor tracking[C]. Proceedings of the 1987 Tri-Service Data Fusion Symposium, JHU/APL, Laurel, Md., 1987: 303–311. [25] 周志华. 机器学习[M]. 北京: 清华大学出版社, 2016.ZHOU Zhi-hua. Machine Learning[M]. Beijing: Tsinghua University Press, 2016. [26] 周晓安. VTS系统中多传感器目标航迹关联算法研究[D]. [硕士论文], 南京信息工程大学, 2014.ZHOU Xiao-an. The research of track association for multi-sensor target in VTS system[D]. [Master dissertation], Nanjing University of Information Science & Technology, 2014. [27] 周晓安, 高贵明. 自适应阈值航迹关联算法与实现[J]. 现代防御技术, 2014, 42(4): 193–198. doi: 10.3969/j.issn.1009-086x.2014.04.031ZHOU Xiao-an and GAO Gui-ming. Adaptive threshold algorithm and implementation for track-to-track association[J]. Modern Defense Technology, 2014, 42(4): 193–198. doi: 10.3969/j.issn.1009-086x.2014.04.031 [28] HAN Jia-wei and KAMBER M. 数据挖掘: 概念与技术[M]. 范明, 孟小峰, 译. 北京: 机械工业出版社, 2007.HAN Jia-wei and KAMBER M. Data Mining: Concepts and Techniques[M]. FAN Ming, MENG Xiao-feng, trans. Beijing: China Machine Press, 2007. -


计量
- 文章访问数:
- HTML全文浏览量:
- PDF下载量:
- 被引次数: 0

