

 作者中心
作者中心 专家审稿
专家审稿 责编办公
责编办公 编辑办公
编辑办公
Assessment of Arctic Sea Ice Extent and Type Retrieval Using Chinese Multisource Spaceborne Scatterometers
-
摘要: 海冰是全球气候变化的重要指示因子,其精确监测对气候研究、极地航运和海洋资源利用具有重要意义。星载微波散射计具备全天时、全天候和大范围观测能力,是极地海冰监测的重要遥感手段。该文利用HY-2B, CFOSAT和FY-3E 3颗国产卫星散射计观测数据,在统一投影网格、统一样本标签和统一分类框架下,基于支持向量机(SVM)分别构建了北极海冰范围检测模型和海冰类型(一年冰/多年冰)分类模型,并利用2022年3月至2023年2月观测数据生成逐日海冰产品。通过与OSI SAF, NSIDC, MODIS海冰范围产品及SAR影像的综合对比,系统评估了不同散射计在海冰监测中的能力差异。结果表明:在冰水区分任务中,FY-3E双波段联合方法表现最佳,年平均总体精度和Kappa系数分别达到99.11%和97.39%;CFOSAT, FY-3E Ku波段和FY-3E C波段结果相近,均优于HY-2B。在非融化期海冰类型分类任务中,以OSI SAF海冰类型产品为参考时,FY-3E双波段联合方法同样取得最高精度,年平均总体精度和Kappa系数分别为97.40%和92.42%;进一步以NSIDC海冰年龄产品进行交叉验证时,FY-3E双波段联合方法仍表现最优,OA和Kappa分别为87.26%和69.65%。CFOSAT, HY-2B和FY-3E Ku波段具备较好的冰型区分能力,而FY-3E C波段单独用于冰型识别时精度较低。总体来看,不同参考数据会影响冰型分类的绝对精度,但各方法的相对表现基本一致,说明FY-3E双波段联合结果并非仅反映对OSI SAF训练标签的拟合。FY-3E双波段联合方法在全年海冰范围检测和非融化期海冰类型分类中均表现出更高的稳定性和一致性,说明双频散射信息在极地海冰监测中具有明显互补优势。该研究可为国产散射计海冰业务化应用及多波段联合反演提供参考。Abstract: Sea ice is an important indicator of global climate change, and its accurate monitoring is essential for climate research, polar navigation, and marine resource management. Spaceborne microwave scatterometers, with their all-weather, day-and-night, and wide-swath observation capabilities, are critical remote sensing tools for monitoring polar sea ice. In this study, scatterometer observations from three Chinese satellites (HY-2B, CFOSAT, and FY-3E) were used to develop Arctic sea ice extent detection and classification models for first-year and multiyear ice using a support vector machine. All models were created using a unified projection grid, shared sample labels, and a consistent classification framework. Daily sea ice products were generated using observations from March 2022 to February 2023. The scatterometers’ performance differences were systematically evaluated by comparing them to the Ocean and Sea Ice Satellite Application Facility (OSI SAF), the National Snow and Ice Data Center (NSIDC), Moderate Resolution Imaging Spectroradiometer (MODIS) sea ice extent products, and synthetic aperture radar imagery. The findings show that the FY-3E dual-band approach performed best for ice-water discrimination, with annual mean overall accuracy and Kappa coefficient values of 99.11% and 97.39%, respectively. The results for CFOSAT, FY-3E Ku-band, and FY-3E C-band were all comparable and outperformed HY-2B. The FY-3E dual-band approach achieved the highest accuracy for sea ice type classification during the nonmelting period; using the OSI SAF sea ice type product as a reference, the mean overall accuracy and Kappa coefficient were 97.40% and 92.42%, respectively. Further cross-validation with the NSIDC sea ice age product revealed that the FY-3E dual-band approach performed the best, with an overall accuracy of 87.26% and a Kappa coefficient of 69.65%. CFOSAT, HY-2B, and FY-3E Ku-band all performed well at distinguishing sea ice types, whereas FY-3E C-band alone produced relatively low accuracy. Although different reference datasets affected the absolute accuracy of sea ice type classification, the relative performance of different methods remained consistent, indicating that the FY-3E dual-band results reflect genuine classification rather than merely fitting to the OSI SAF training labels. Overall, the FY-3E dual-band approach showed greater stability and consistency in annual sea ice extent detection and nonmelting-period sea ice type classification, highlighting the complementary benefits of dual-frequency scatterometer observations for polar sea ice monitoring. This study provides a reference for the operational application of Chinese scatterometers and multiband joint sea ice retrieval.
-
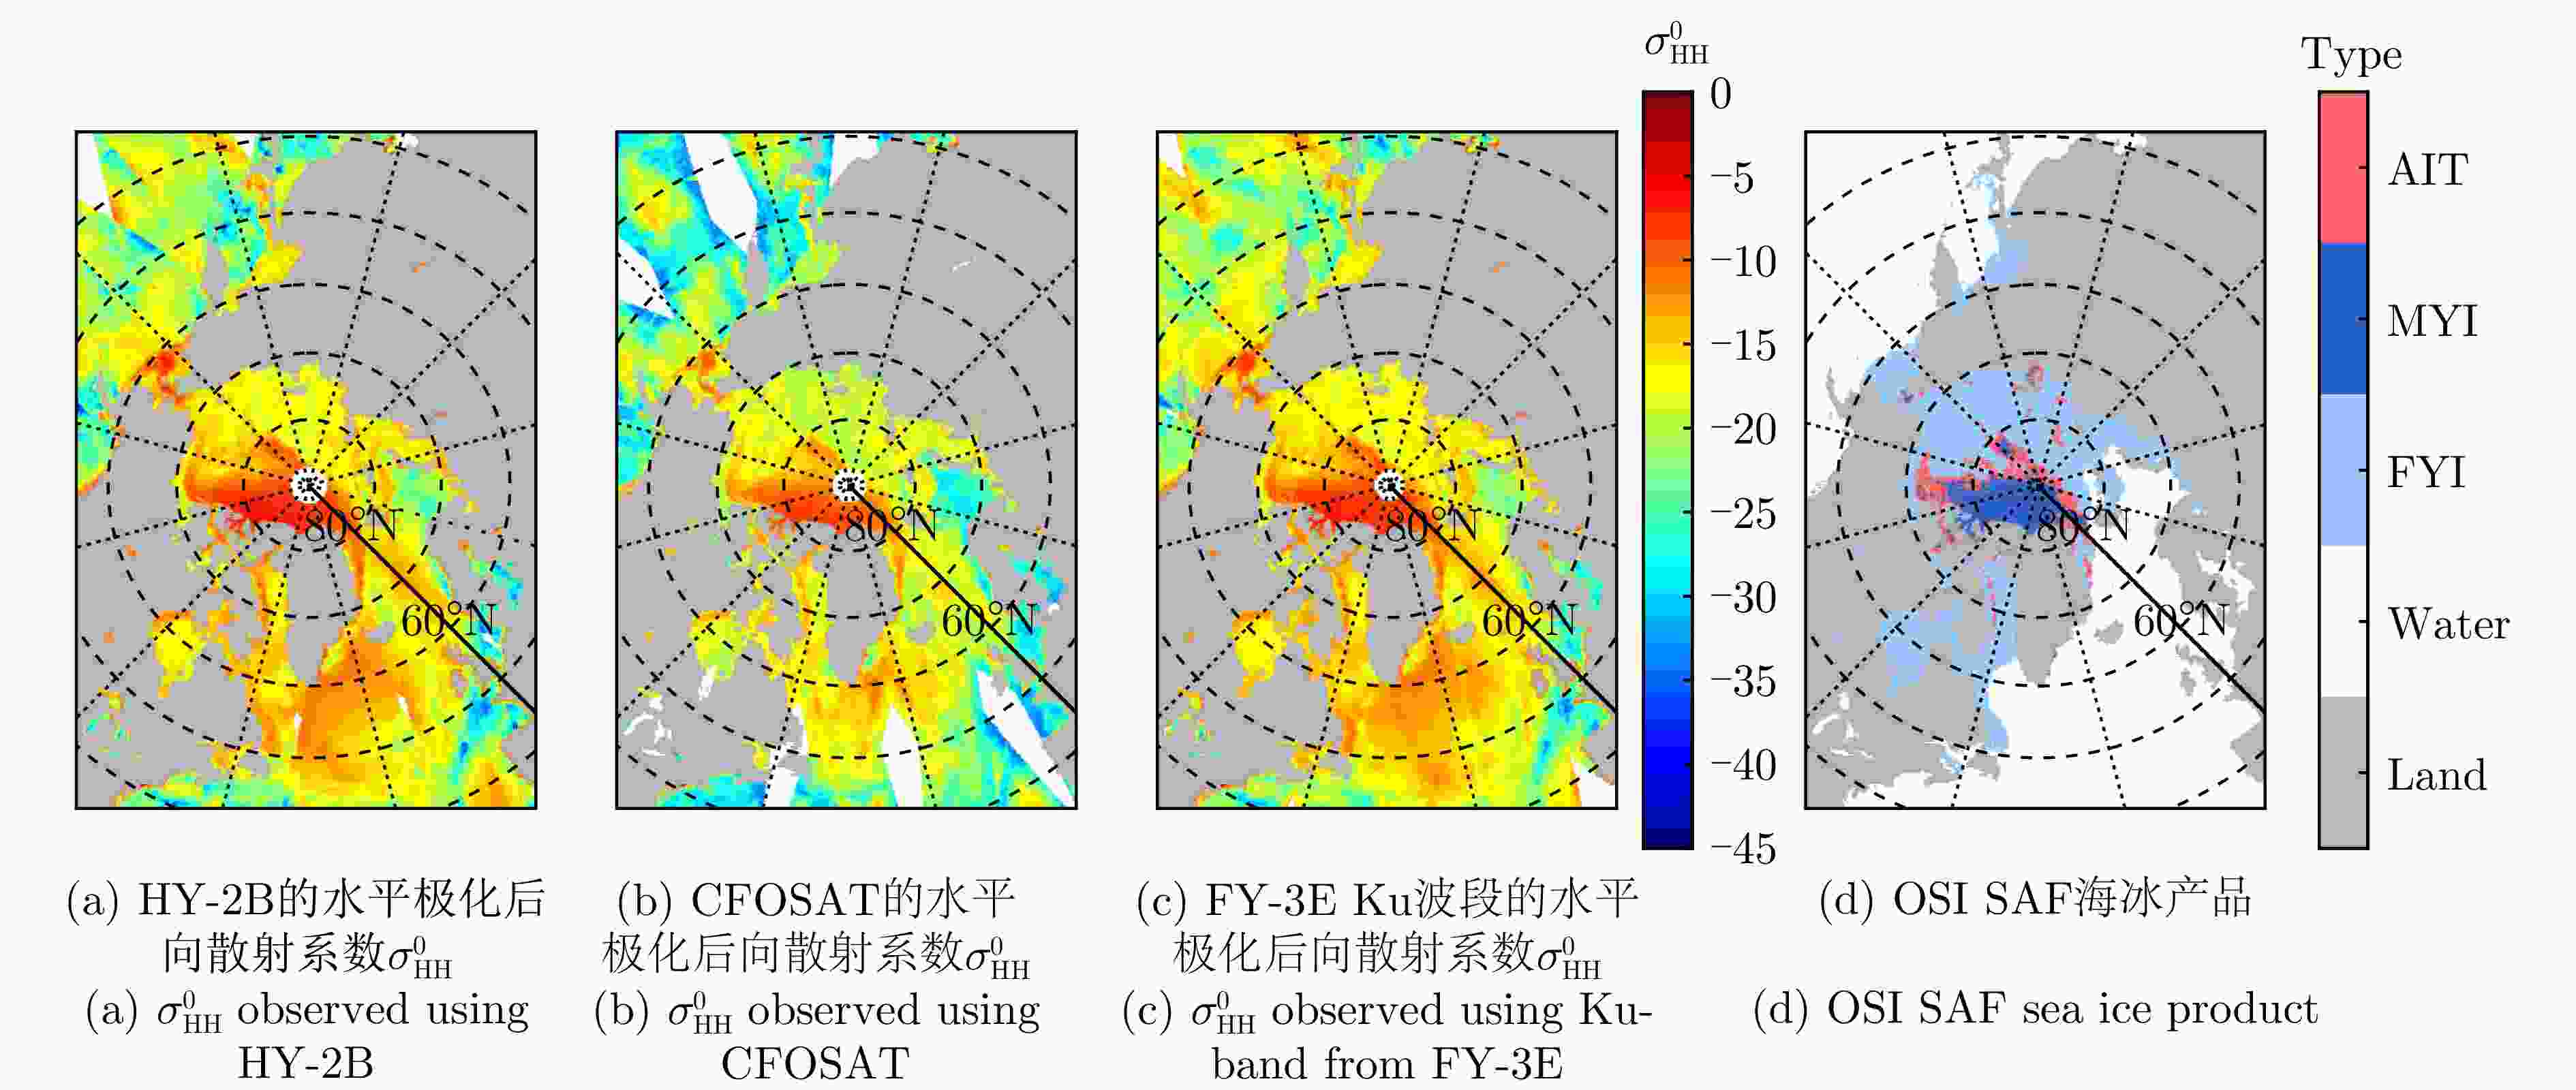
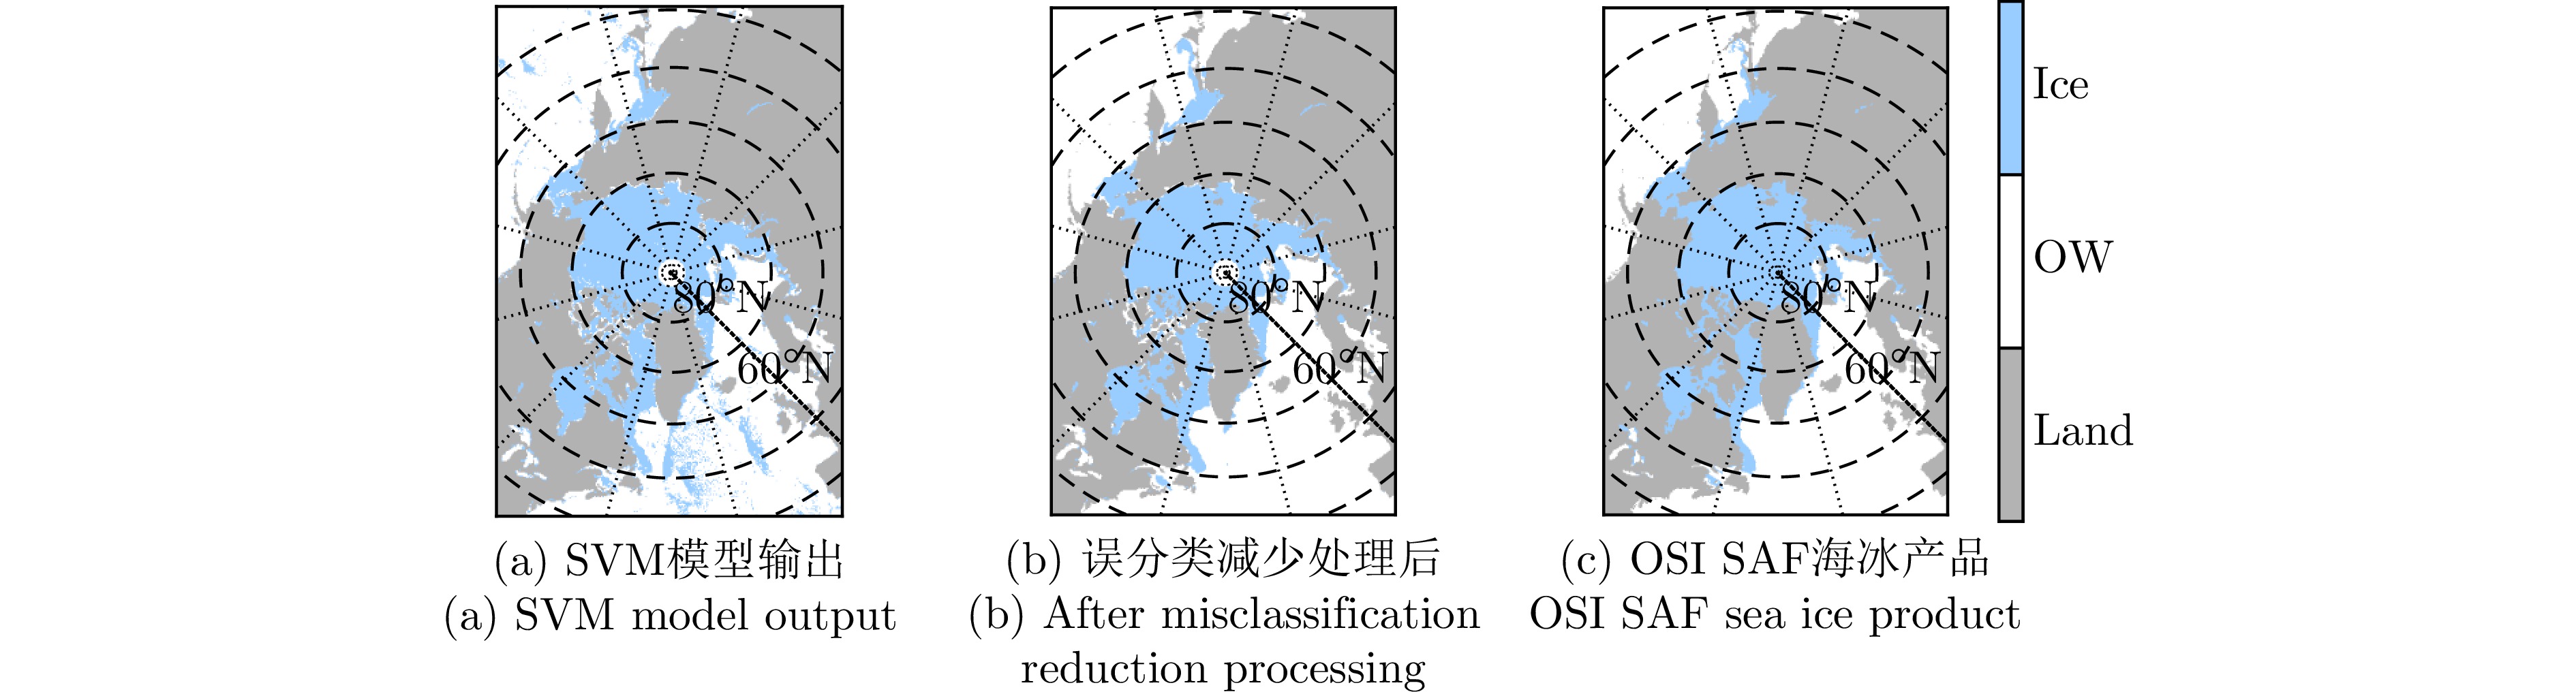
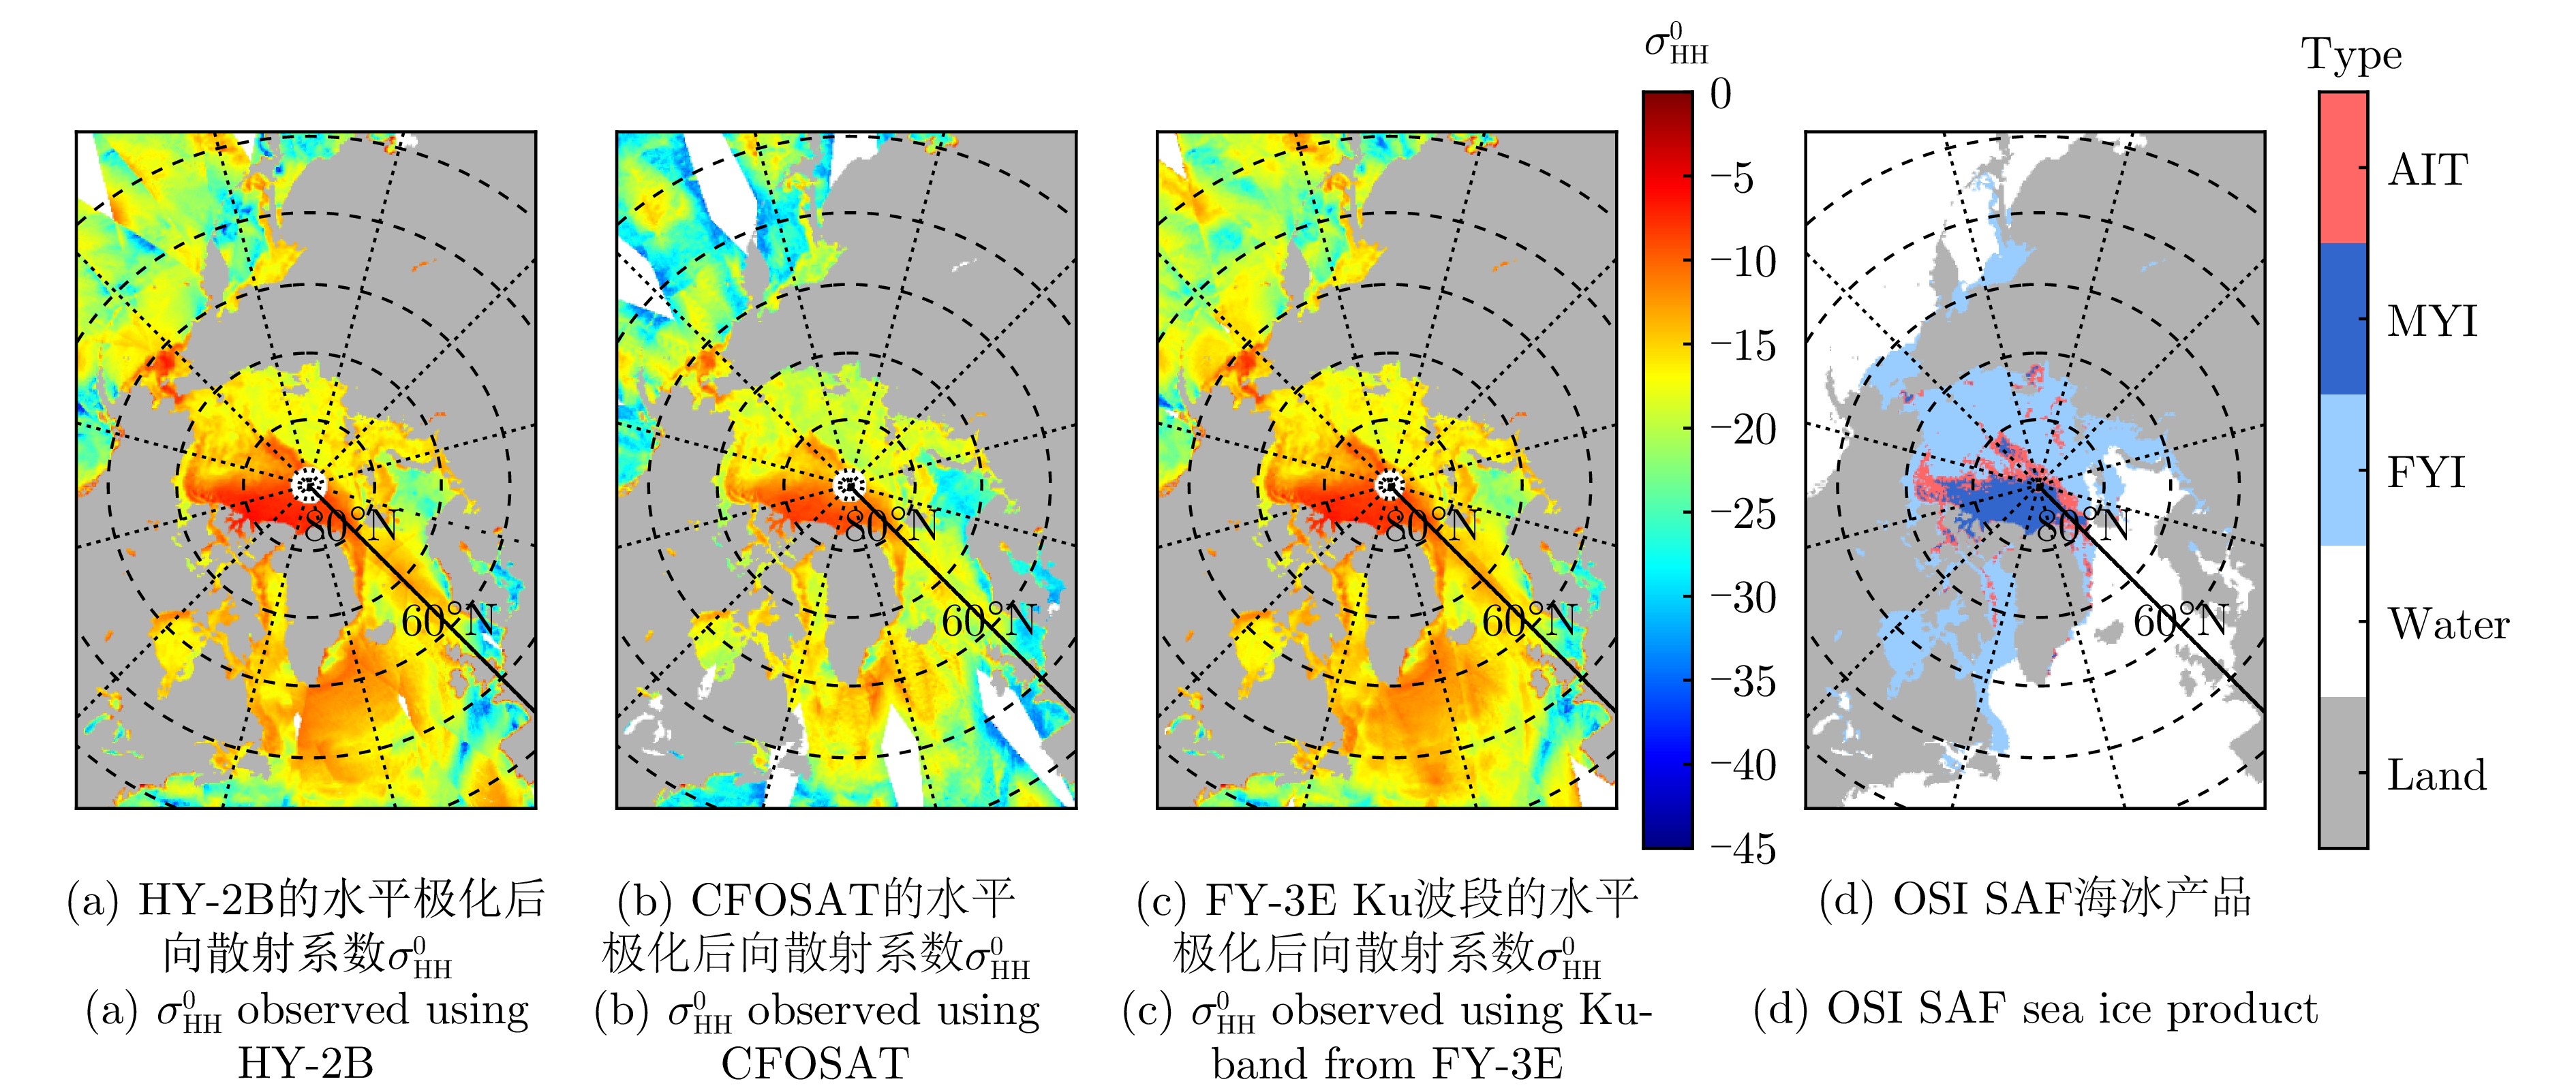
图 1 2022年3月15日北极地区散射计后向散射系数影像以及OSI SAF海冰产品
Figure 1. Scatterometer backscatter coefficient images and OSI SAF sea ice product over the Arctic region on 15 March 2022
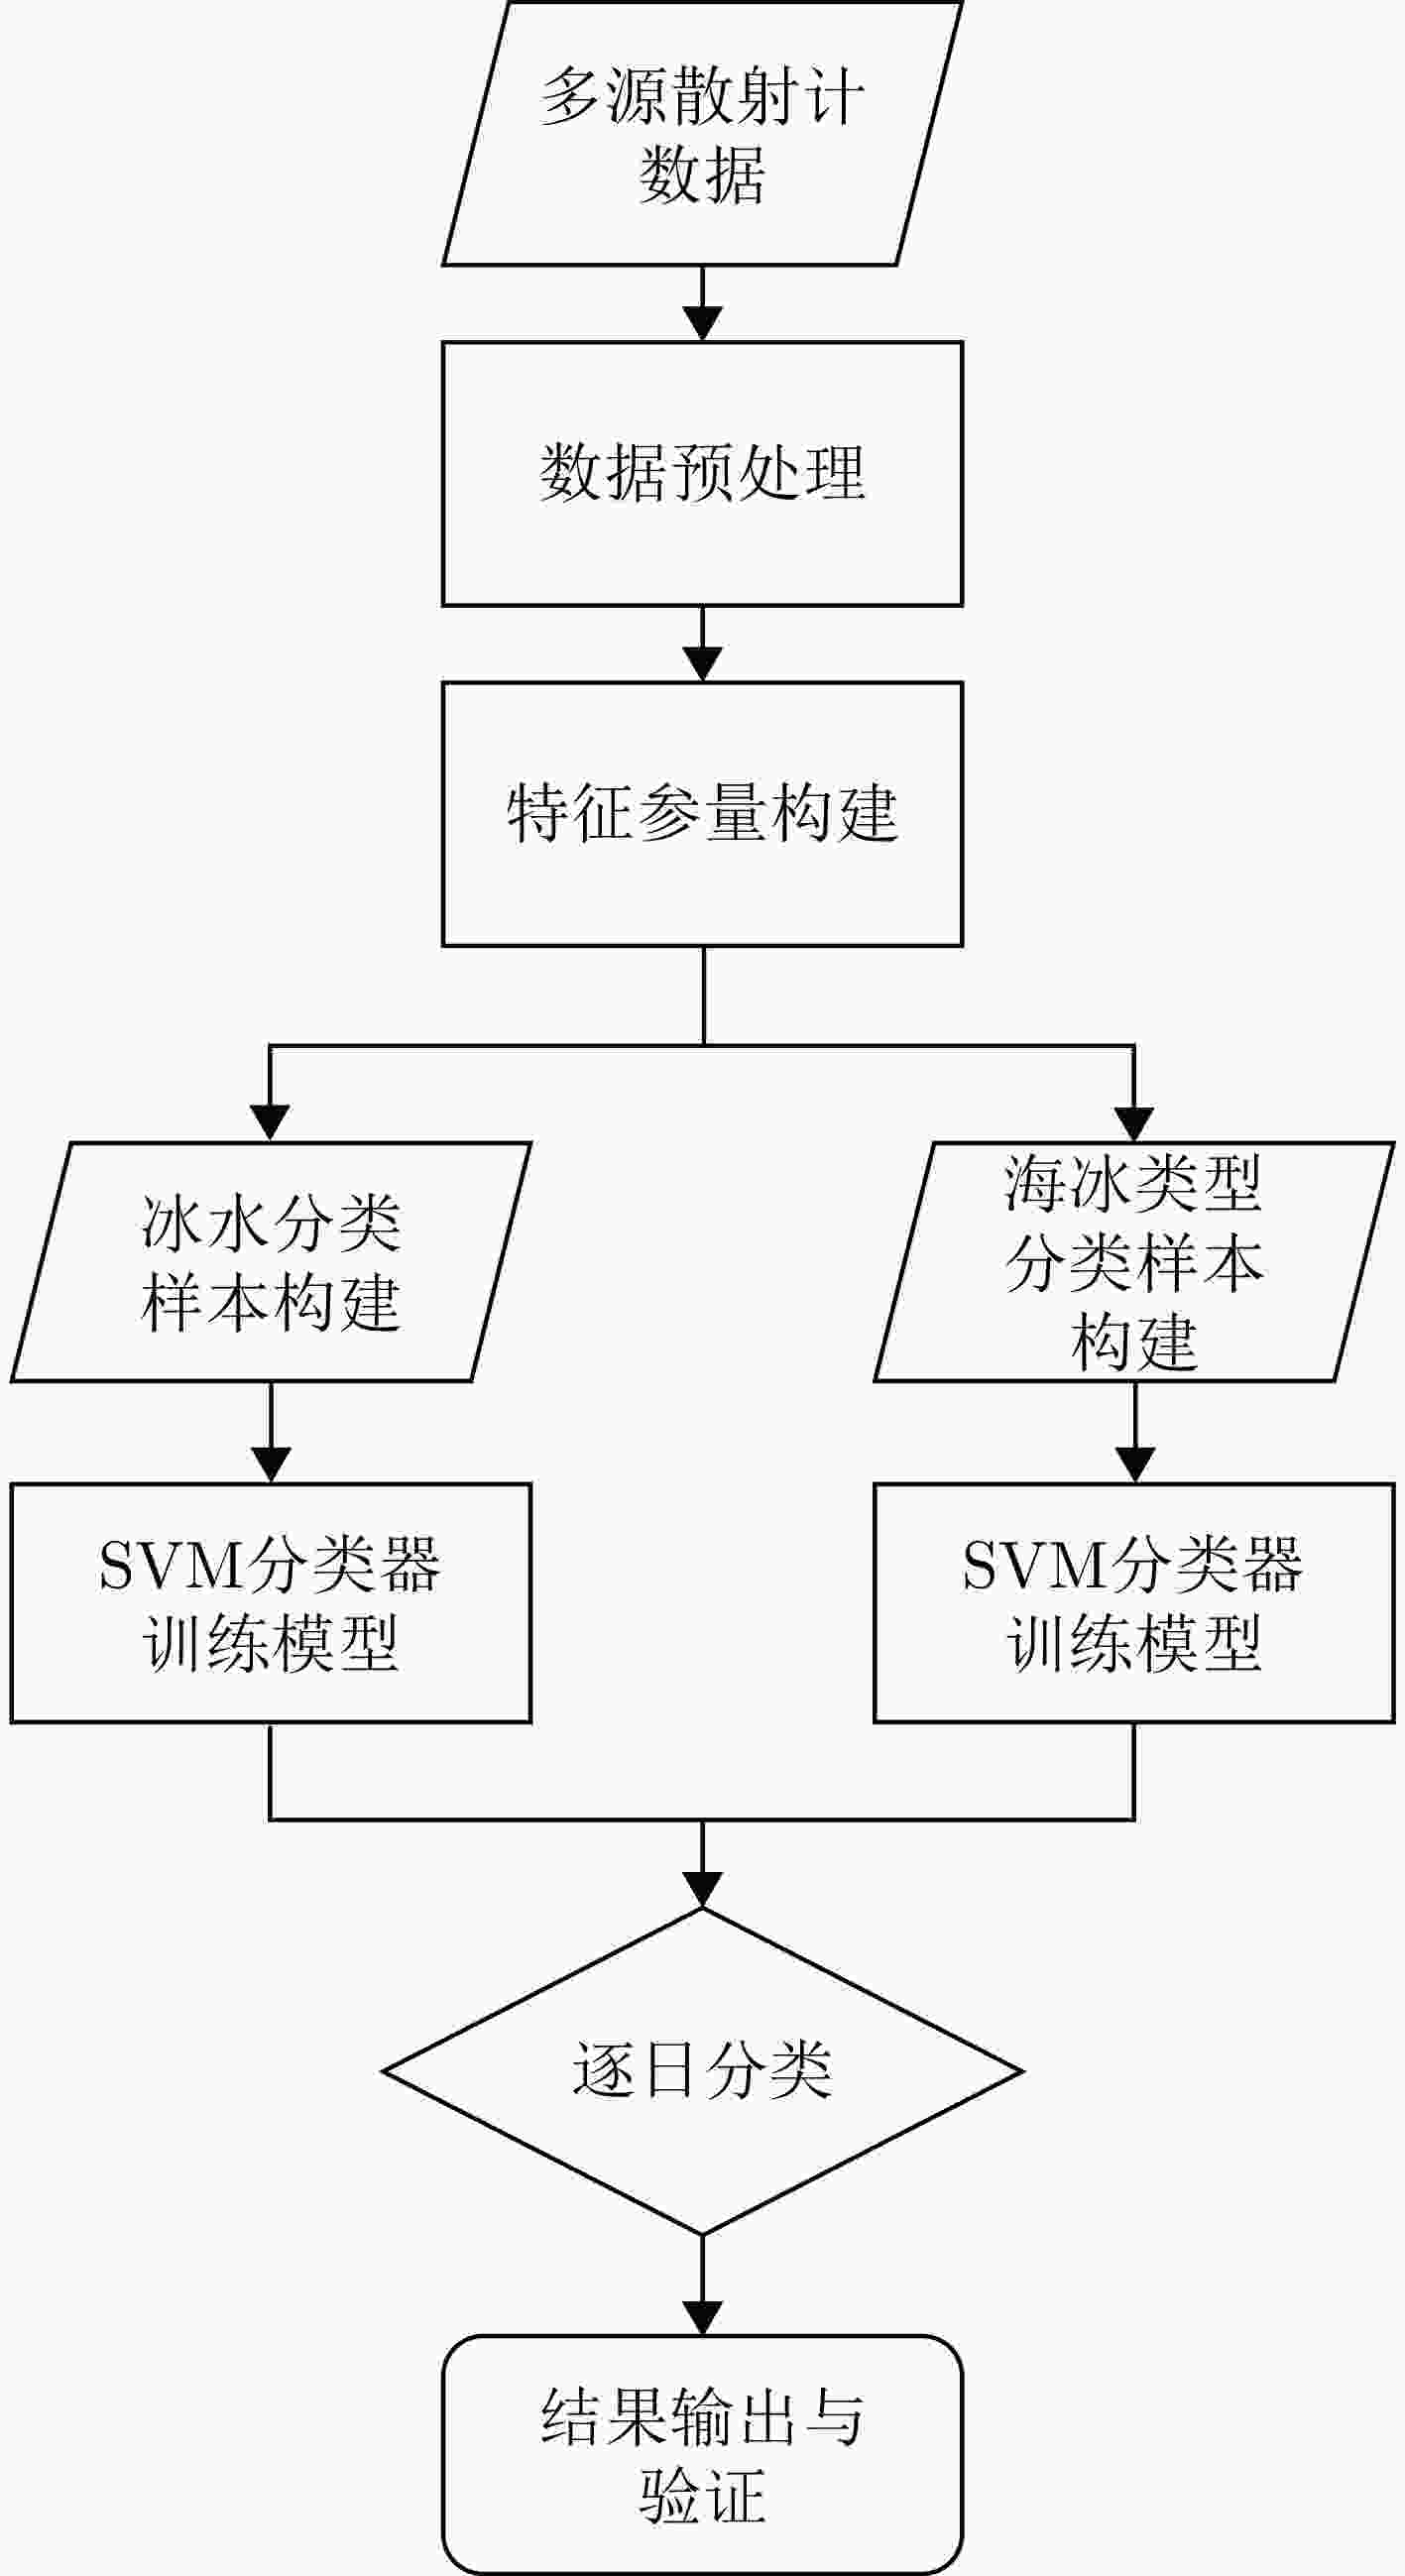
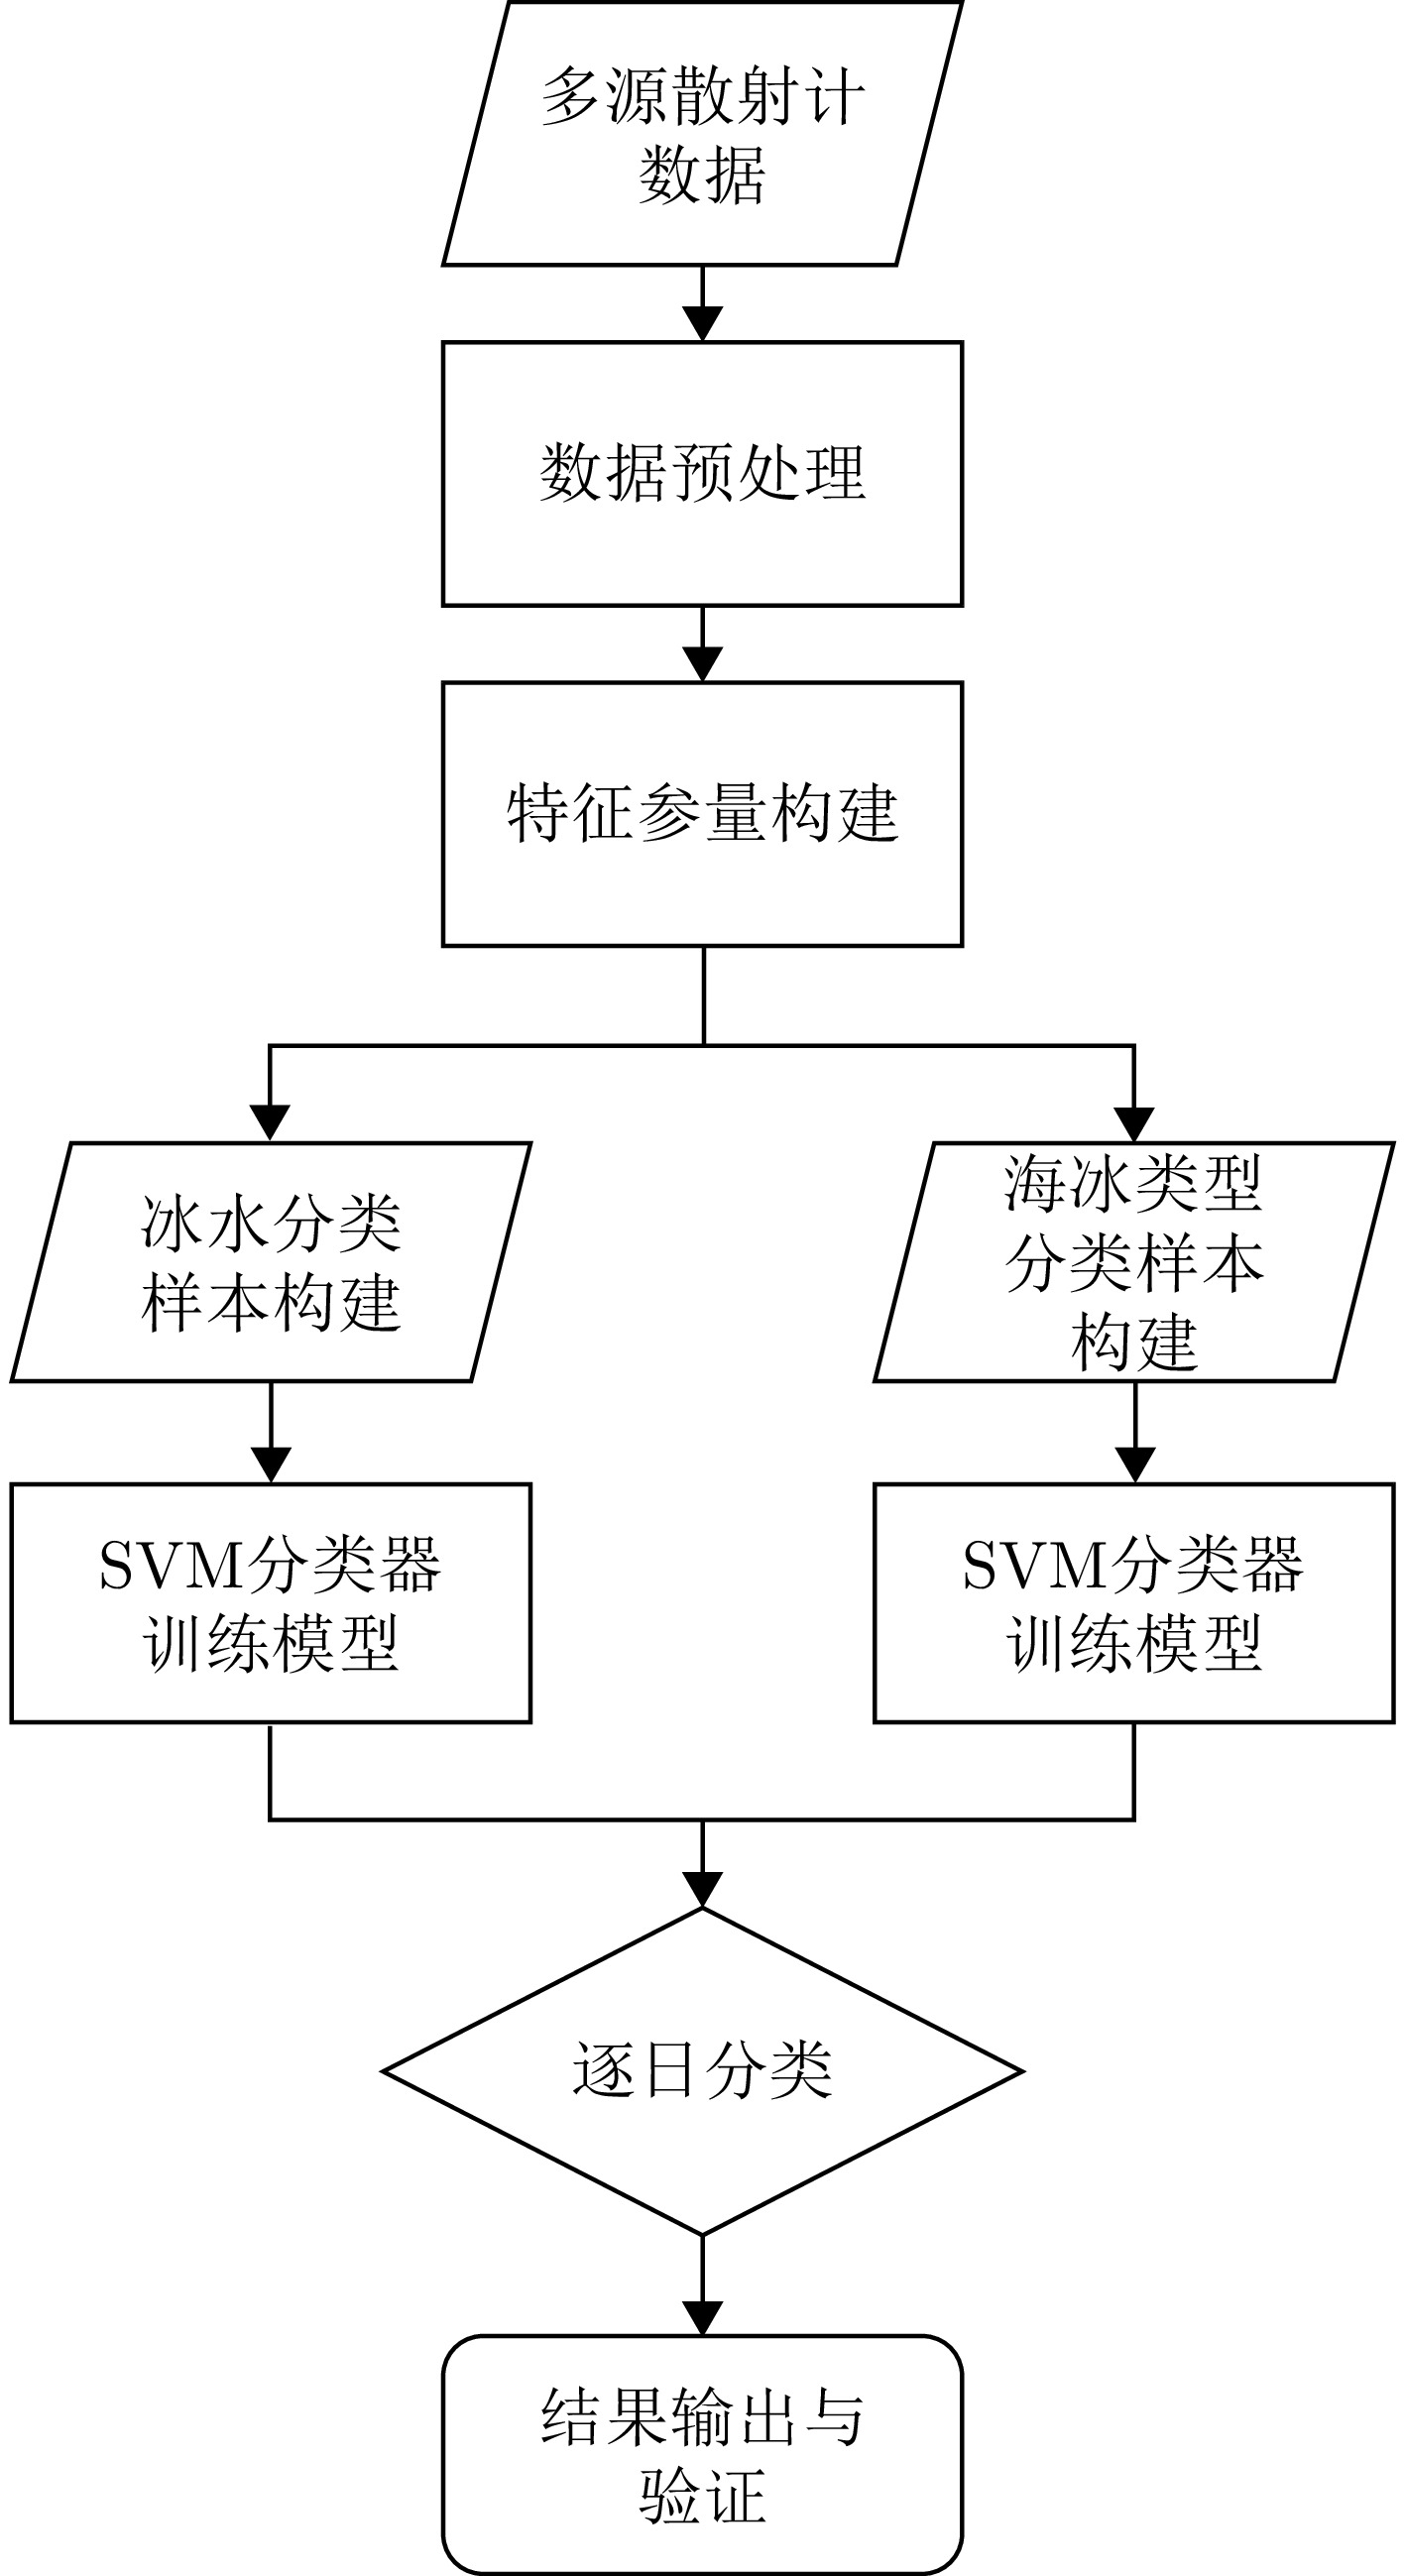
图 2 利用SVM分类器的海冰监测流程图
Figure 2. Flowchart of sea ice monitoring using the SVM classifier
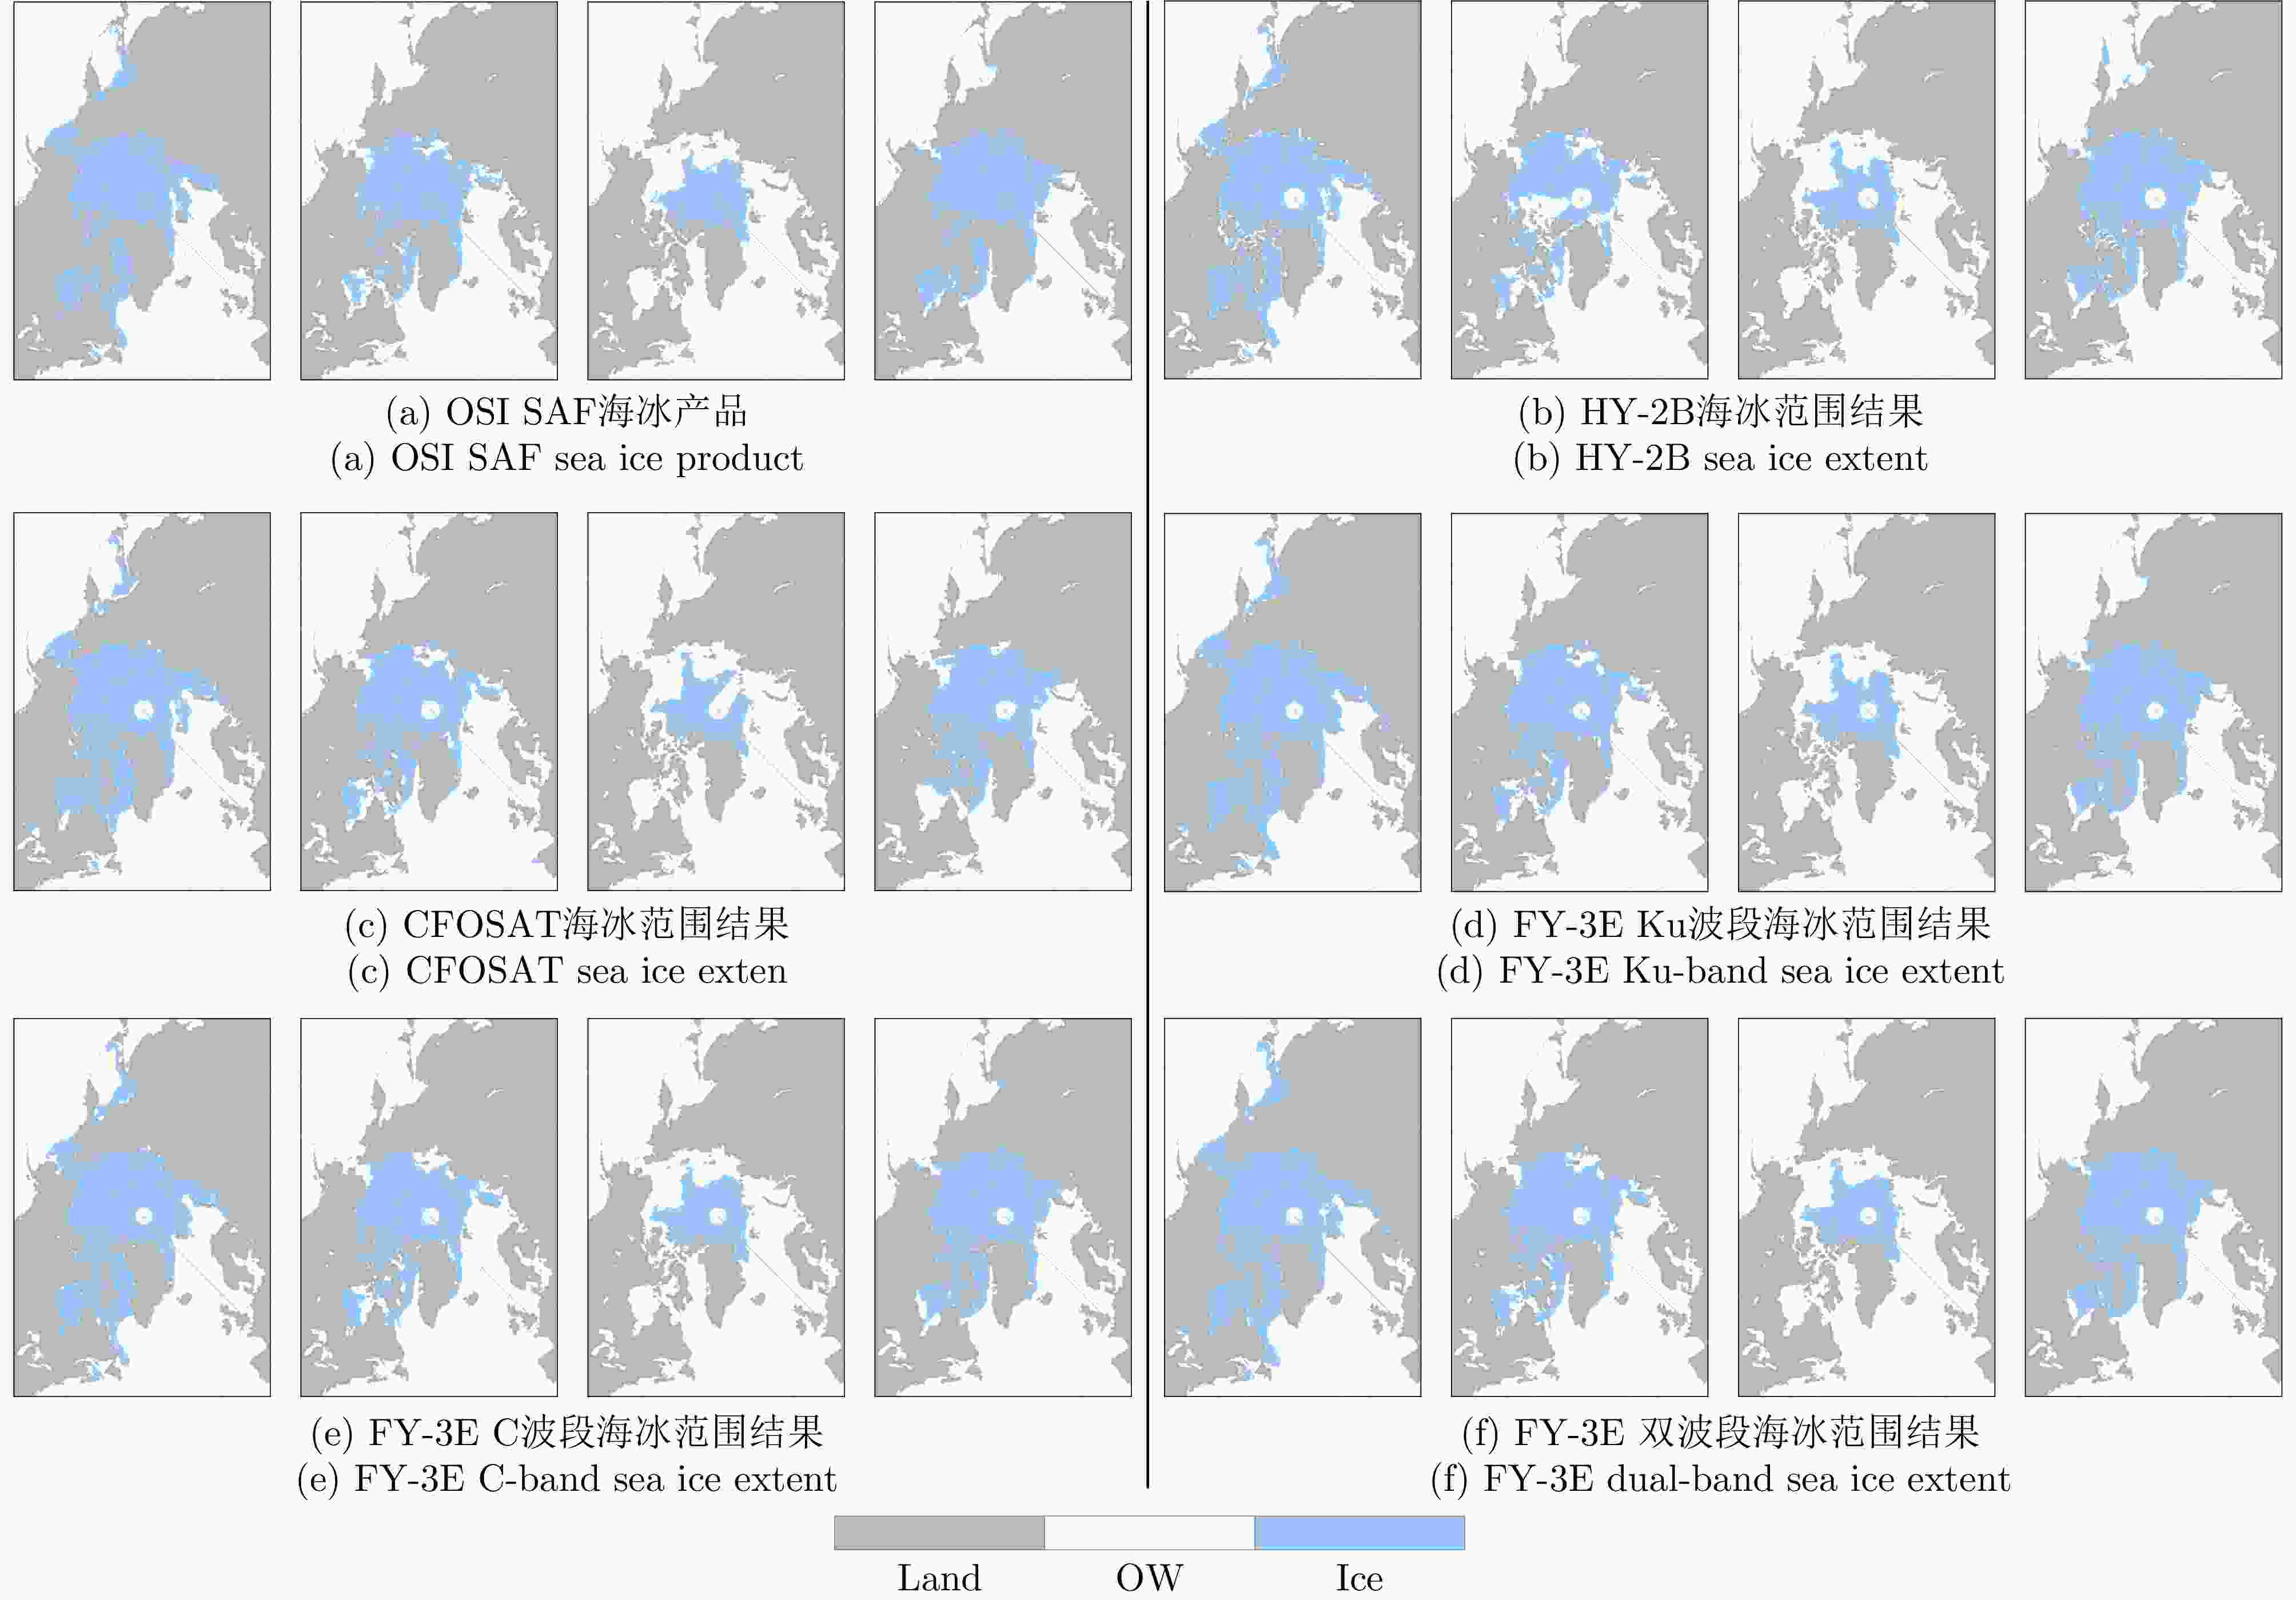
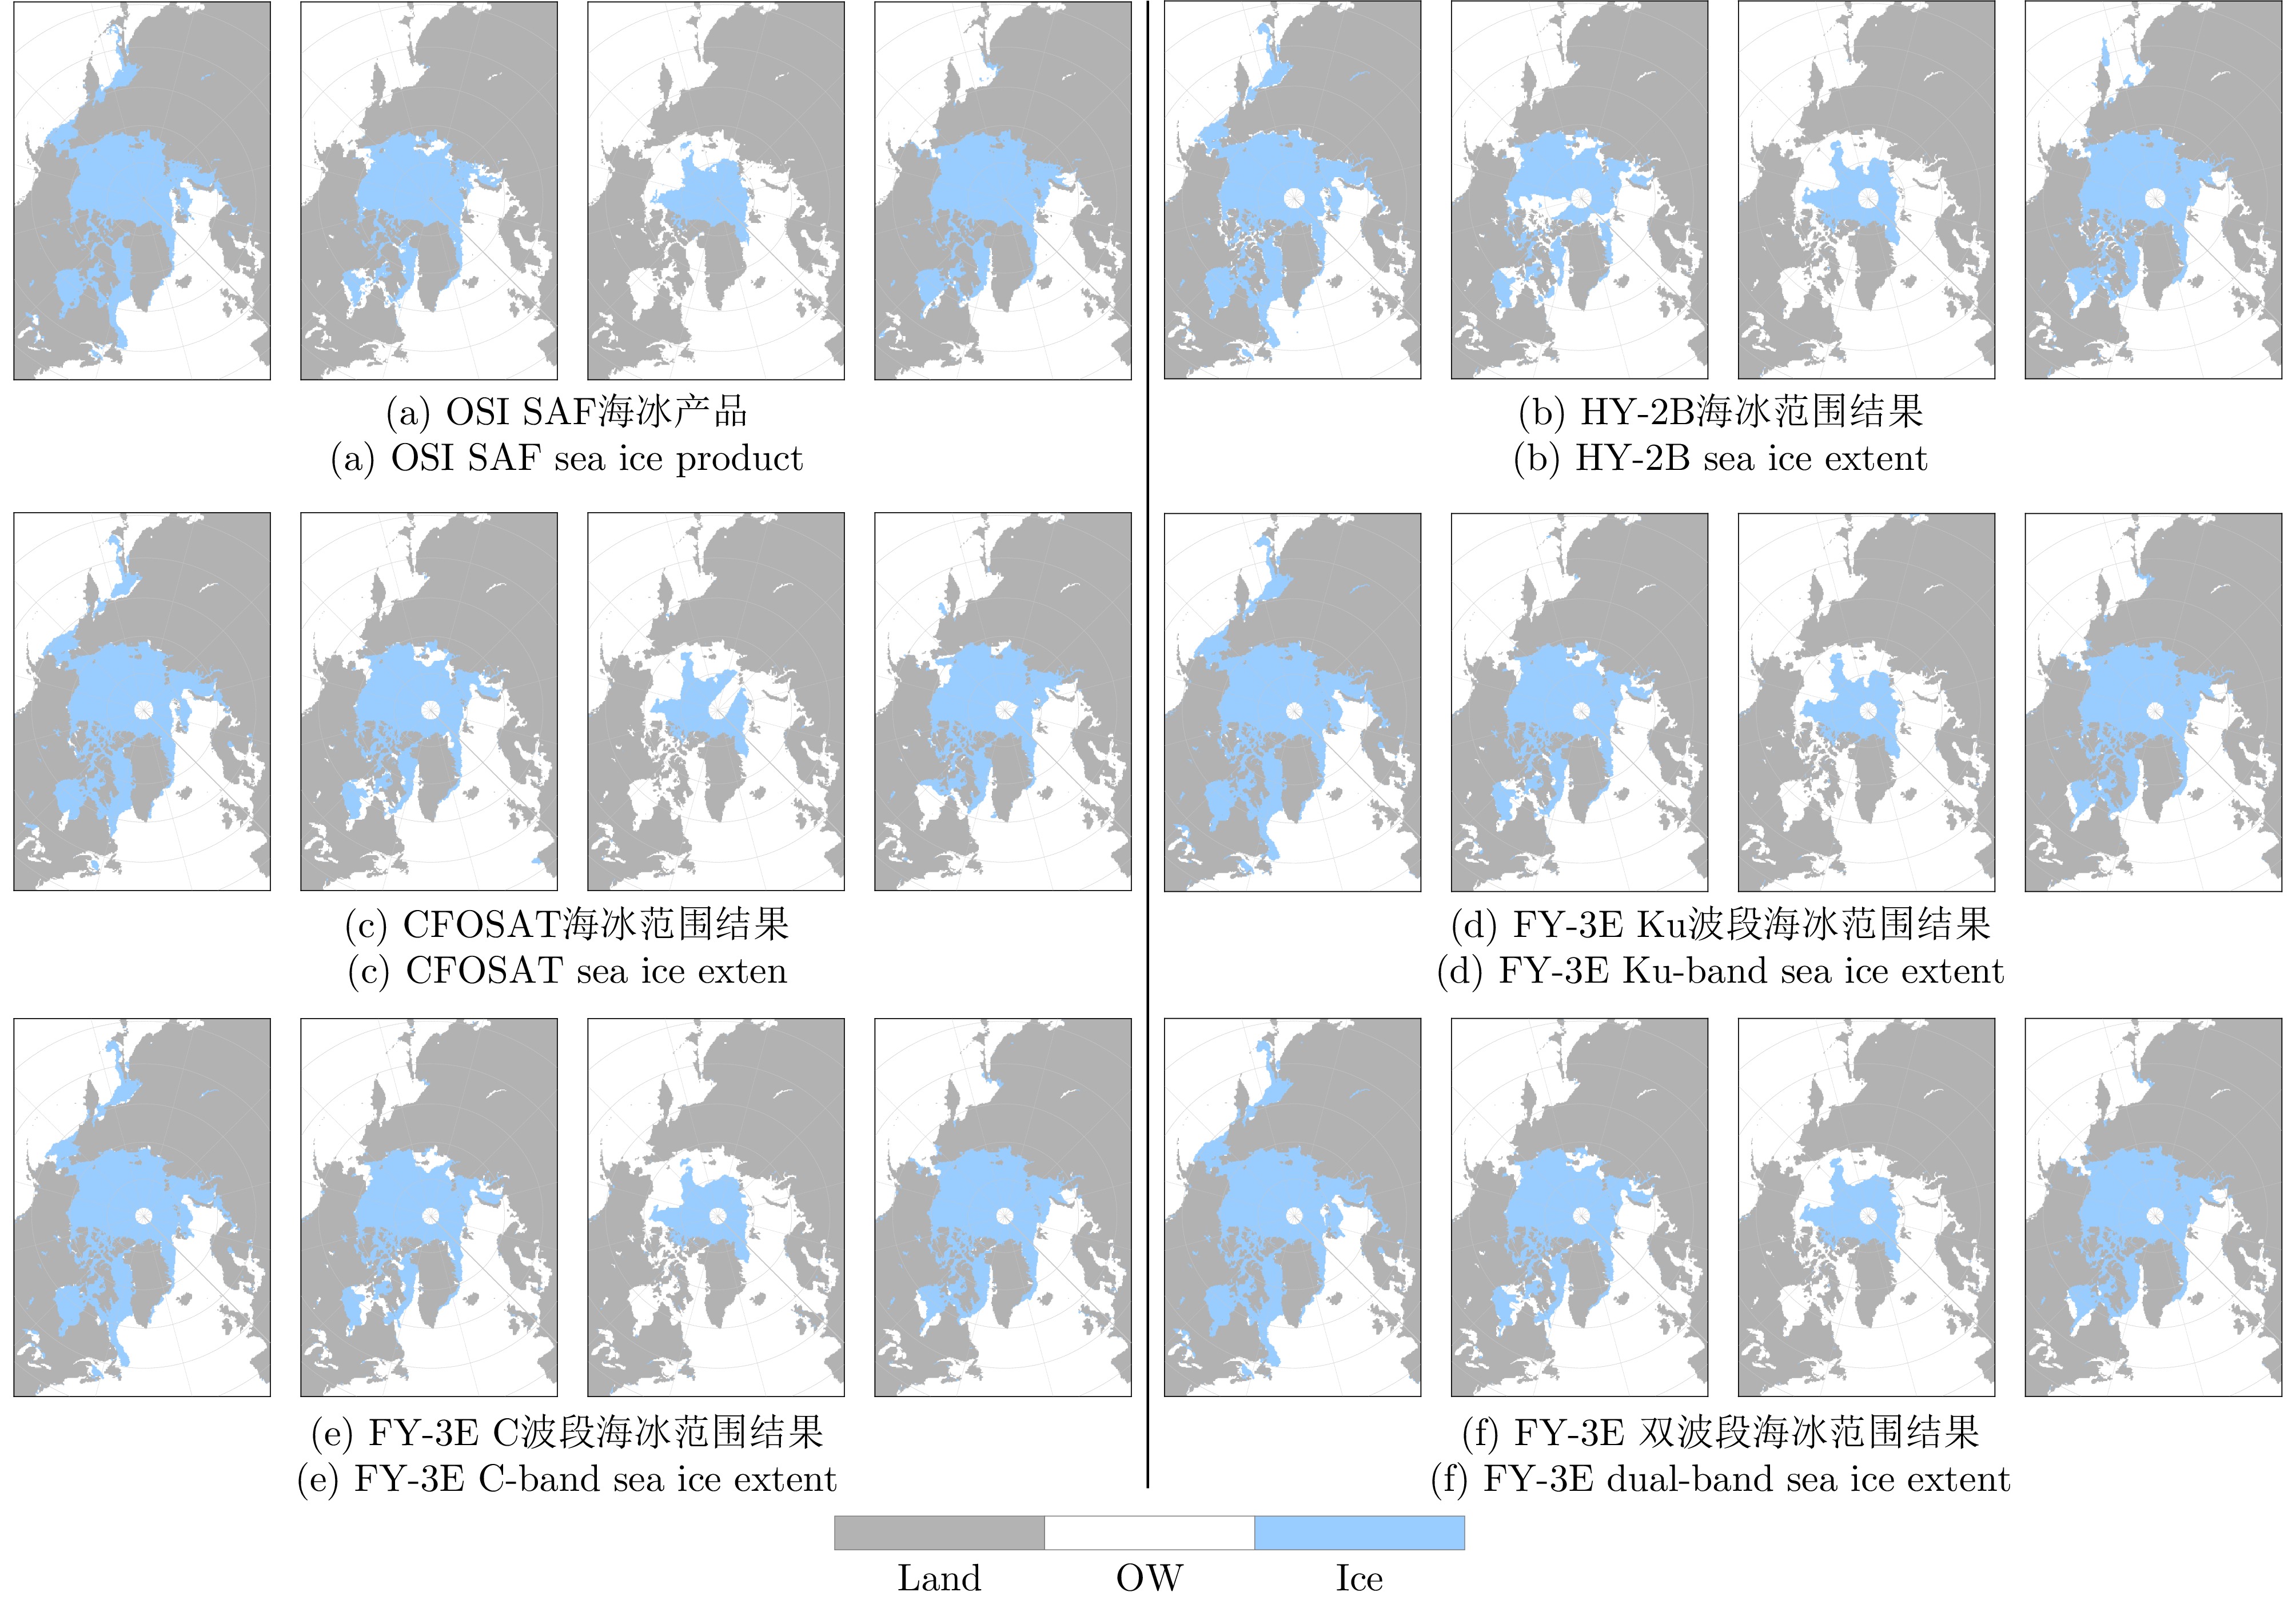
图 4 2022年3月15日、6月15日、9月15日和12月15日不同散射计海冰范围结果
Figure 4. Sea ice extent results from different scatterometers on 15 March, 15 June, 15 September, and 15 December 2022
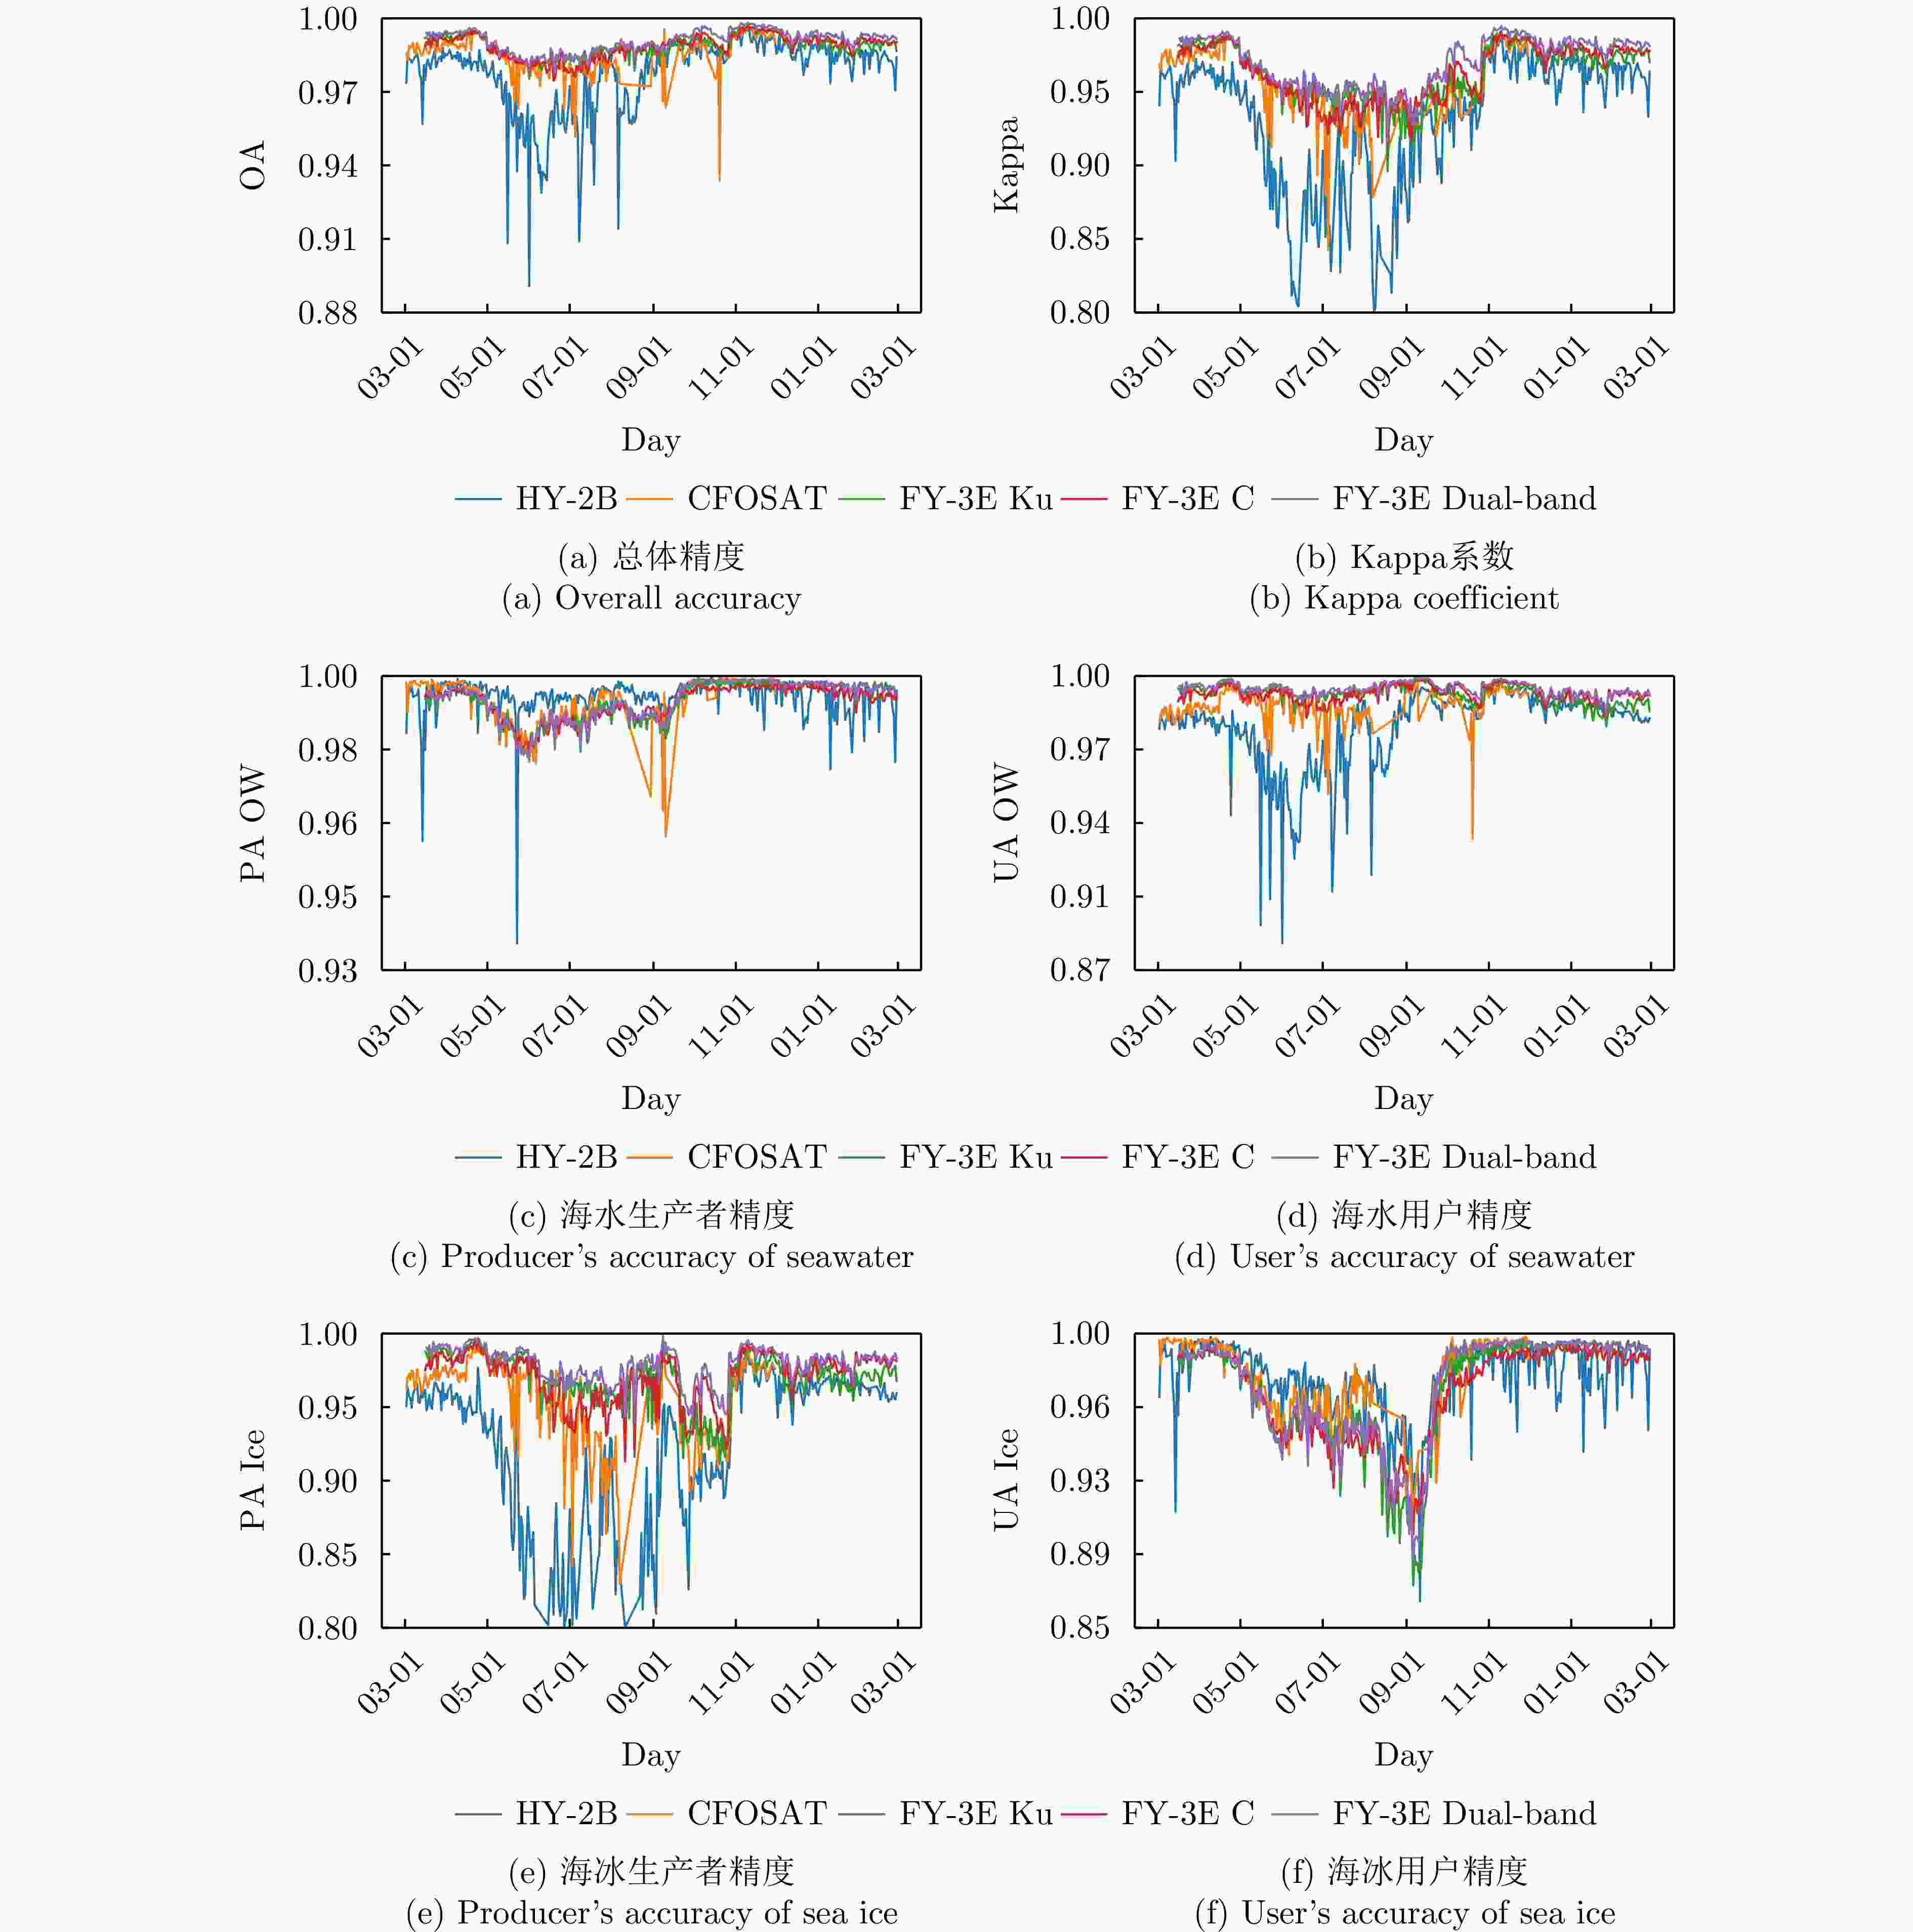
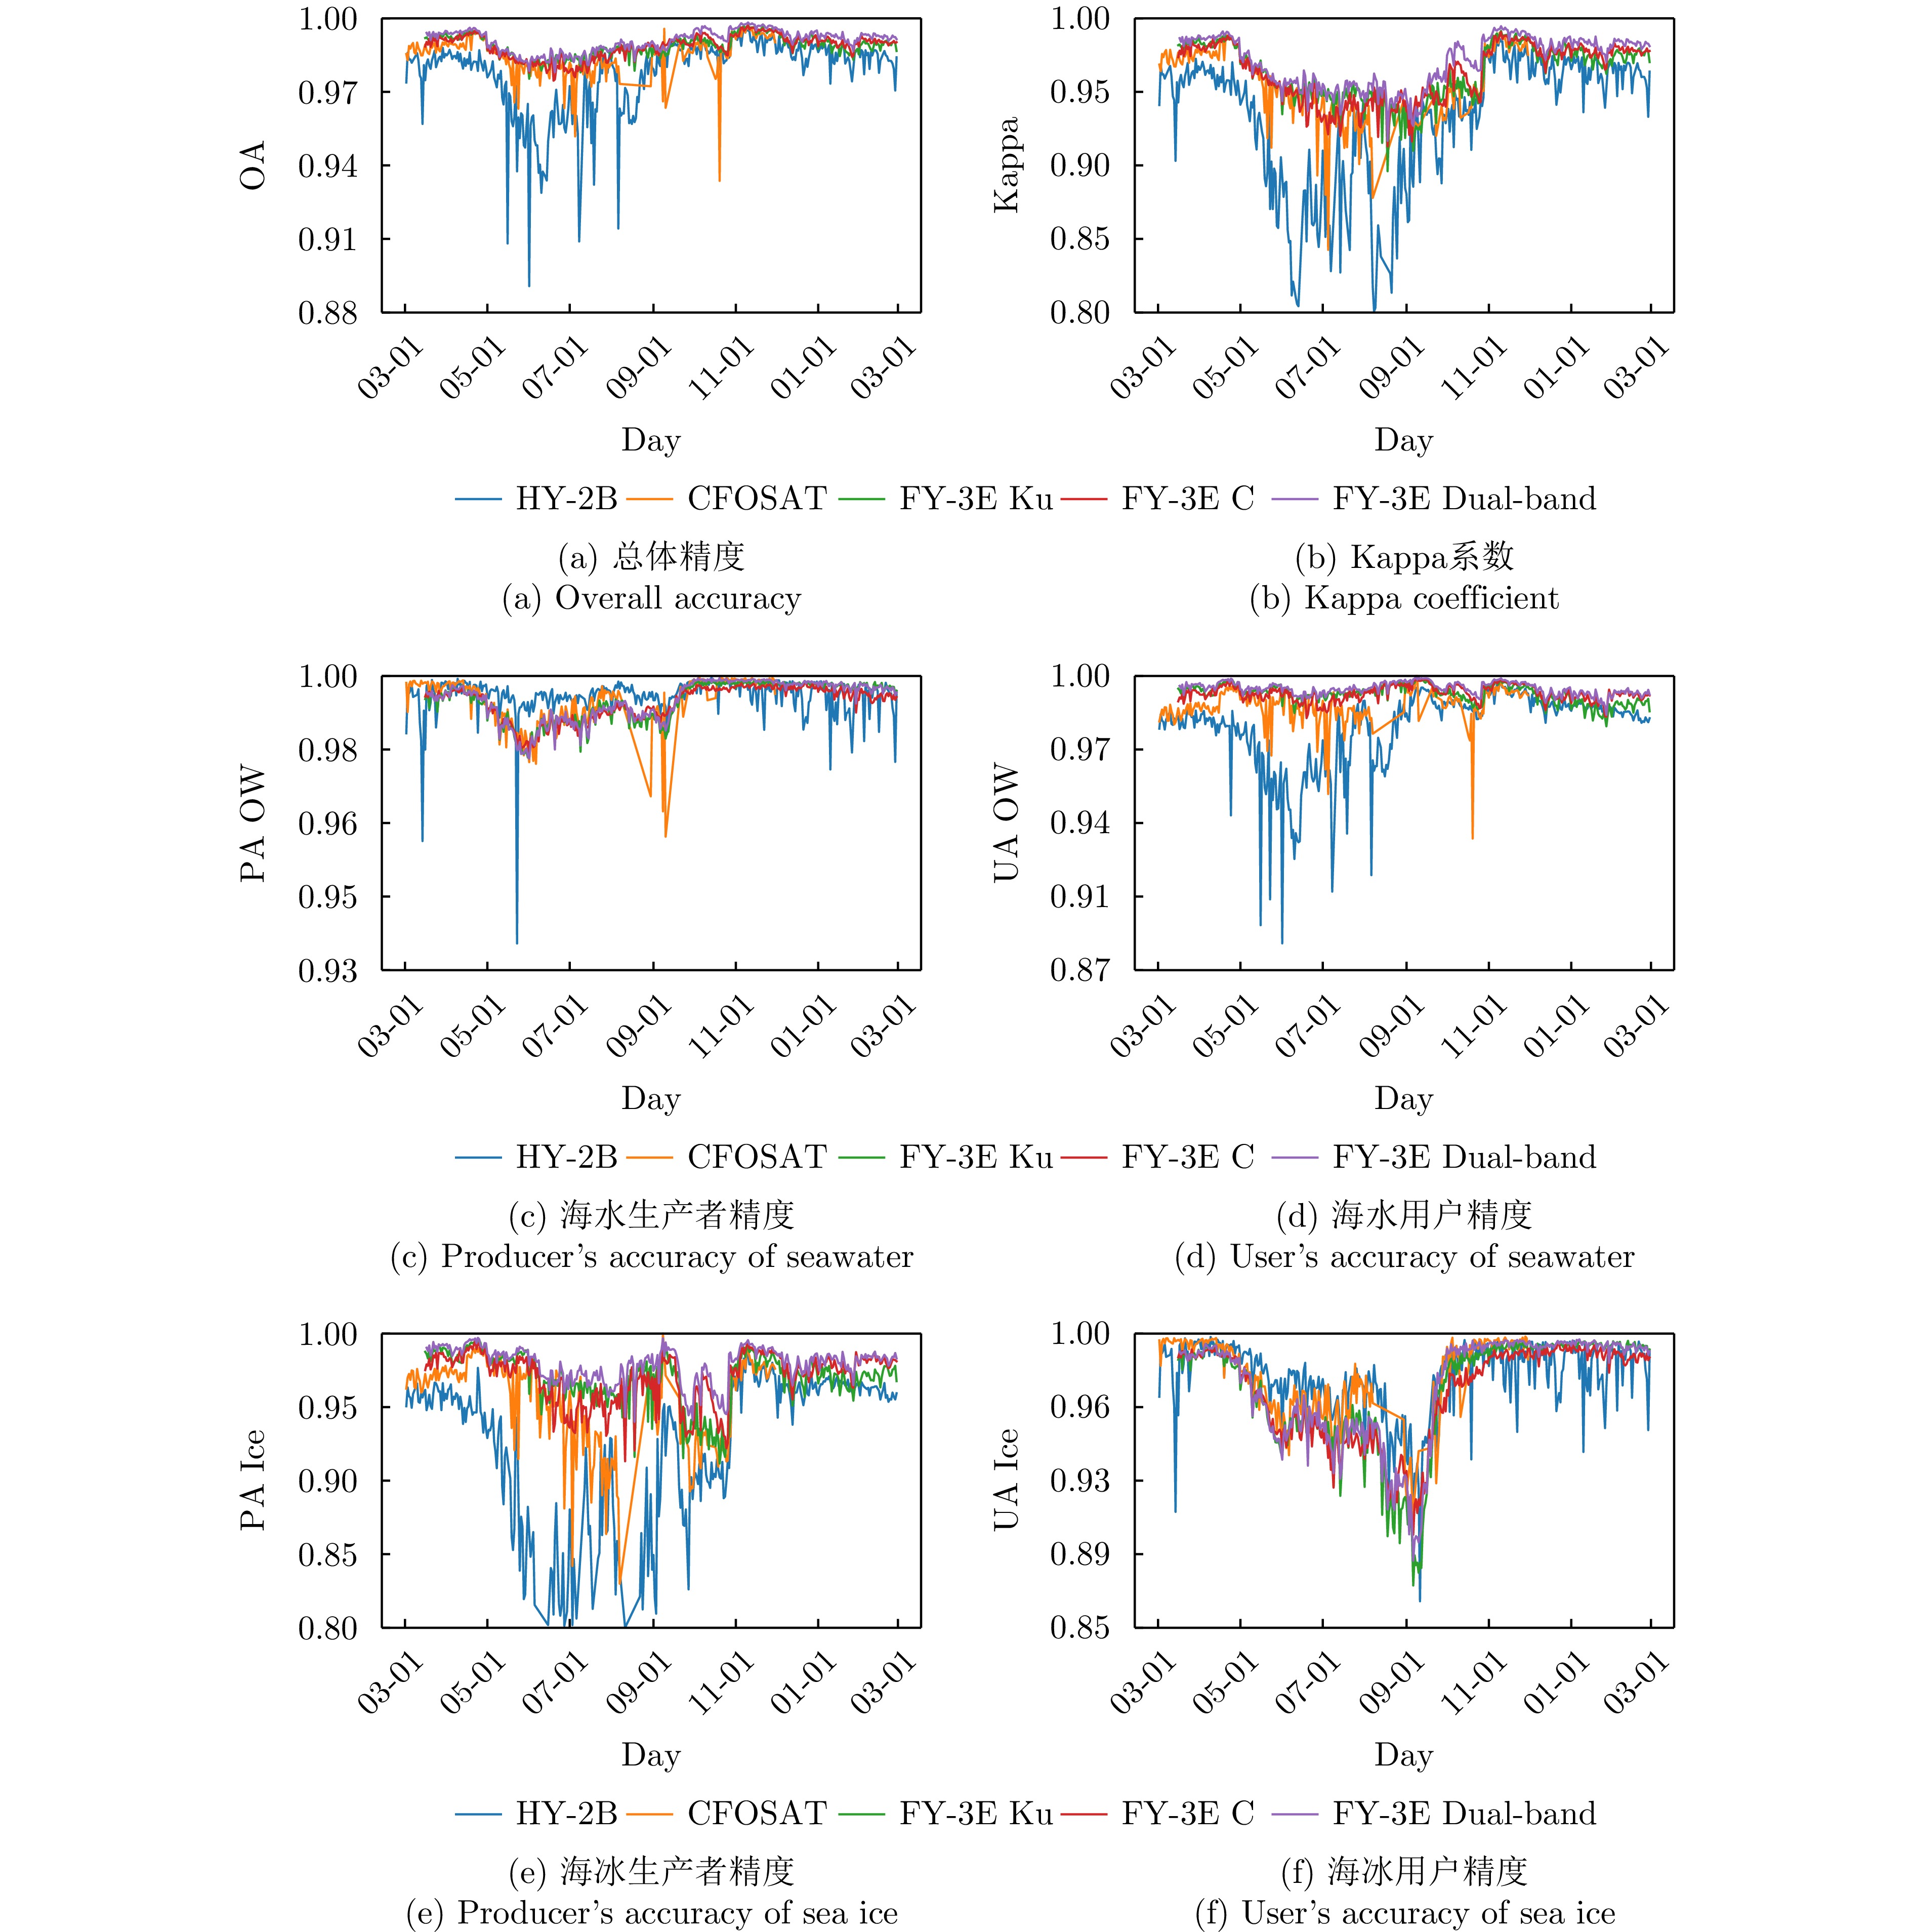
图 5 2022年3月至2023年2月间北极地区冰水区分结果的评估参数
Figure 5. Evaluation metrics of ice-water classification results over the Arctic region from March 2022 to February 2023
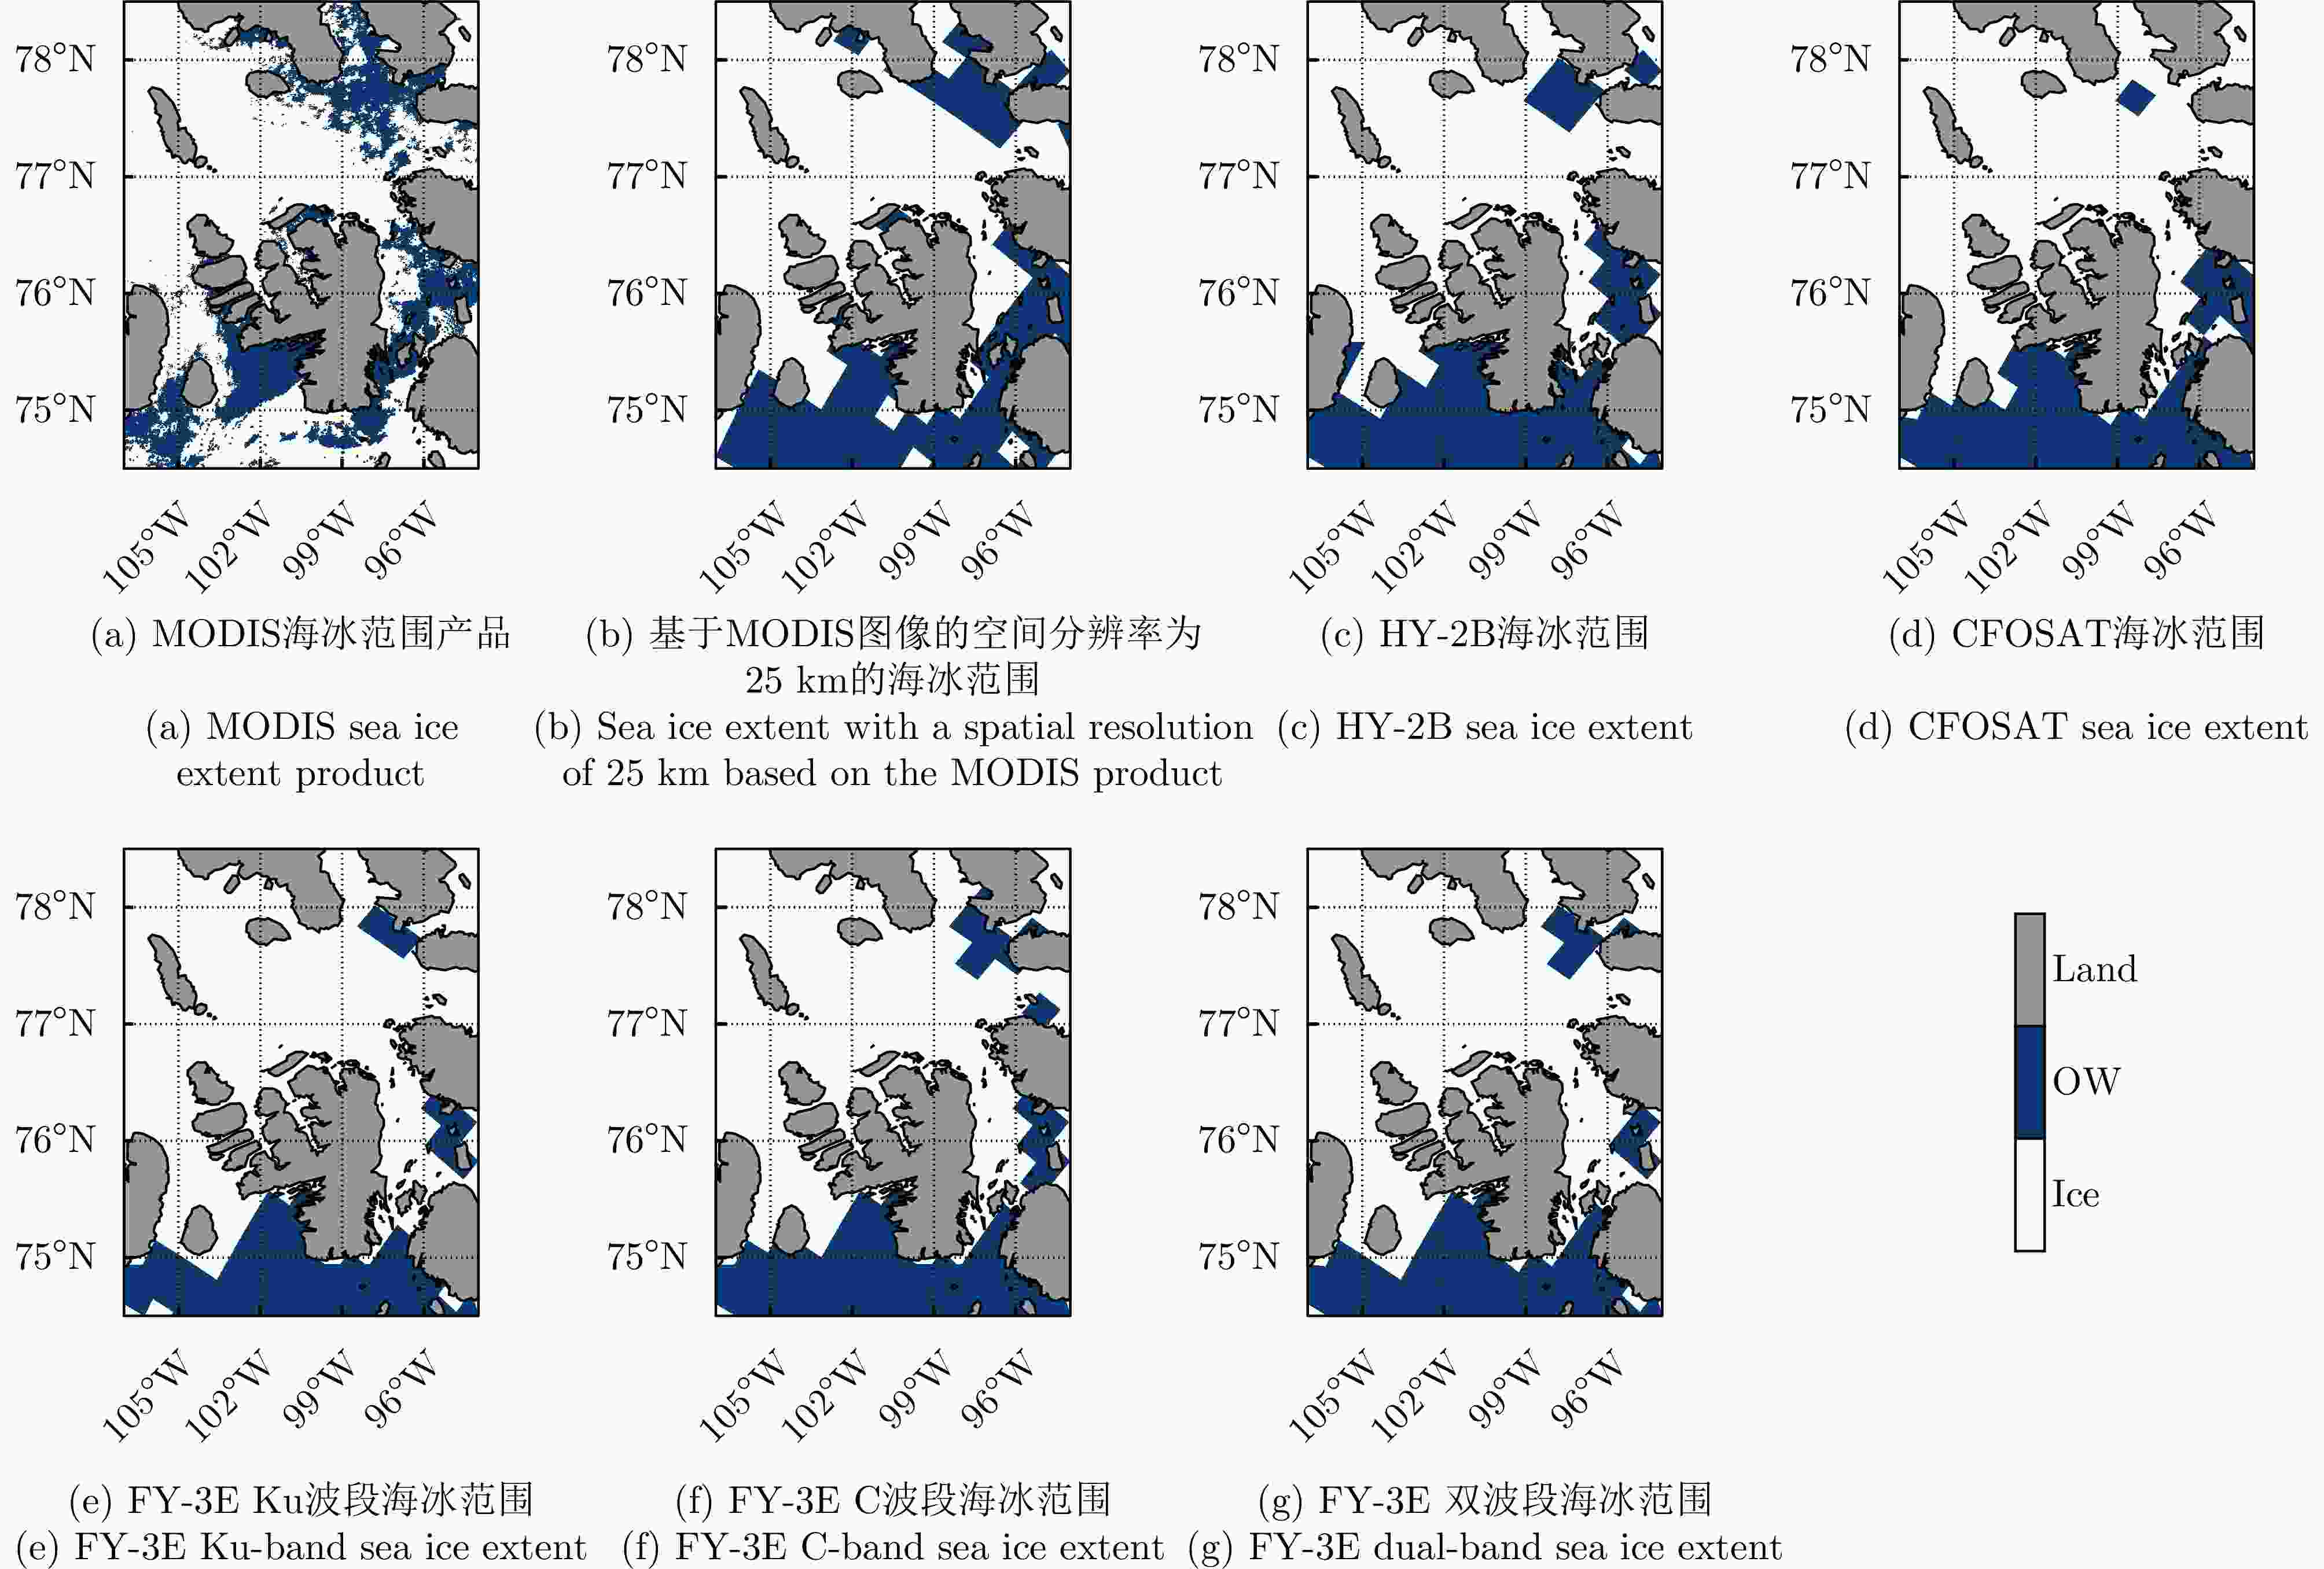
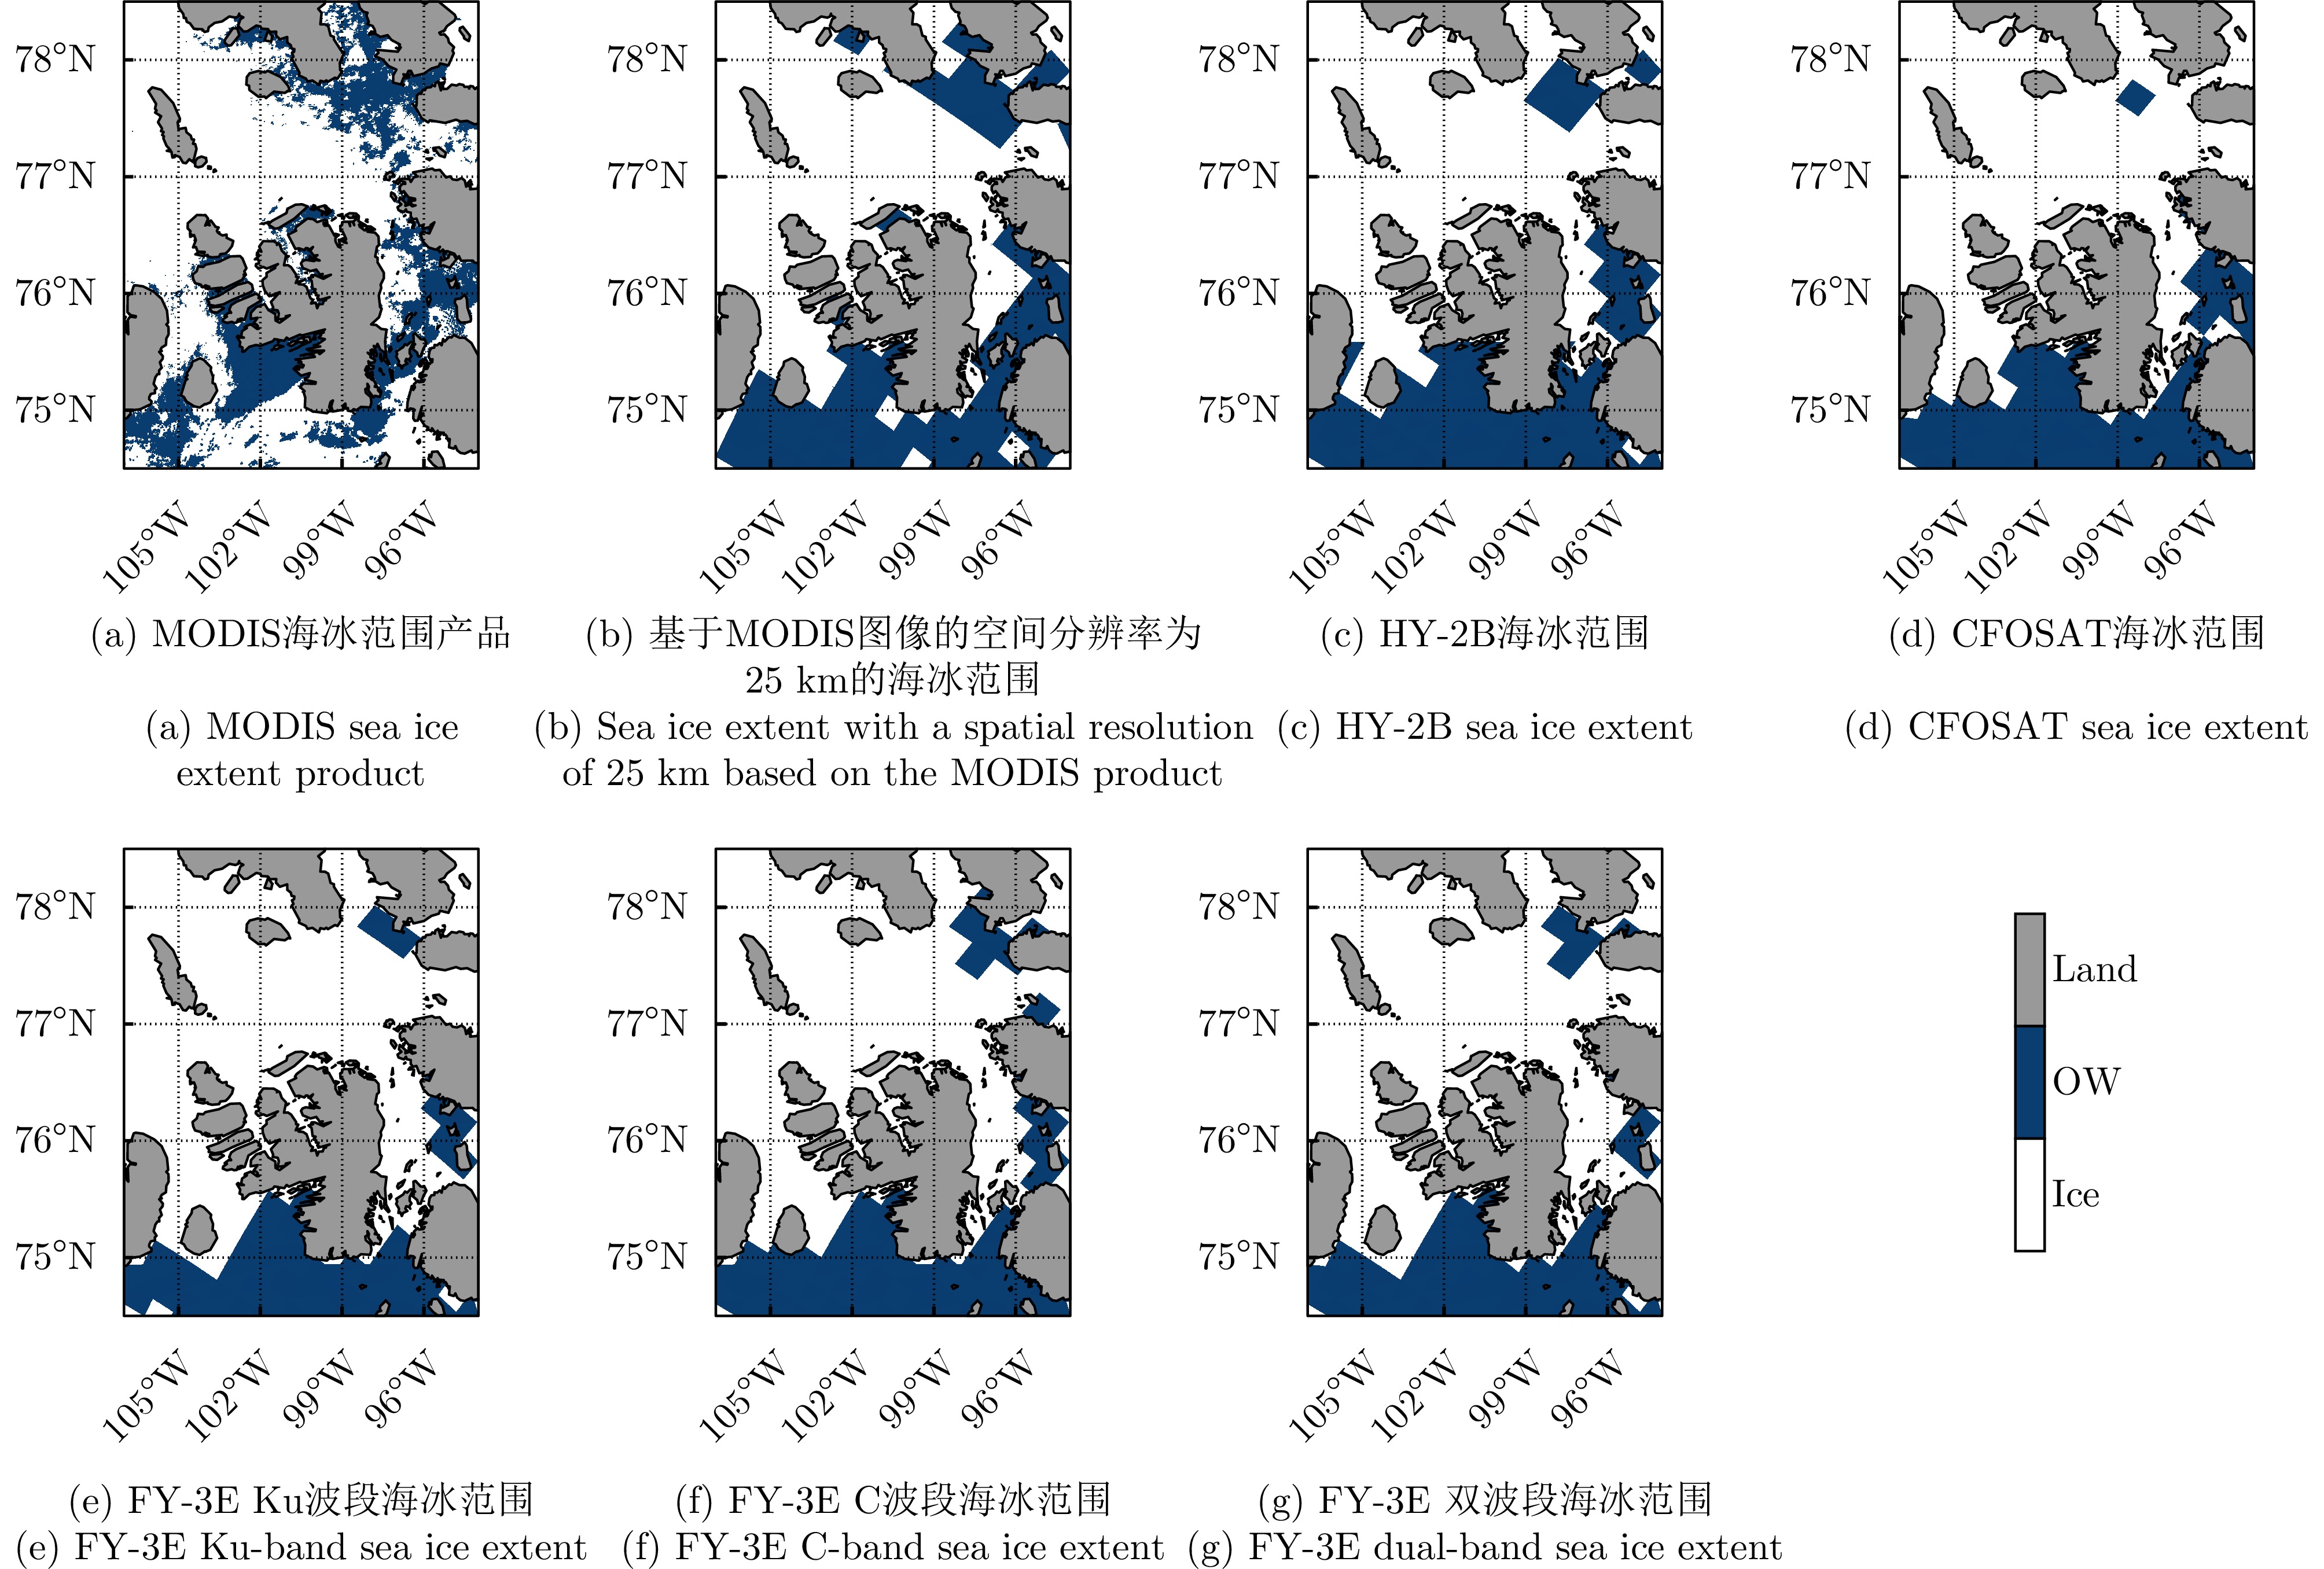
图 6 2022年9月6日MODIS海冰范围产品及加拿大群岛附近的海冰分布
Figure 6. MODIS sea ice extent product and sea ice distribution near the Canadian Archipelago on 6 September 2022
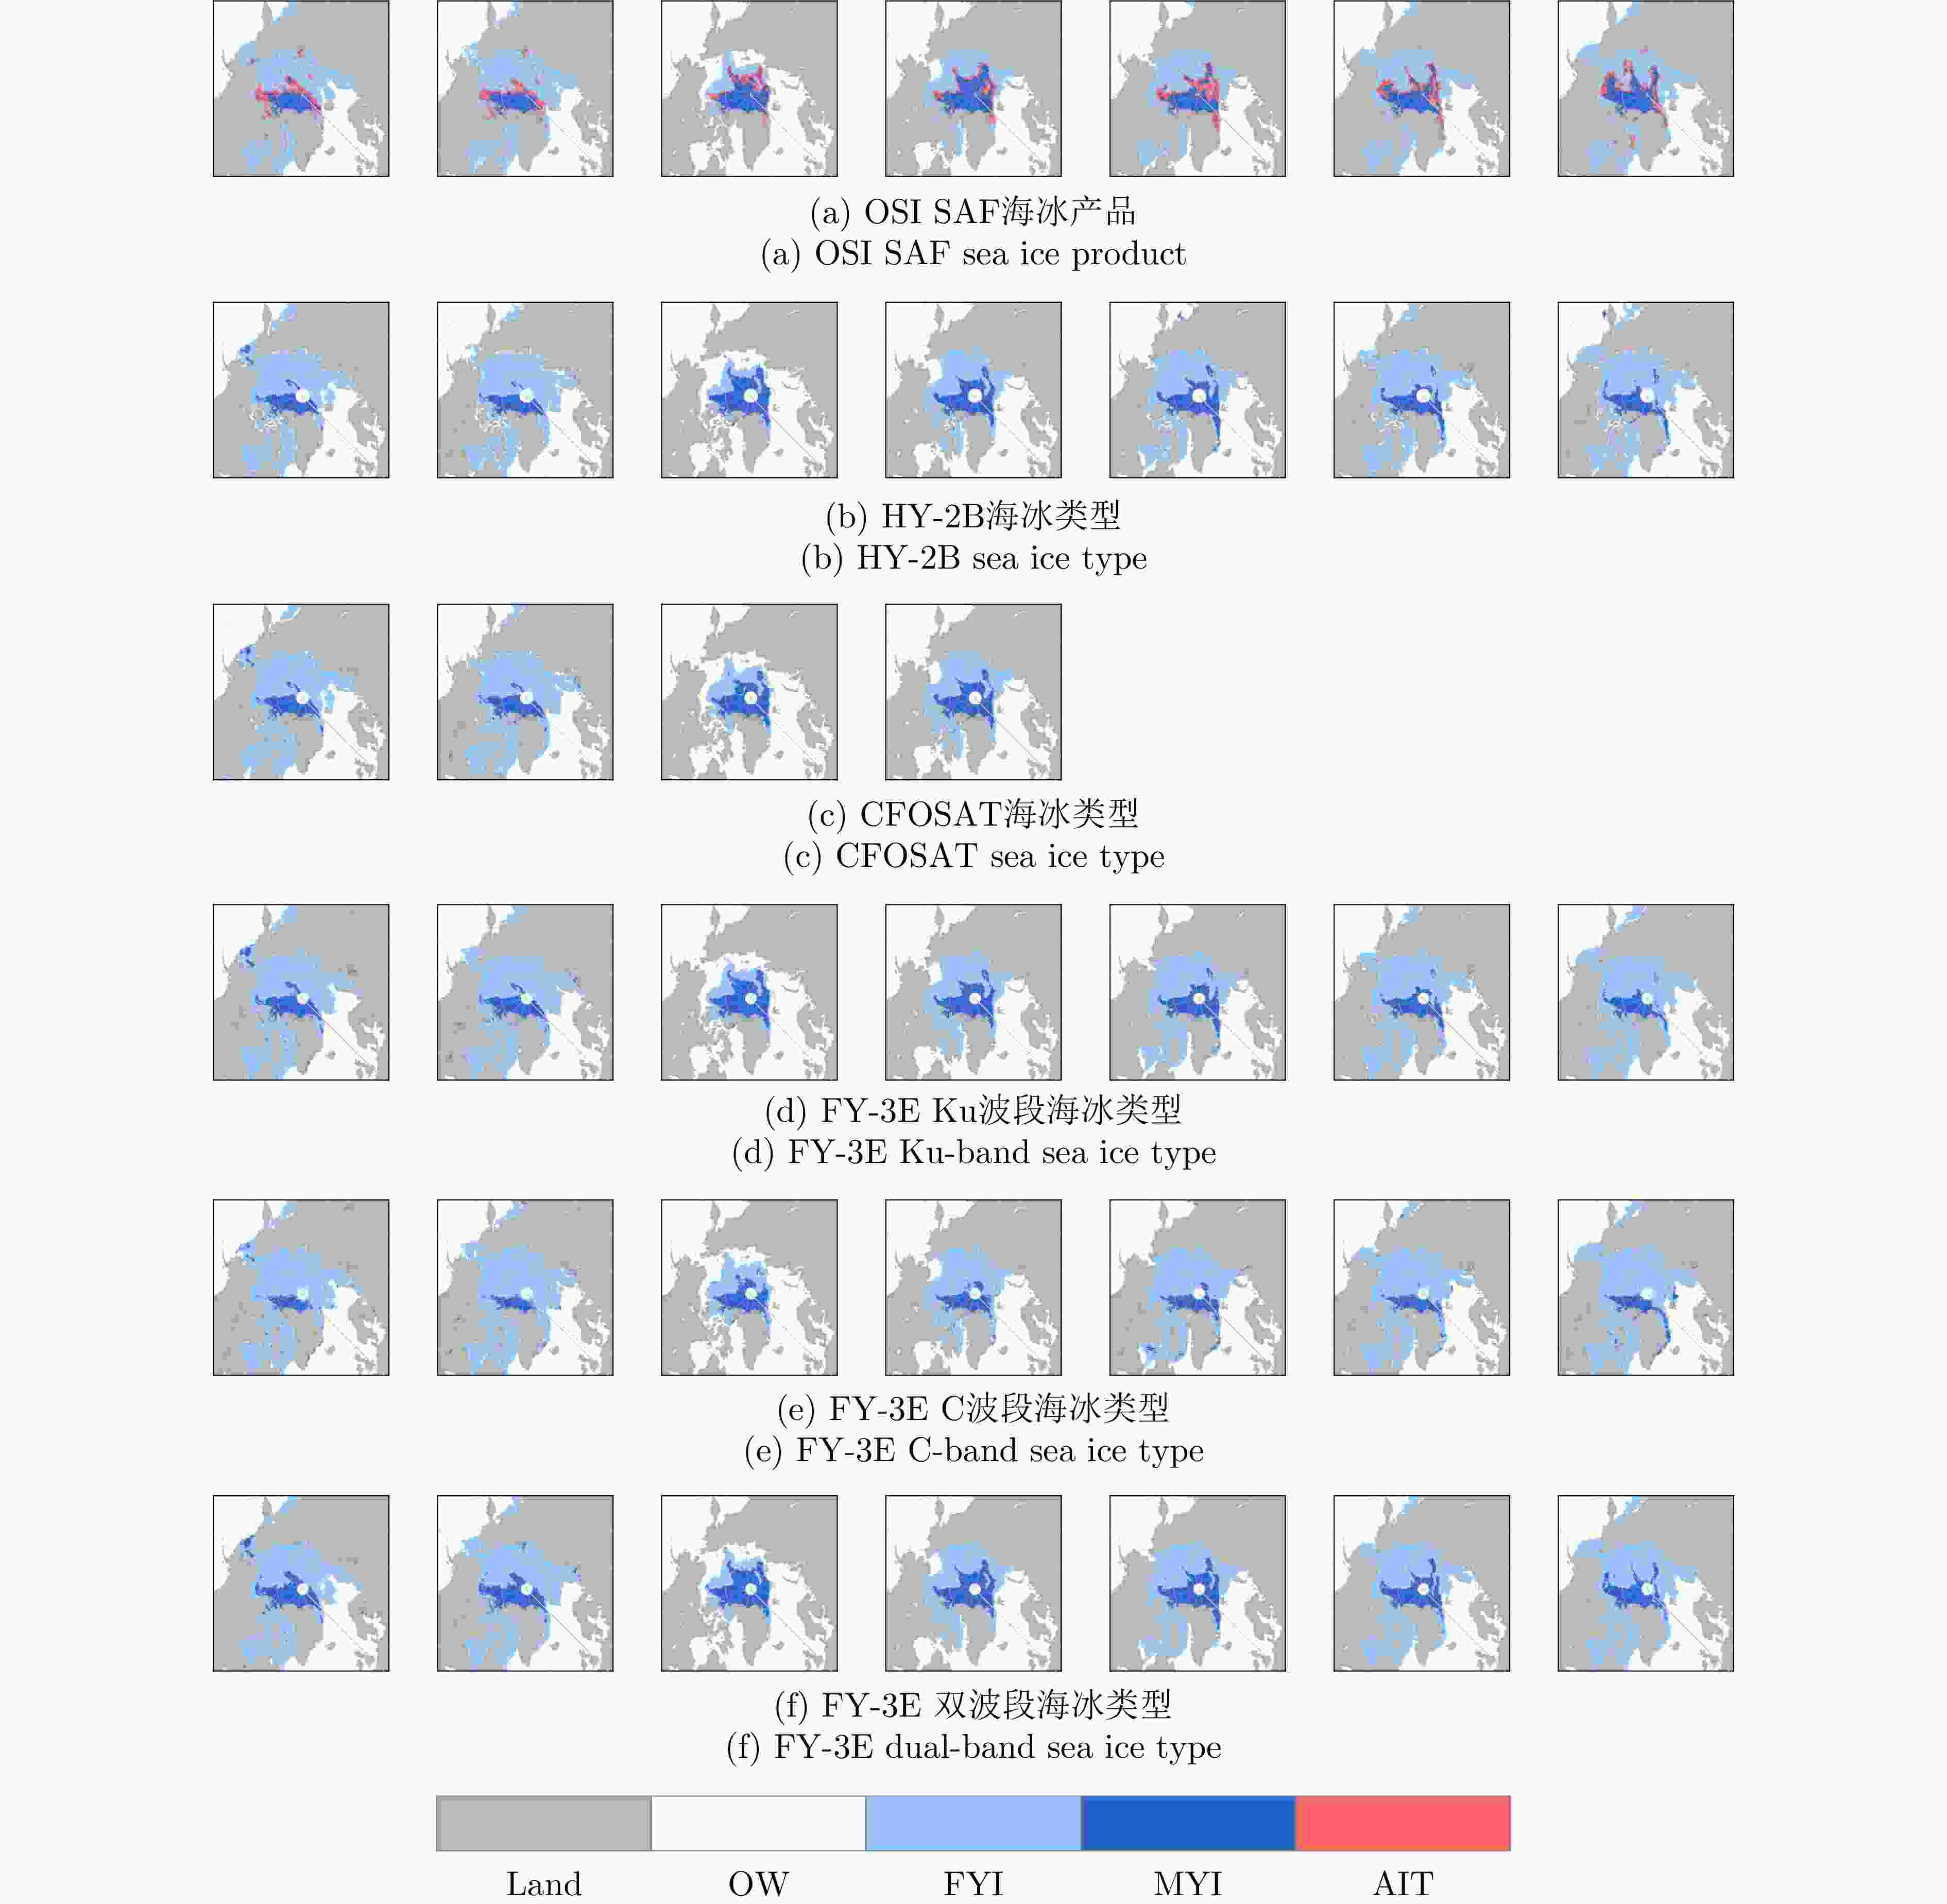
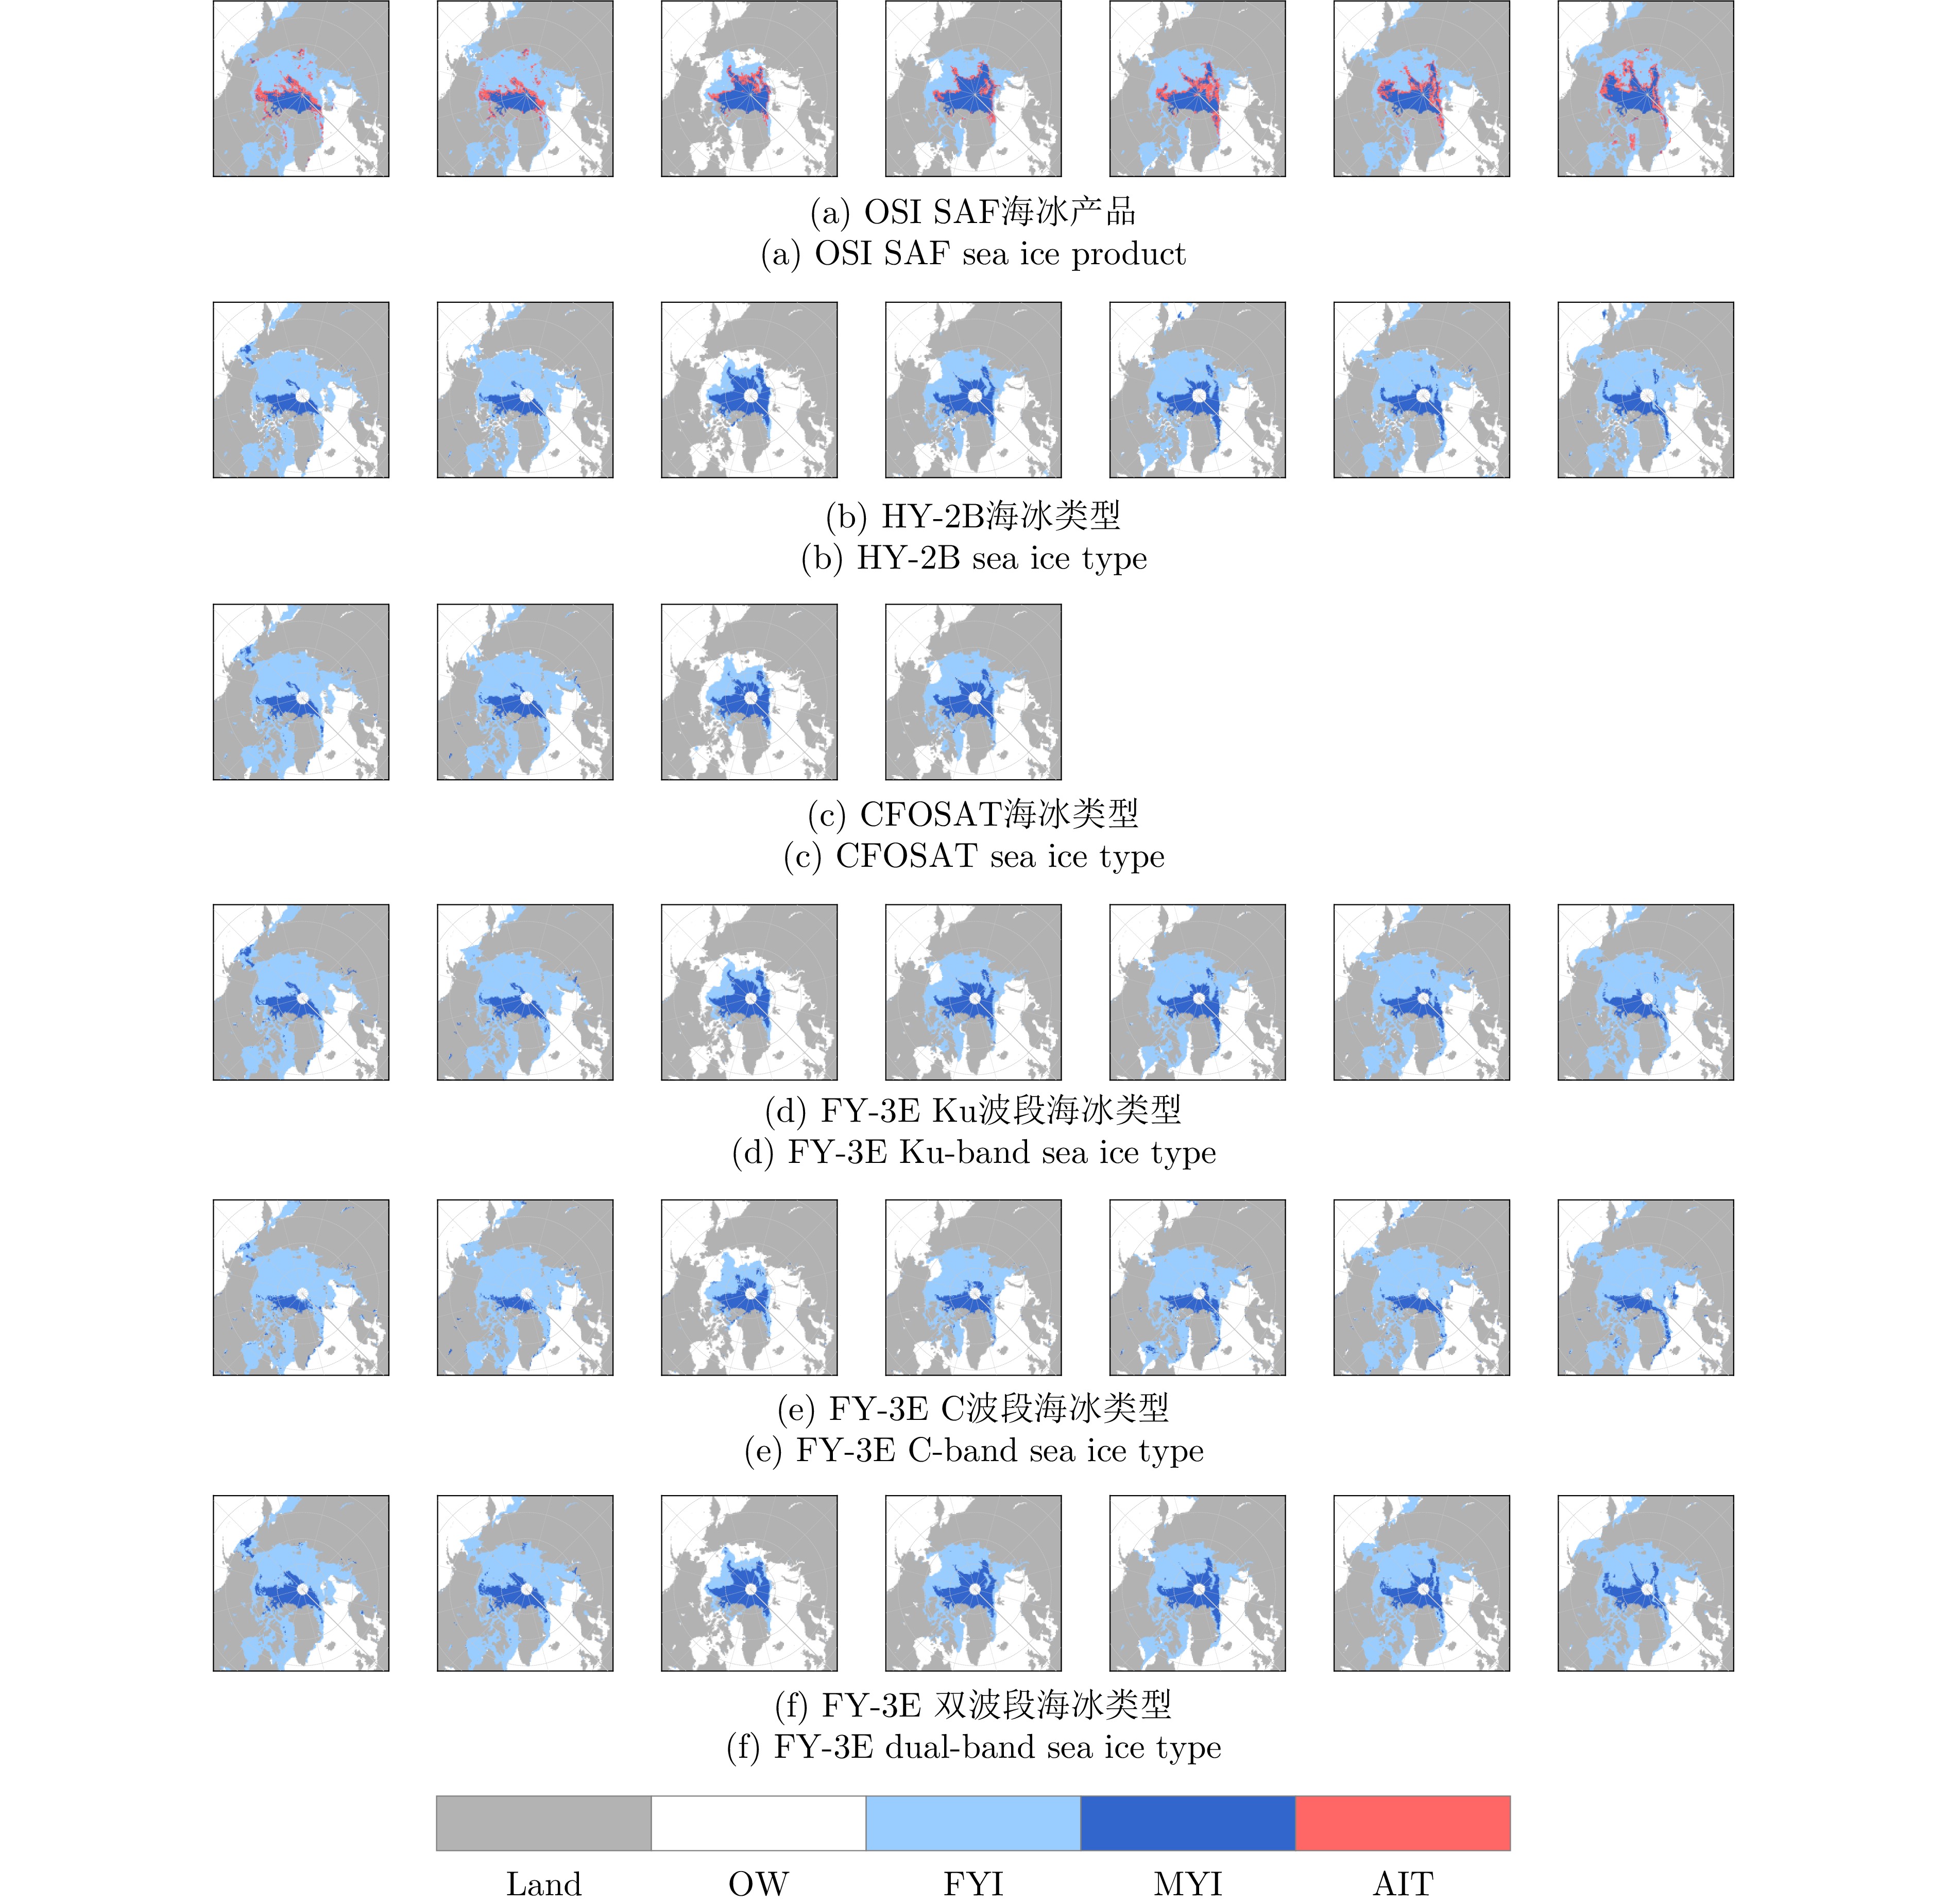
图 7 2022年3月、4月、10月至12月及2023年1月、2月不同散射计海冰类型分布
Figure 7. Sea ice type distributions from different scatterometers in March, April, and October to December 2022, January and February 2023
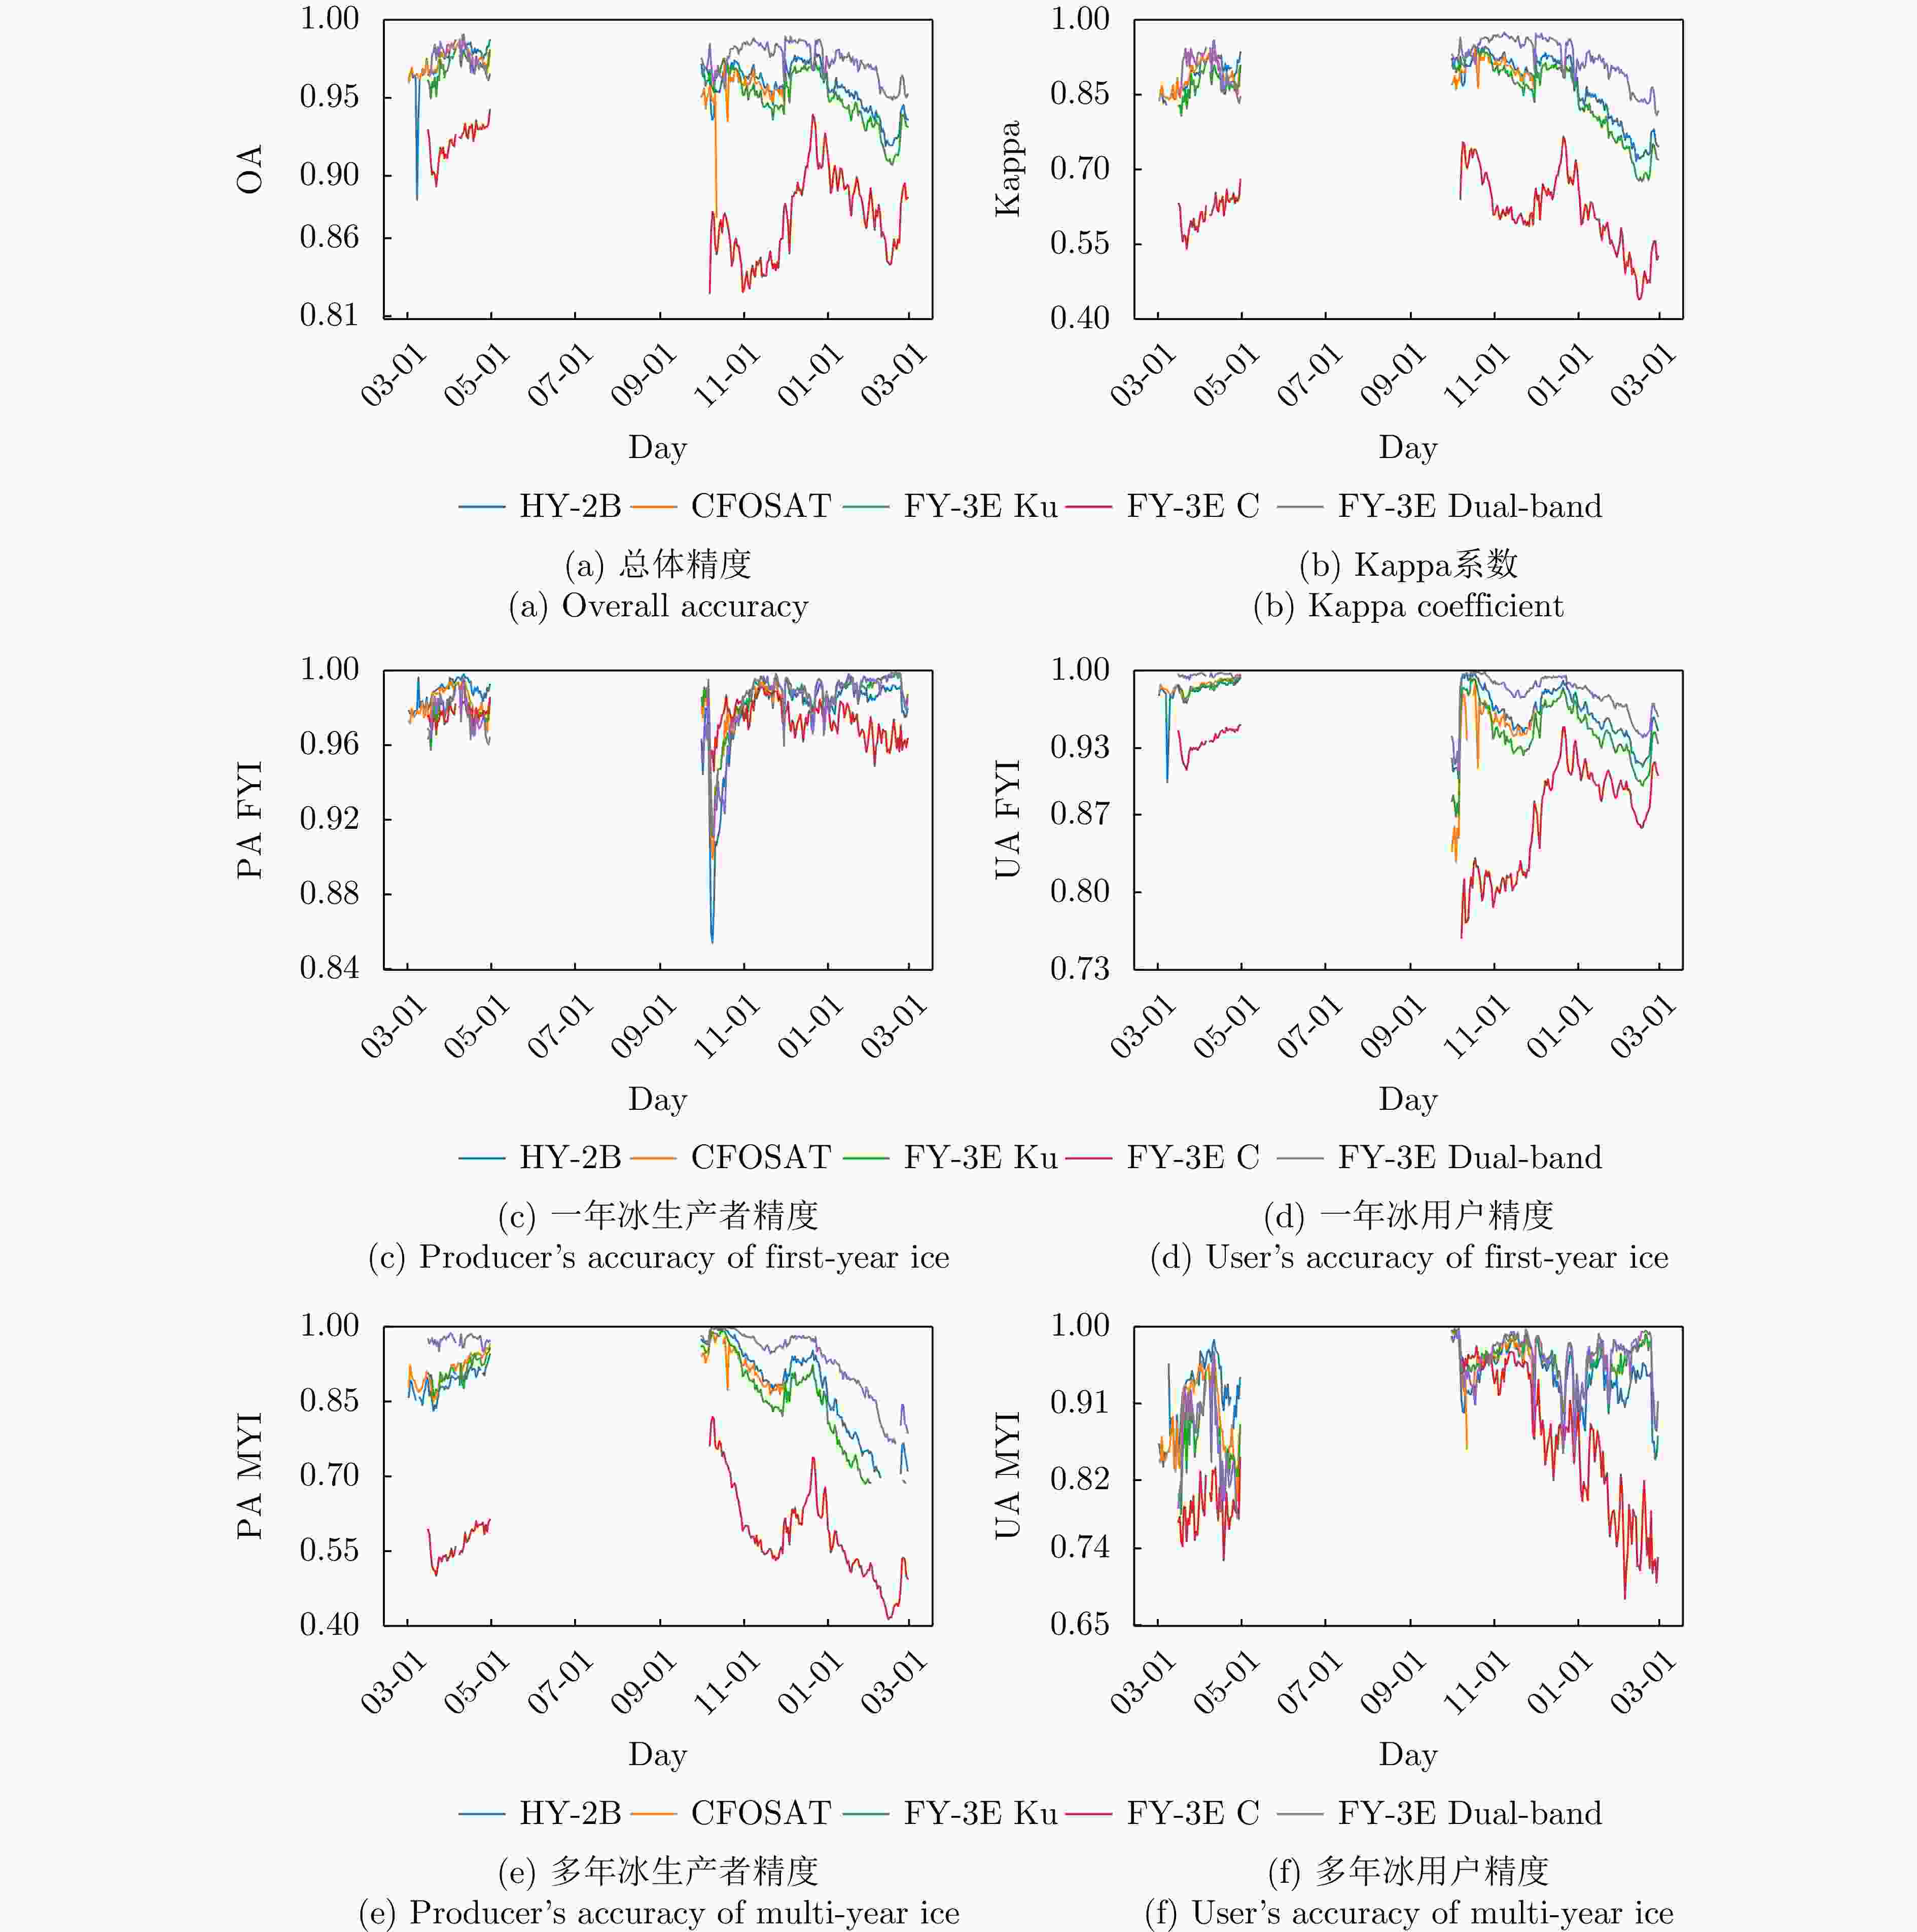
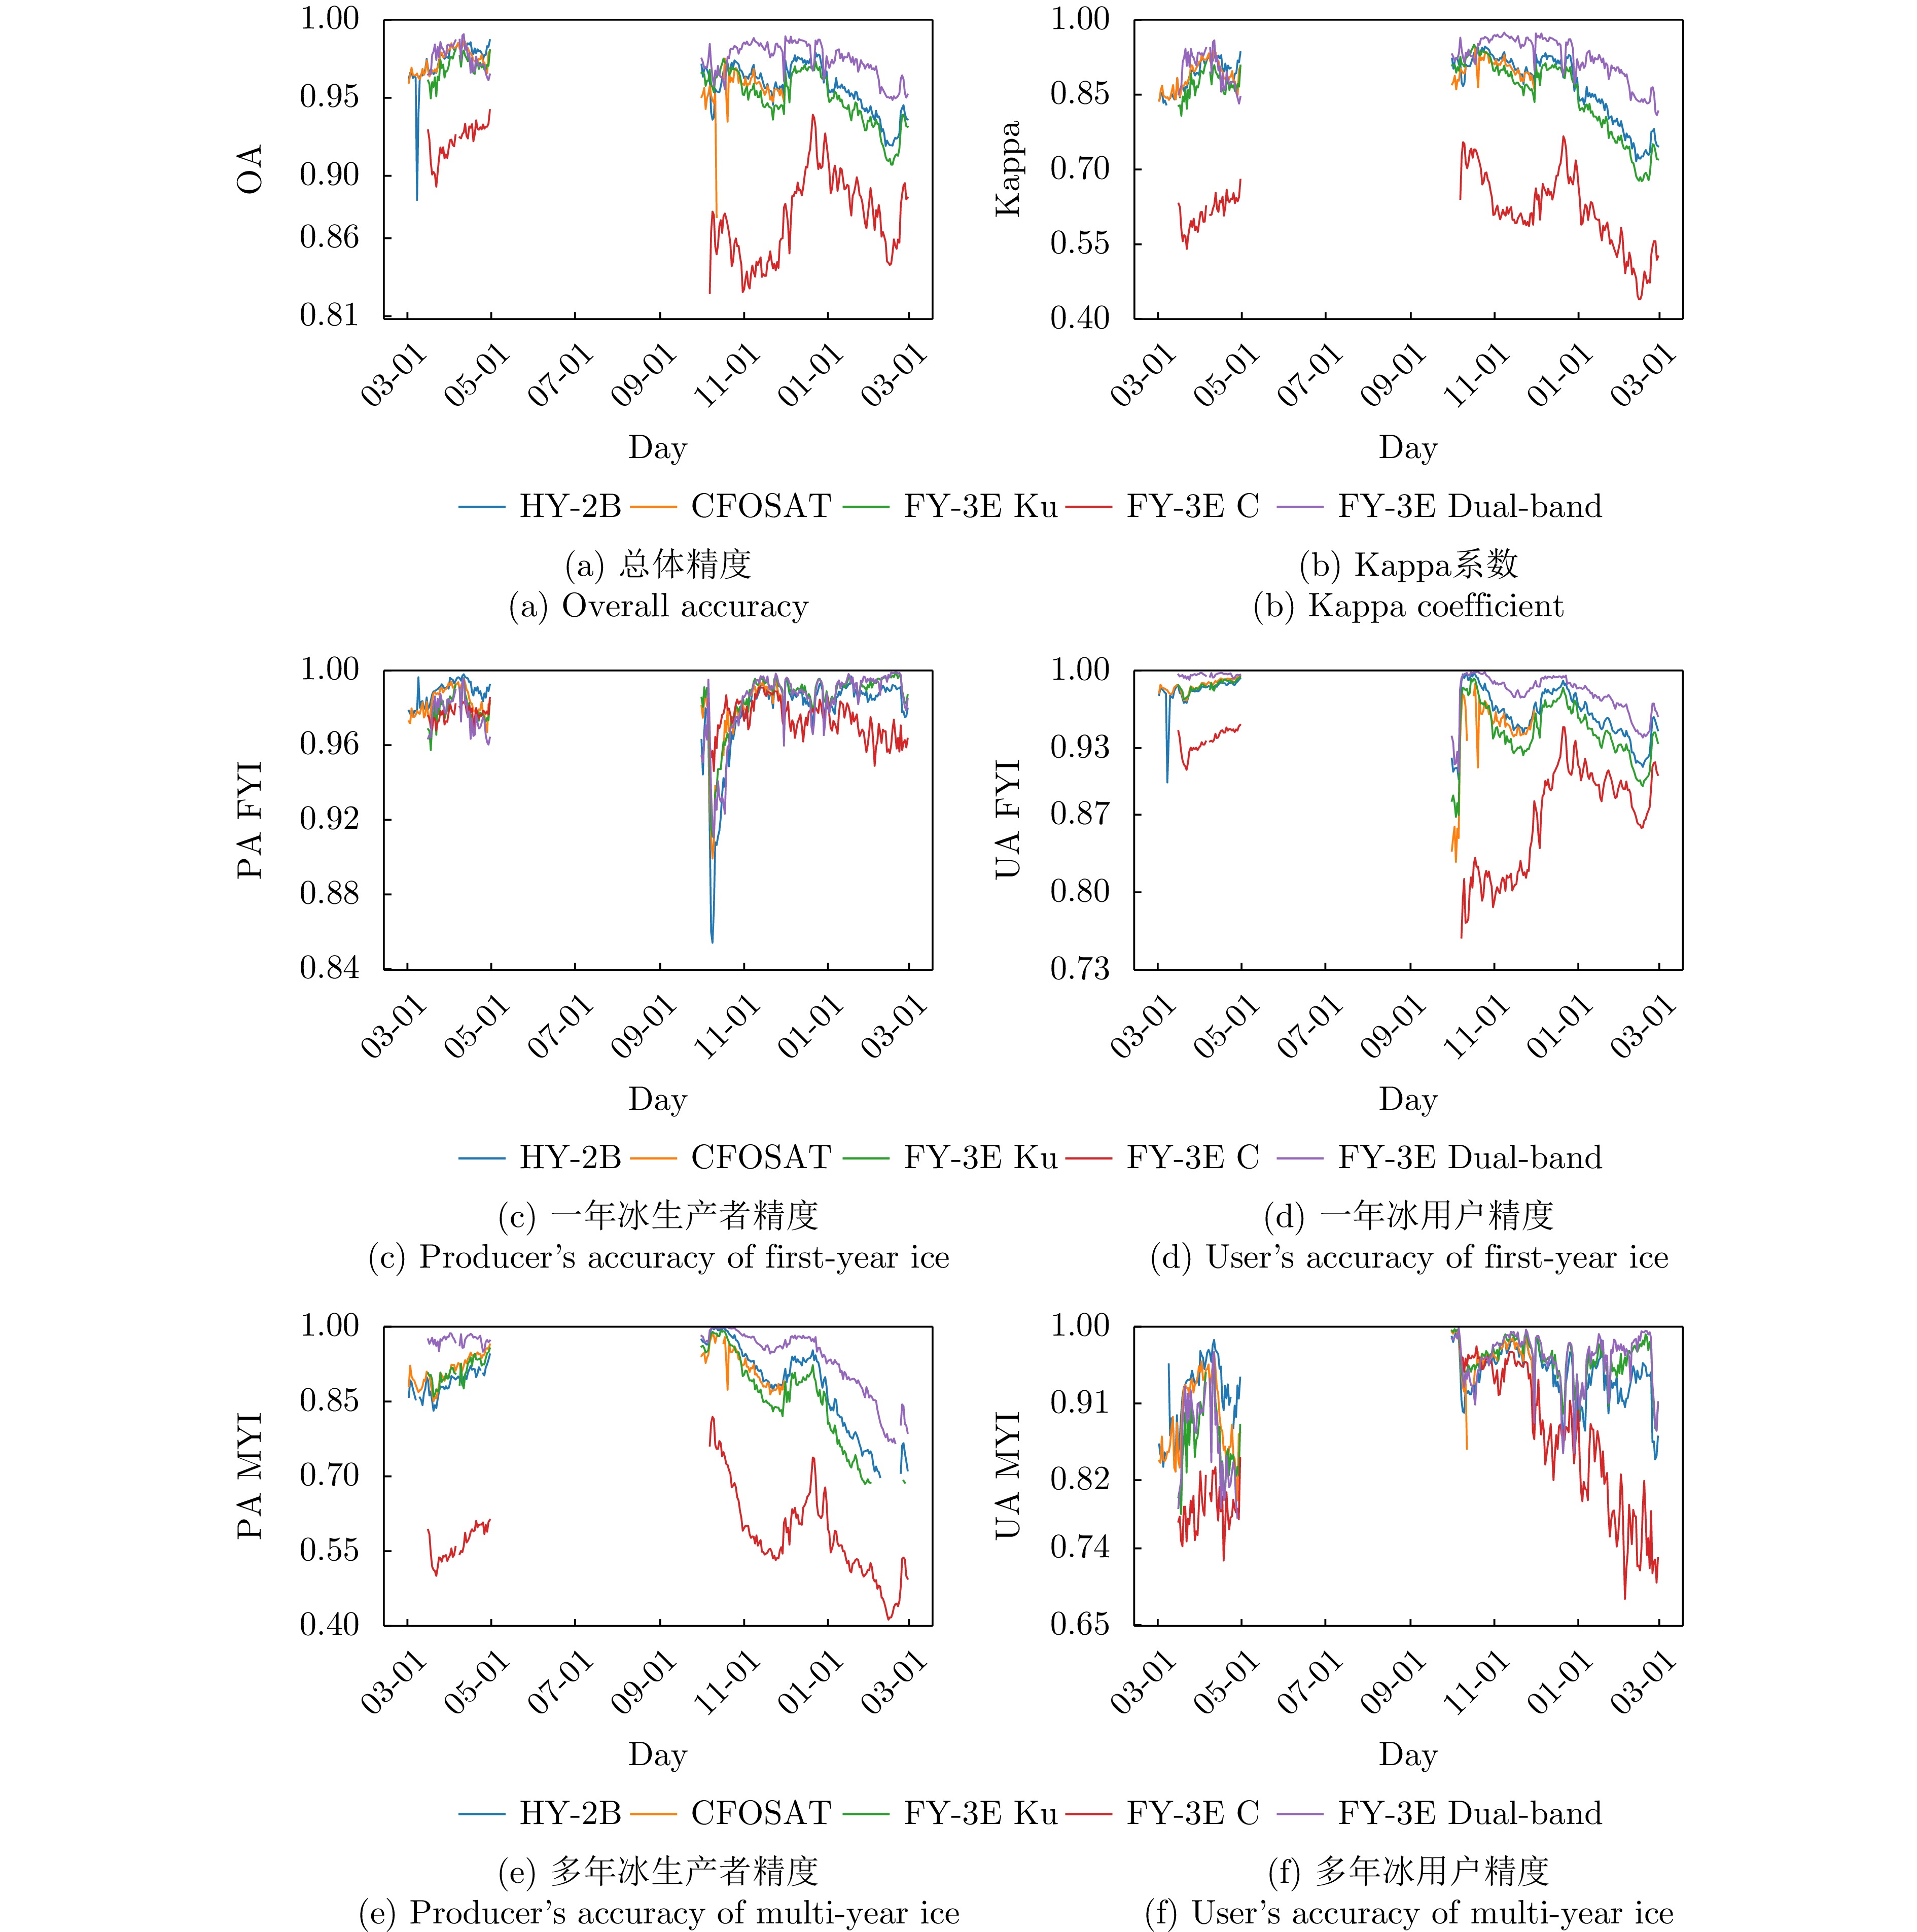
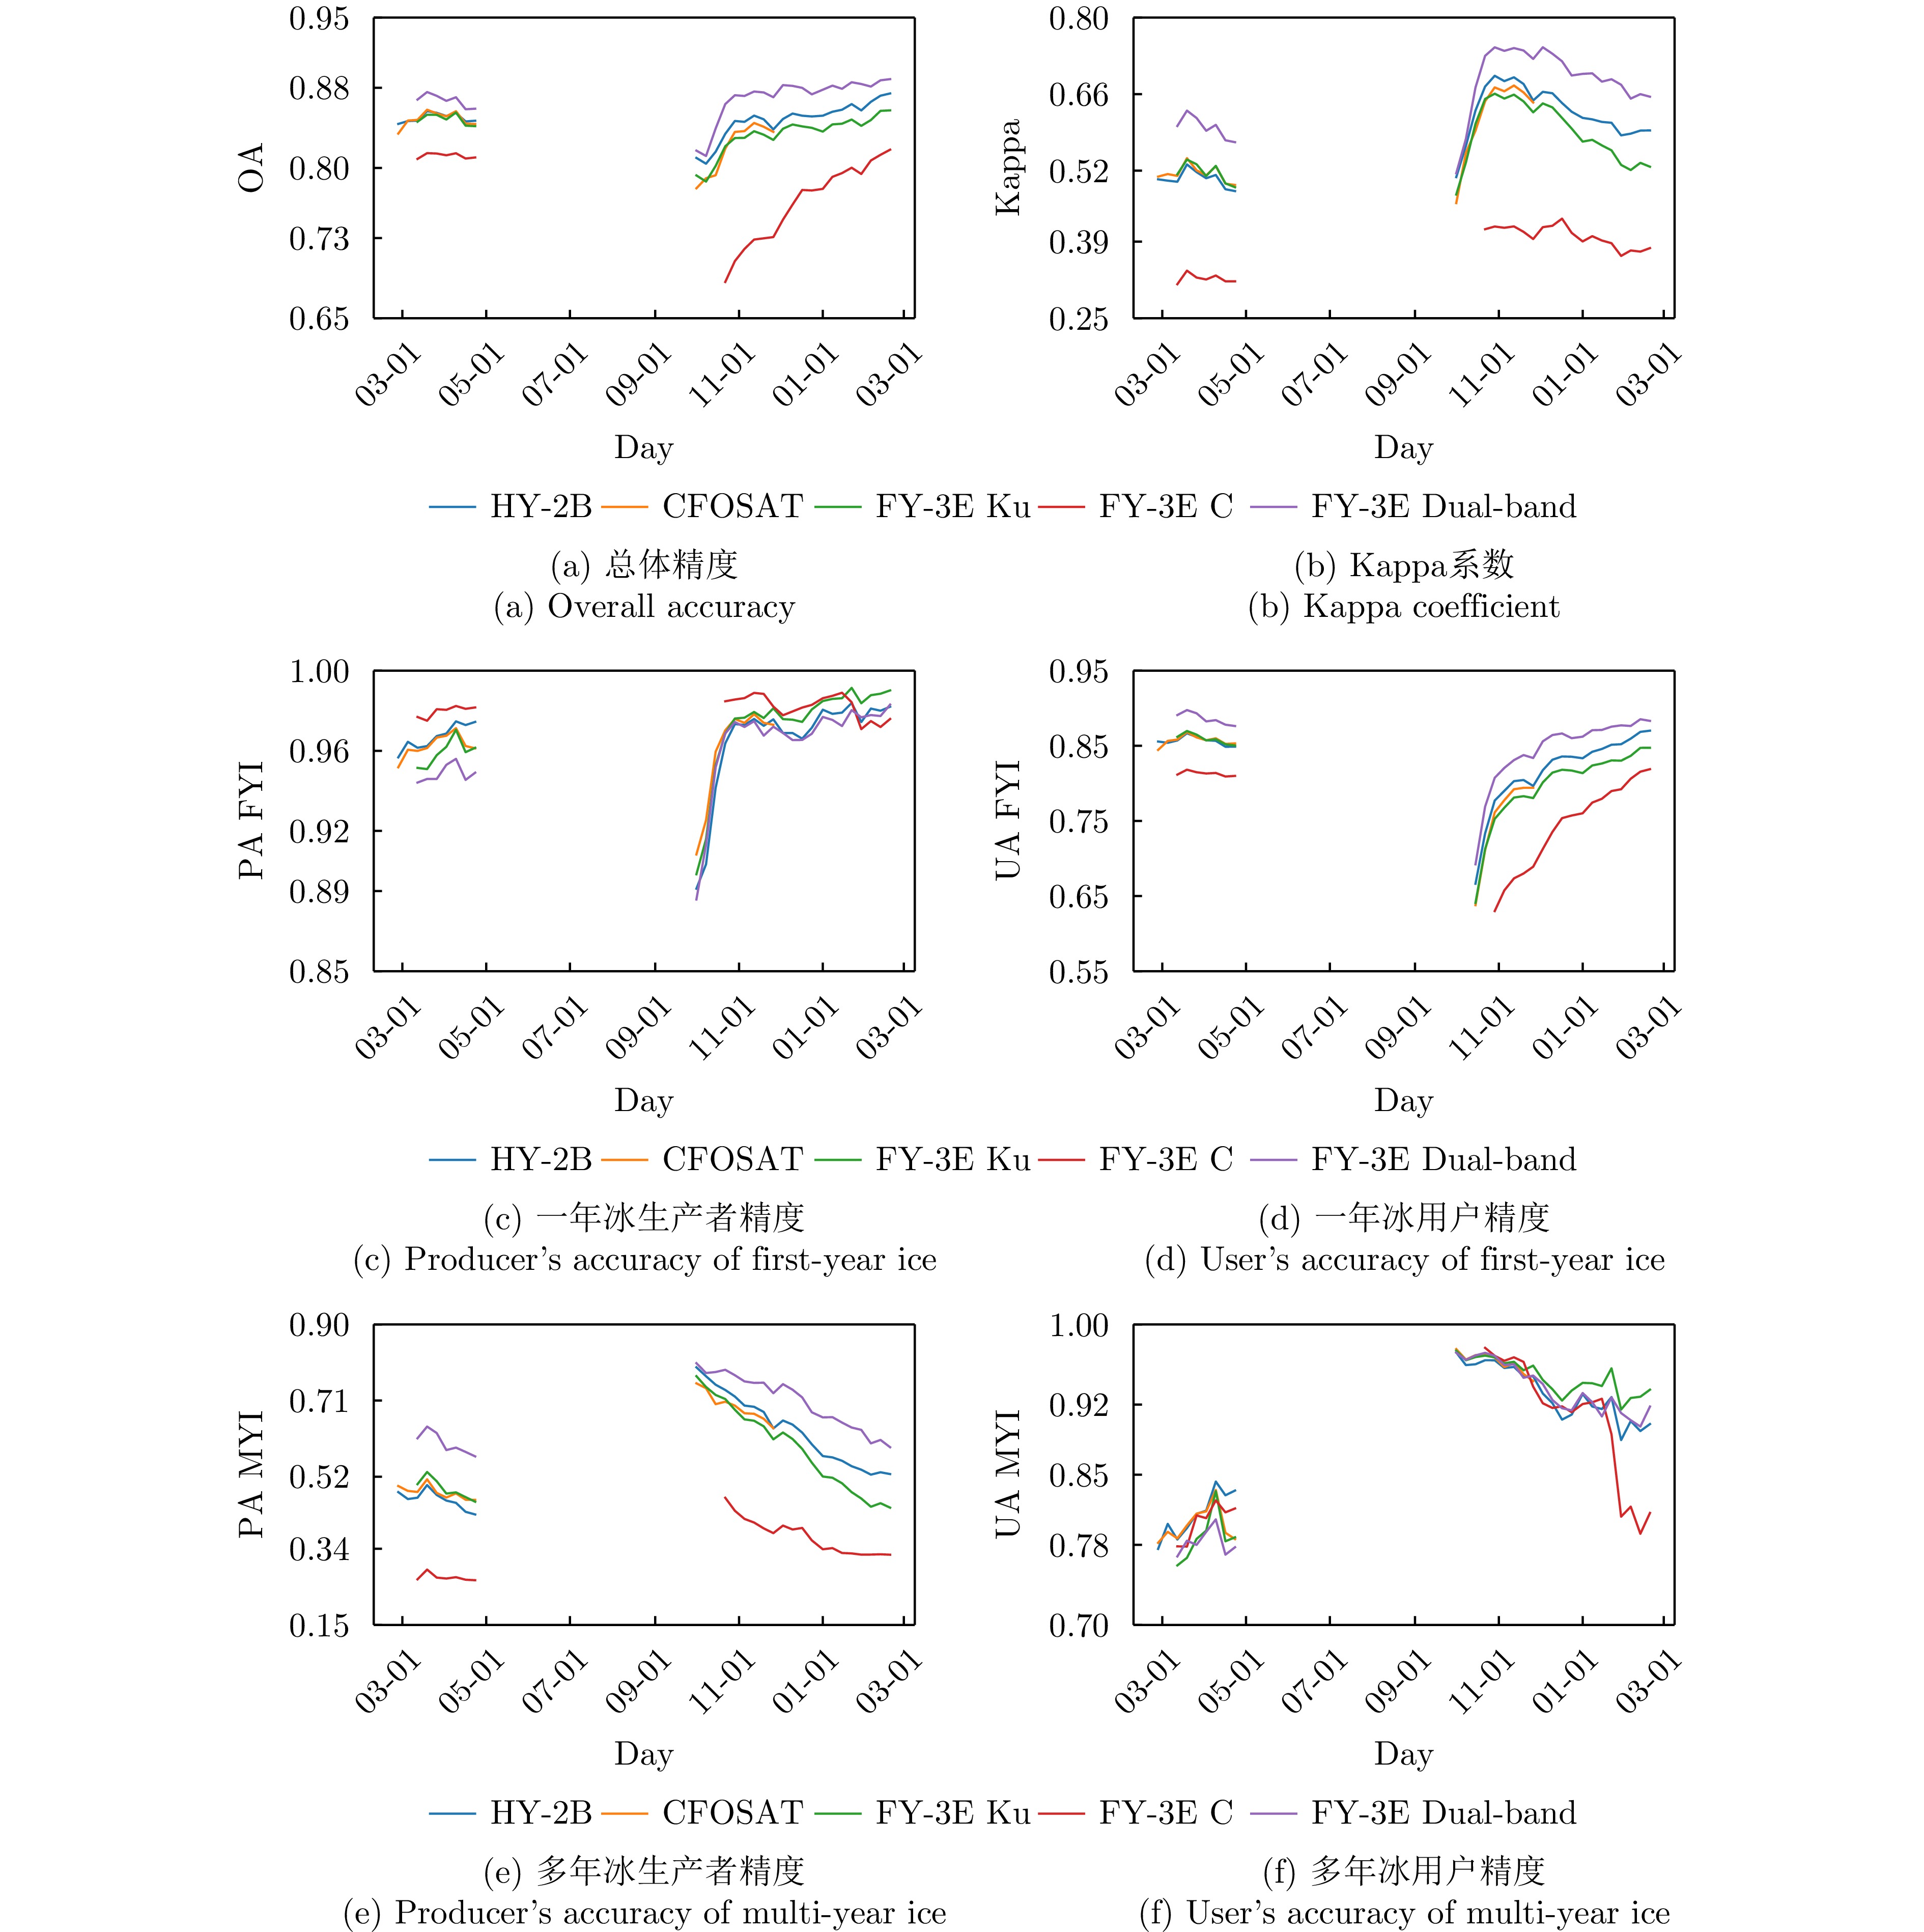
图 8 2022年3至4月和10月至2023年2月非融化期,基于OSI SAF海冰类型产品的北极地区一年冰和多年冰分类结果的评估参数
Figure 8. Evaluation metrics of Arctic first-year ice and multi-year ice classification during the non-melting periods of March–April 2022 and October 2022–February 2023 using the OSI SAF sea ice type product as reference
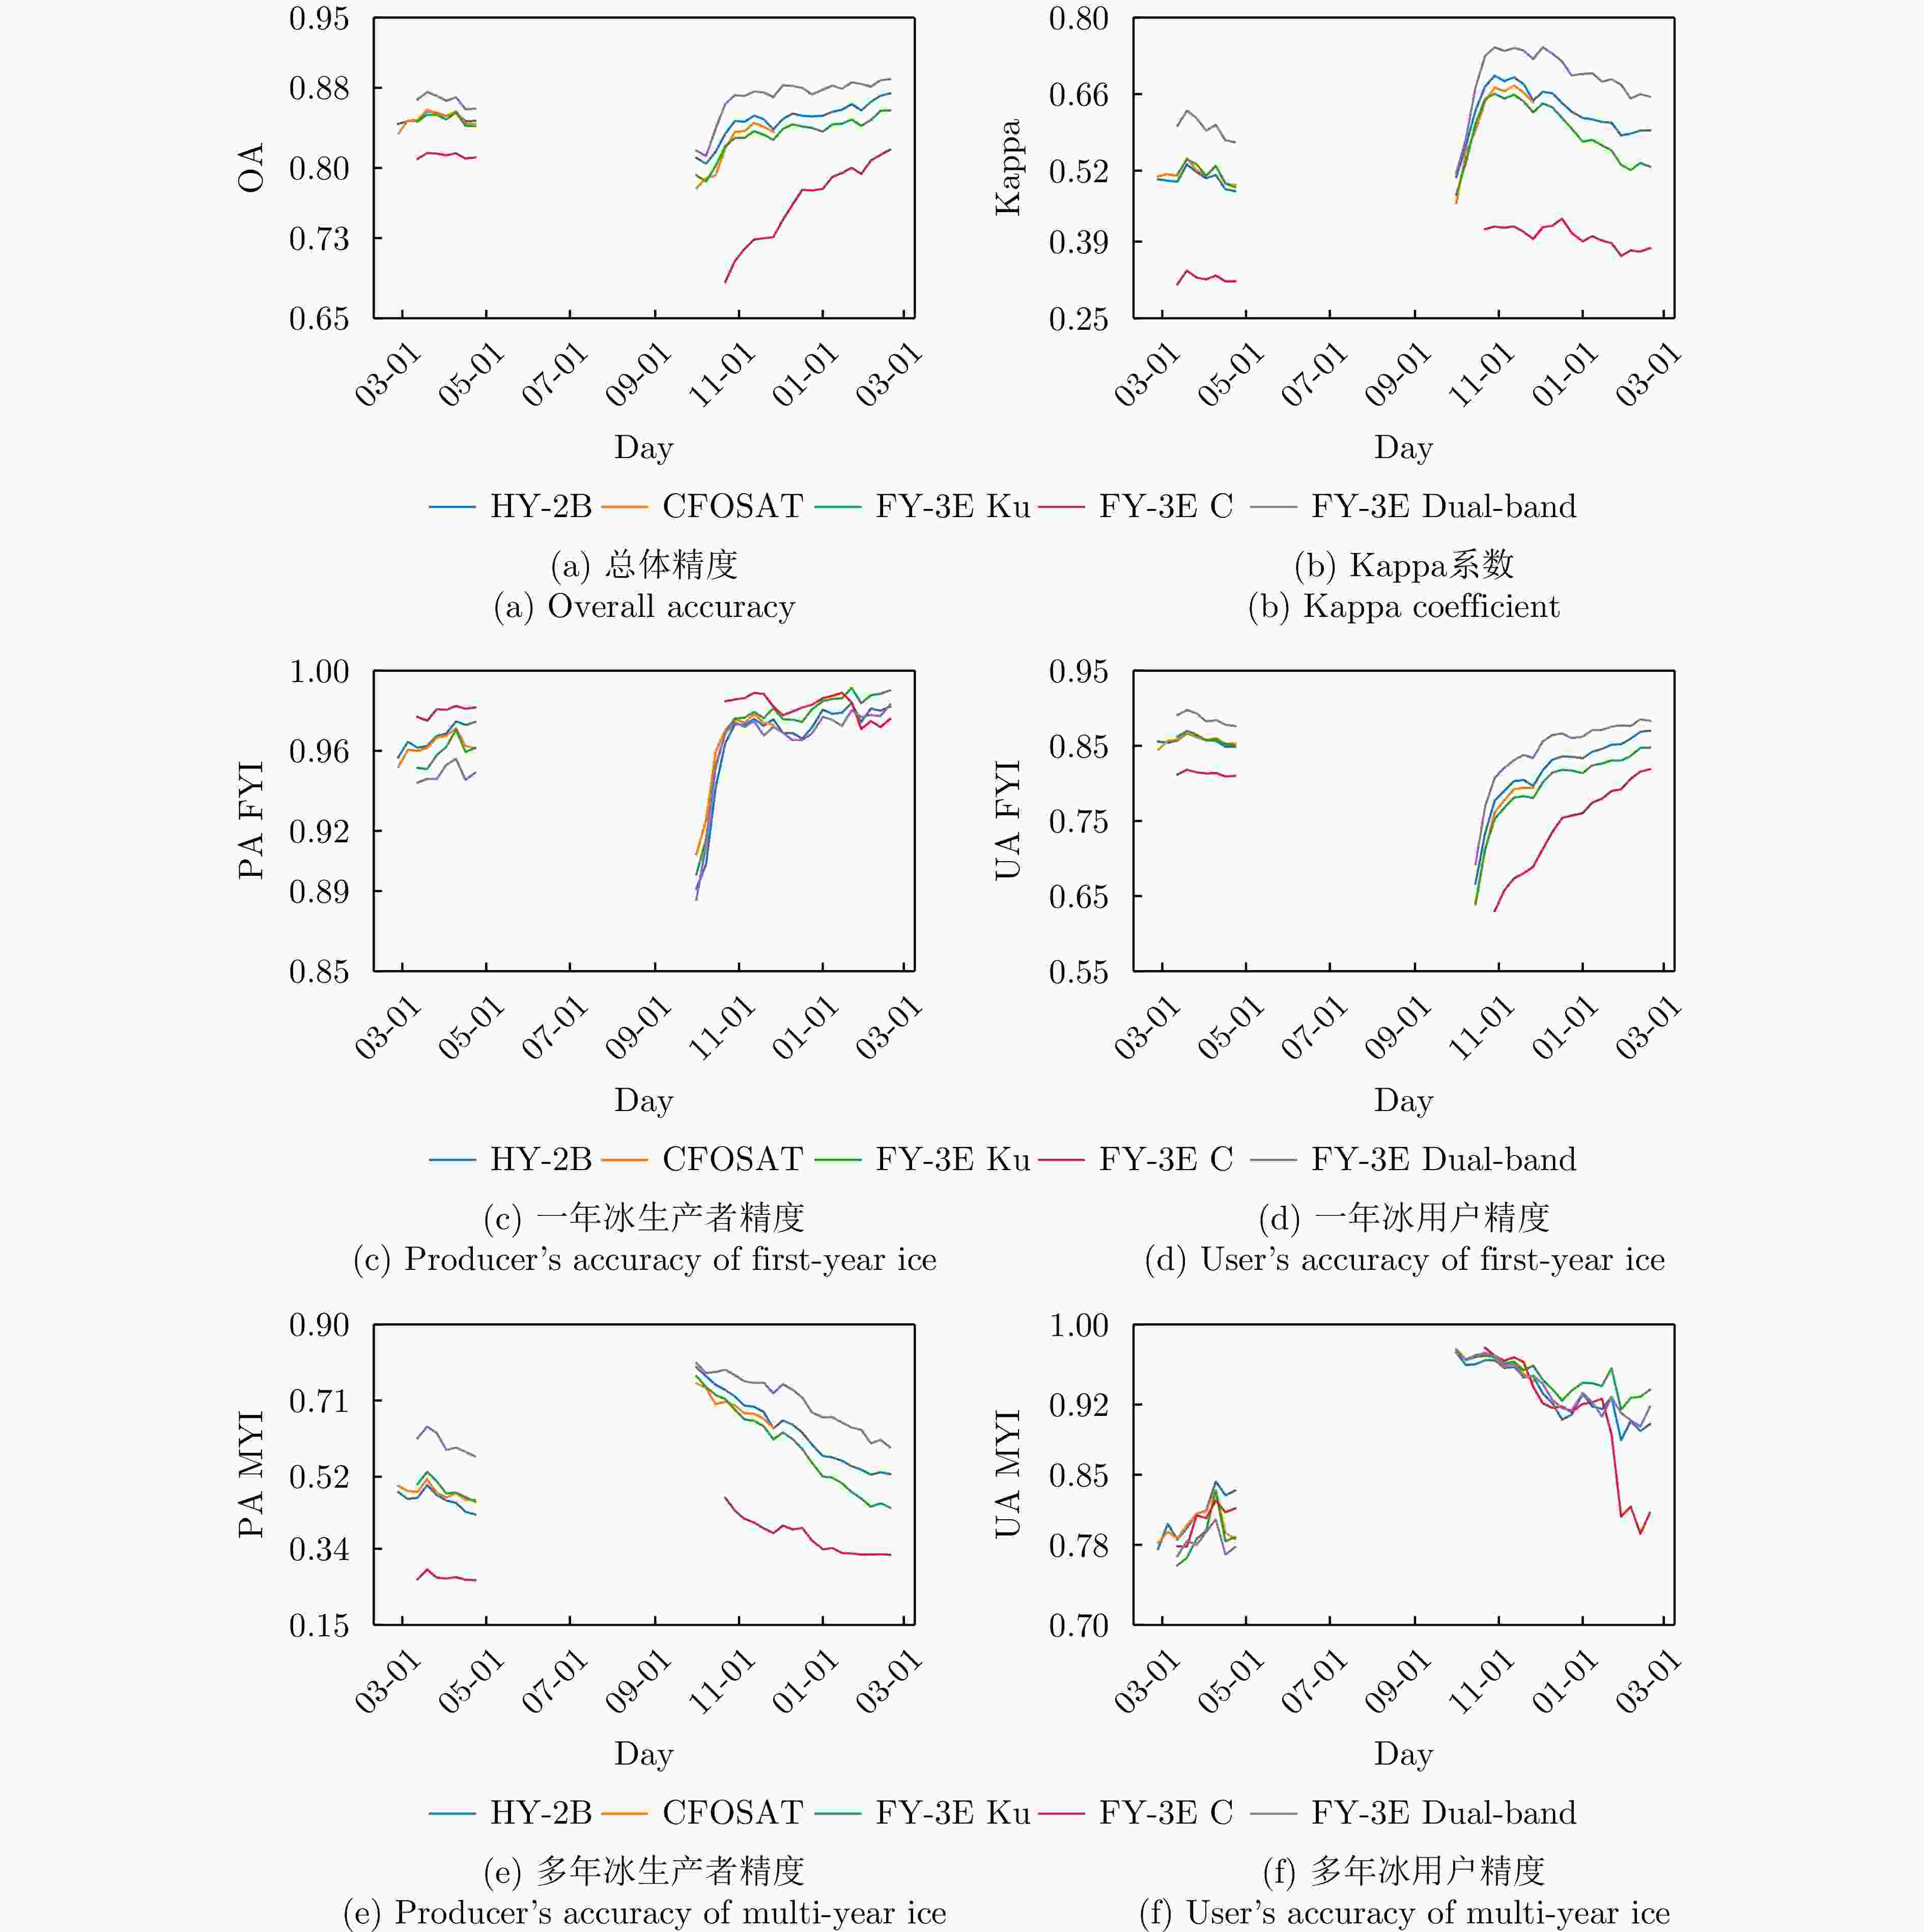
图 9 2022年3至4月和10月至2023年2月非融化期,基于NSIDC海冰年龄产品的北极地区一年冰和多年冰分类结果的评估参数
Figure 9. Evaluation metrics of Arctic first-year ice and multi-year ice classification during the non-melting periods of March–April 2022 and October 2022–February 2023 using the NSIDC sea ice age product as reference
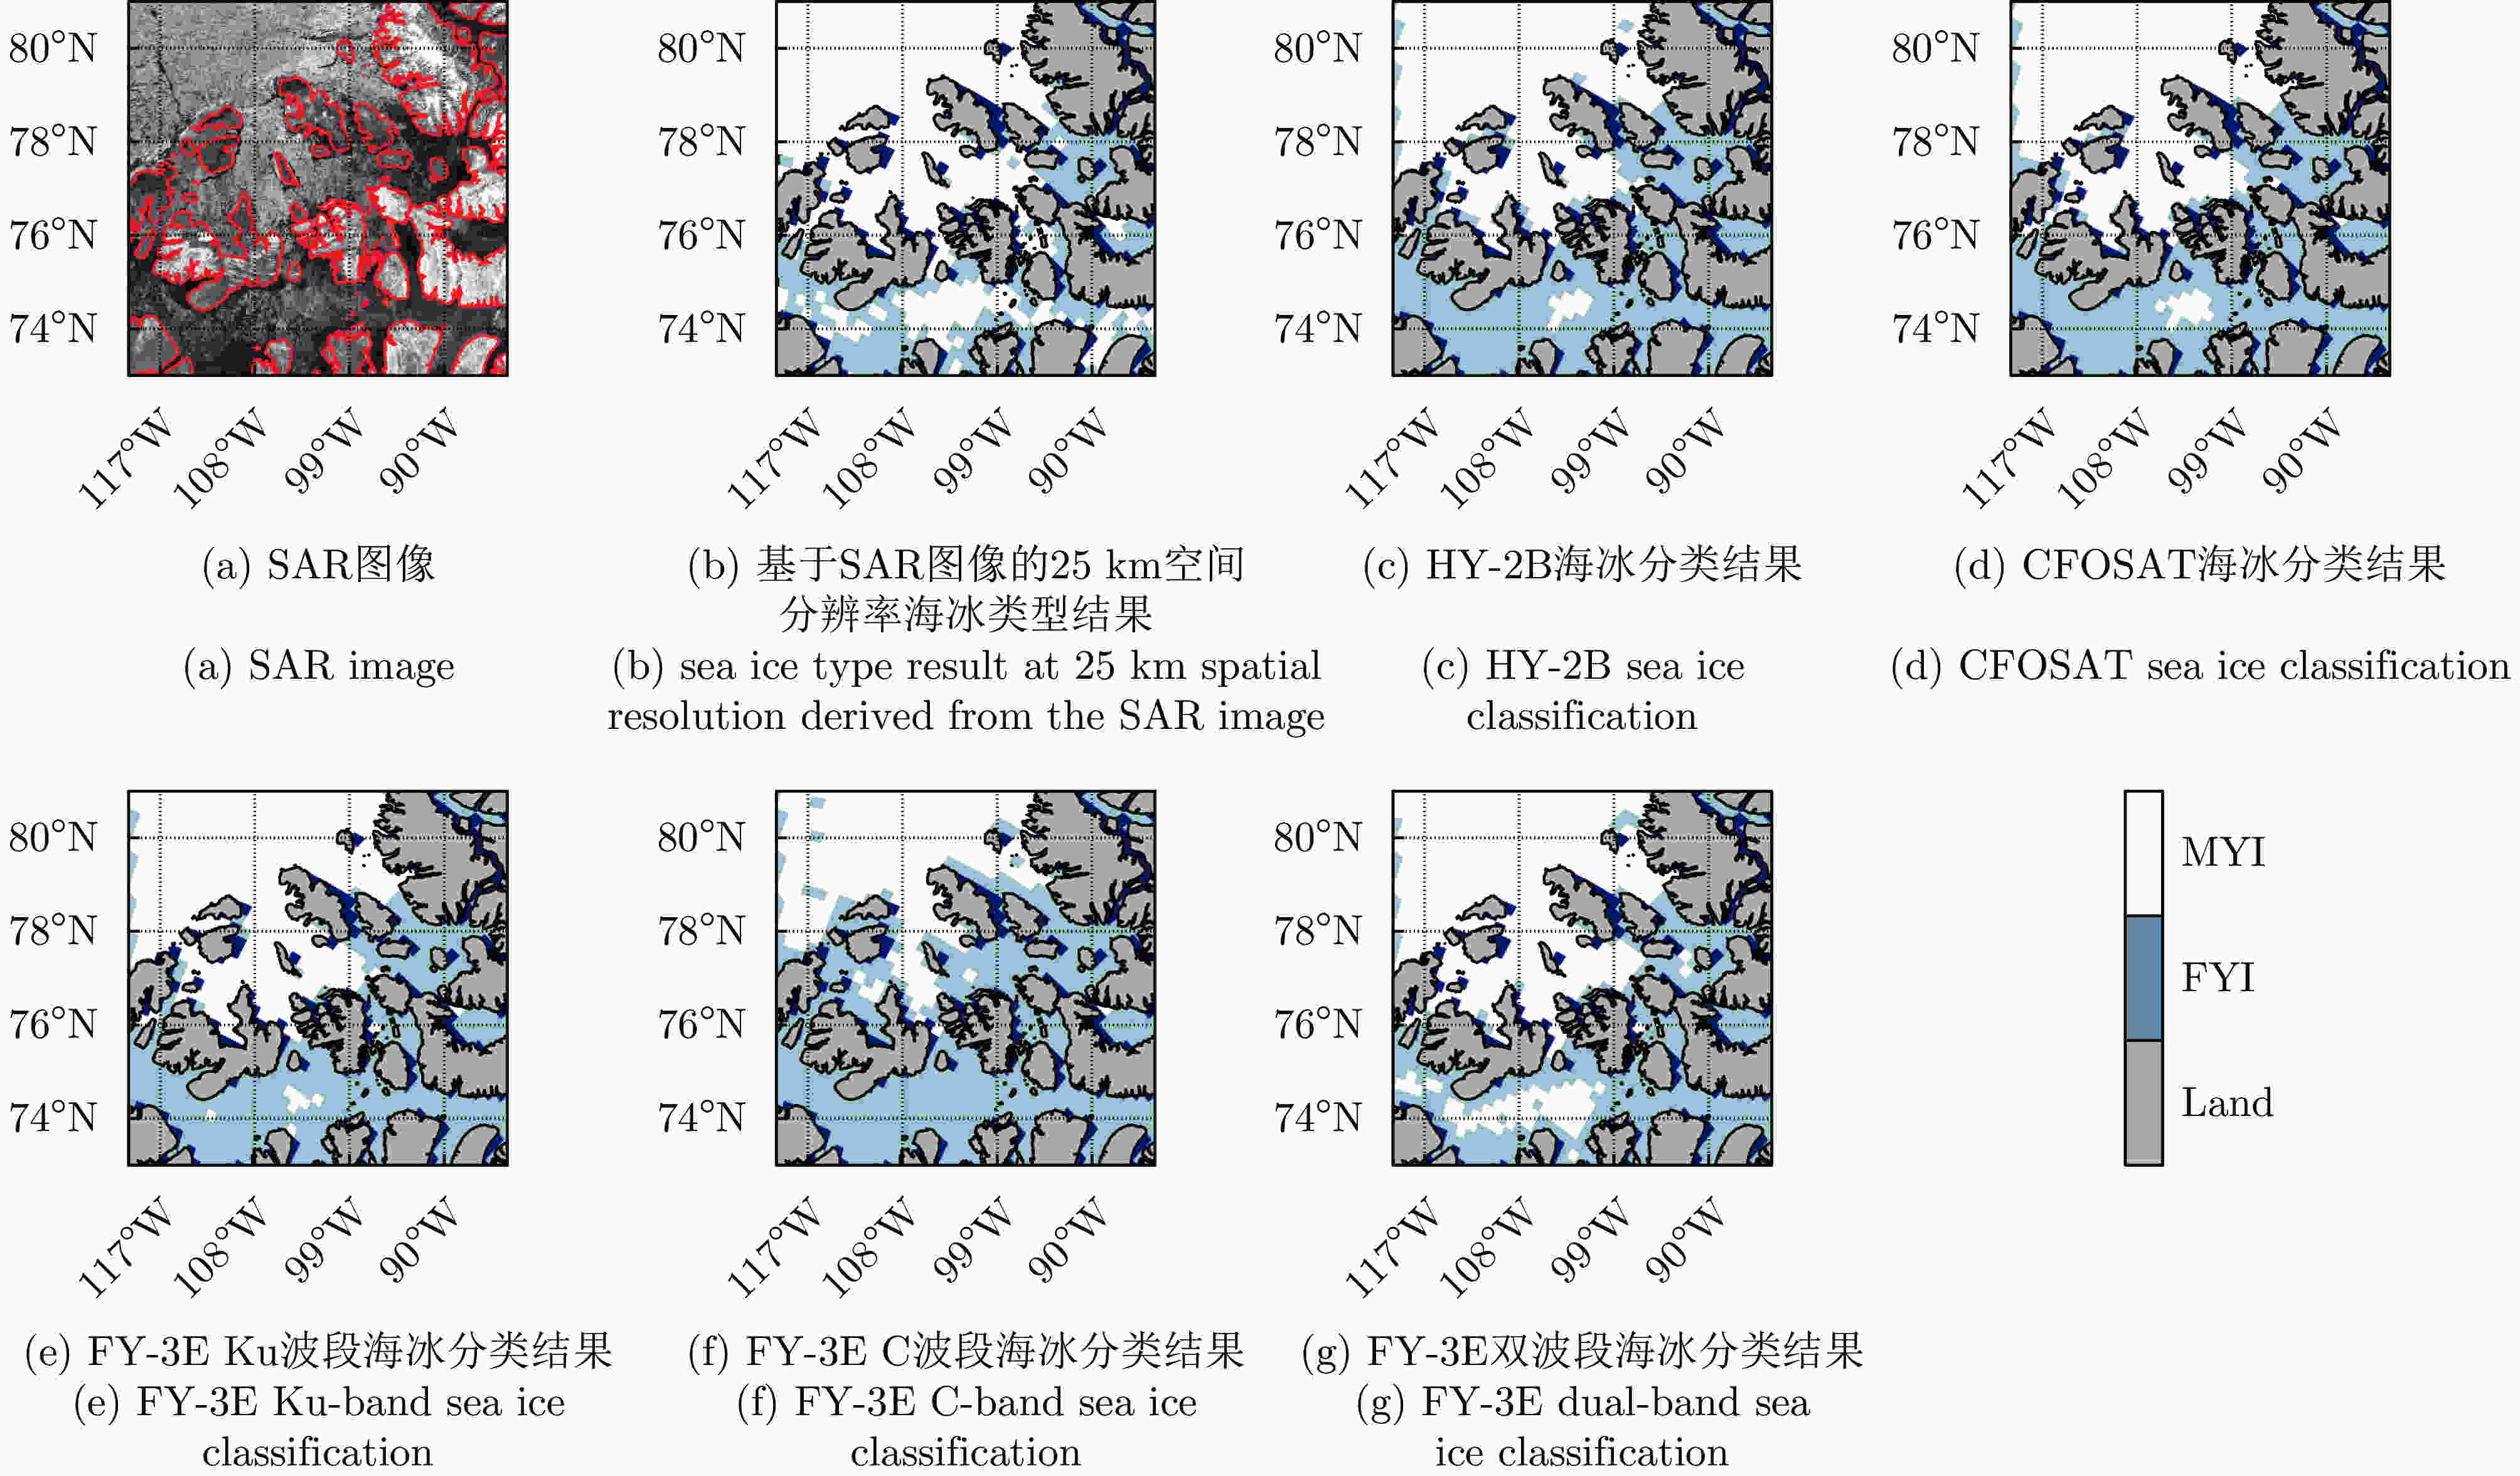
图 10 2022年3月19日,SAR图像及加拿大群岛附近的一年冰与多年冰分布
Figure 10. SAR image and distribution of first-year ice and multi-year ice near the Canadian Archipelago on 19 March 2022
表 1 本研究中使用的3种散射计的简要信息
Table 1. Summary information of the three scatterometers used in this study
卫星/传感器 发射年份 观测模式 频率(GHz) 极化方式 入射角($ {^{\circ}} $) 波束宽度(km) 空间分辨率(km) HY-2B/SCAT 2018年 圆锥扫描 13.256(Ku波段) HH 41 1350 25 VV 48 1700 25 CFOSAT/CSCAT 2018年 扇形扫描 13.256(Ku波段) HH和VV 28~51 1000 25 FY-3E/WindRAD 2021年 圆锥扫描 5.4(C波段) HH和VV 36~45 1200 25 13.256(Ku波段) HH和VV 37~43 1200 10  下载: 导出CSV
表 2 散射计特征参量信息
Table 2. Scatterometer feature parameters
散射计 编号 使用参数 HY-2B/HSCAT 1 $ \sigma _{\rm{HH}}^{0},\sigma _{\rm{VV}}^{0},{\mathrm{PR}},{\Delta }\sigma _{\rm{HH}}^{0},{\Delta }\sigma _{\rm{VV}}^{0} $ CFOSAT/CSCAT 2 $ \sigma _{\rm{HH}}^{0},\sigma _{\rm{VV}}^{0},{\mathrm{PR}},{\Delta }\sigma _{\rm{HH}}^{0},{\Delta }\sigma _{\rm{VV}}^{0} $ FY-3E/WindRAD 3 Ku波段 $ \sigma _{\rm{HH}}^{0},\sigma _{\rm{VV}}^{0},{\mathrm{PR}},{\Delta }\sigma _{\rm{HH}}^{0},{\Delta }\sigma _{\rm{VV}}^{0} $ 4 C波段 $ \sigma _{\rm{HH}}^{0},\sigma _{\rm{VV}}^{0},{\mathrm{PR}},{\Delta }\sigma _{\rm{HH}}^{0},{\Delta }\sigma _{\rm{VV}}^{0} $ 5 双波段 Ku波段+ C波段+$ {{\mathrm{BR}}}_{\rm{HH}} $+$ {{\mathrm{BR}}}_{\rm{VV}} $
下载: 导出CSV
表 3 2022年3月至2023年2月间基于不同散射计数据的北极冰水区分精度平均值(%)
Table 3. Mean accuracy values of ice-water classification based on different scatterometers data over the Arctic from March 2022 to February 2023 (%)
方法 OA Kappa UA_OW UA_Ice PA_OW PA_Ice HY-2B 97.86 93.54 97.78 98.17 99.53 91.84 CFOSAT 98.55 96.04 98.69 98.09 99.40 95.92 FY-3E Ku 98.90 96.76 99.24 97.66 99.35 97.27 FY-3E C 98.89 96.72 99.26 97.53 99.32 97.34 FY-3E dual-band 99.11 97.39 99.47 97.80 99.39 98.11
下载: 导出CSV
表 4 2022年9月6日不同散射计海冰范围结果的评估参数(%)
Table 4. Evaluation metrics of different scatterometers’ sea ice extent results against MODIS water/ice results on 6 September 2022 (%)
方法 OA Kappa UA_OW UA_Ice PA_OW PA_Ice HY-2B 88.78 77.62 87.92 89.73 90.55 86.91 CFOSAT 87.24 74.64 85.78 88.95 90.05 84.29 FY-3E Ku 86.73 73.50 89.42 84.24 84.08 89.53 FY-3E C 90.05 80.11 92.19 88.00 88.06 92.15 FY-3E dual-band 90.05 80.12 92.63 87.62 87.56 92.67
下载: 导出CSV
表 5 2022年3至4月和10月至2023年2月非融化期,以OSI SAF海冰类型产品为参考的不同散射计北极海冰类型分类平均精度(%)
Table 5. Mean accuracy values of Arctic sea ice type classification based on different scatterometers during the non-melting periods of March–April 2022 and October 2022–February 2023 using the OSI SAF sea ice type product as reference (%)
方法 OA Kappa UA_ FYI UA_ MYI PA_ FYI PA_ MYI HY-2B 96.07 87.65 96.59 93.89 98.53 86.60 CFOSAT 96.79 90.46 97.64 93.59 98.26 91.45 FY-3E Ku 95.32 85.83 95.55 94.34 98.57 83.84 FY-3E C 88.93 62.65 89.46 85.79 97.39 57.83 FY-3E dual-band 97.40 92.42 98.21 94.50 98.45 93.68
下载: 导出CSV
表 6 2022年3至4月和10月至2023年2月非融化期,以NSIDC海冰年龄产品为参考的不同散射计北极海冰类型分类平均精度(%)
Table 6. Mean accuracy values of Arctic sea ice type classification based on different scatterometers during the non-melting periods of March–April 2022 and October 2022–February 2023 using the NSIDC sea ice age product as reference (%)
方法 OA Kappa UA_ FYI UA_ MYI PA_ FYI PA_ MYI HY-2B 85.12 62.55 83.59 90.79 97.12 59.83 CFOSAT 83.99 61.57 82.19 89.94 96.45 60.33 FY-3E Ku 84.08 60.70 82.04 91.68 97.35 57.80 FY-3E C 78.40 39.54 76.92 89.08 98.07 34.88 FY-3E dual-band 87.26 69.65 86.09 90.70 96.42 69.13
下载: 导出CSV
表 7 2022年3月19日不同散射计与SAR一年冰/多年冰结果的评估参数(%)
Table 7. Evaluation metrics of different scatterometers against SAR FYI/MYI results on 19 March 2022 (%)
方法 OA Kappa UA_FYI UA_MYI PA_FYI PA_MYI HY-2B 70.90 42.28 70.19 71.75 74.90 66.71 CFOSAT 71.31 43.04 70.67 72.07 75.03 67.42 FY-3E Ku 71.93 44.12 71.59 72.31 74.77 68.96 FY-3E C 62.80 30.65 60.97 65.98 75.70 49.30 FY-3E dual-band 72.48 44.98 74.09 70.93 71.01 74.02
下载: 导出CSV
-
[1] 谢涛, 赵立. 海冰密集度卫星遥感反演研究进展[J]. 海洋科学进展, 2022, 40(3): 351–366. doi: 10.12362/j.issn.1671-6647.20220209001.XIE Tao and ZHAO Li. Advances in sea ice concentration retrieval based on satellite remote sensing[J]. Advances in Marine Science, 2022, 40(3): 351–366. doi: 10.12362/j.issn.1671-6647.20220209001. [2] MOON T A, OVEREEM I, DRUCKENMILLER M, et al. The expanding footprint of rapid Arctic change[J]. Earth’s Future, 2019, 7(3): 212–218. doi: 10.1029/2018EF001088. [3] SANDVEN S, SPREEN G, HEYGSTER G, et al. Sea ice remote sensing-recent developments in methods and climate data sets[J]. Surveys in Geophysics, 2023, 44(5): 1653–1689. doi: 10.1007/s10712-023-09781-0. [4] LIGHT B, PEROVICH D K, WEBSTER M A, et al. Optical properties of melting first-year Arctic sea ice[J]. Journal of Geophysical Research: Oceans, 2015, 120(11): 7657–7675. doi: 10.1002/2015JC011163. [5] HALL D K, COMISO J C, DIGIROLAMO N E, et al. Variability in the surface temperature and melt extent of the Greenland ice sheet from MODIS[J]. Geophysical Research Letters, 2013, 40(10): 2114–2120. doi: 10.1002/grl.50240. [6] COMISO J C, CAVALIERI D J, and MARKUS T. Sea ice concentration, ice temperature, and snow depth using AMSR-E data[J]. IEEE Transactions on Geoscience and Remote Sensing, 2003, 41(2): 243–252. doi: 10.1109/TGRS.2002.808317. [7] KHALEGHIAN S, ULLAH H, KRÆMER T, et al. Sea ice classification of SAR imagery based on convolution neural networks[J]. Remote Sensing, 2021, 13(9): 1734. doi: 10.3390/rs13091734. [8] TILLING R L, RIDOUT A, and SHEPHERD A. Estimating Arctic sea ice thickness and volume using CryoSat-2 radar altimeter data[J]. Advances in Space Research, 2018, 62(6): 1203–1225. doi: 10.1016/j.asr.2017.10.051. [9] LONG D G. Polar applications of spaceborne scatterometers[J]. IEEE Journal of Selected Topics in Applied Earth Observations and Remote Sensing, 2017, 10(5): 2307–2320. doi: 10.1109/JSTARS.2016.2629418. [10] YUEH S H, KWOK R, LOU S H, et al. Sea ice identification using dual-polarized Ku-band scatterometer data[J]. IEEE Transactions on Geoscience and Remote Sensing, 1997, 35(3): 560–569. doi: 10.1109/36.581968. [11] REMUND Q P and LONG D G. Automated Antarctic ice edge detection using NSCAT data[C]. IGARSS’97. 1997 IEEE International Geoscience and Remote Sensing Symposium Proceedings. Remote Sensing-A Scientific Vision for Sustainable Development, Singapore, Singapore, 1997: 1841–1843. doi: 10.1109/IGARSS.1997.609098. [12] REMUND Q P and LONG D G. Sea ice extent mapping using Ku band scatterometer data[J]. Journal of Geophysical Research: Oceans, 1999, 104(C5): 11515–11527. doi: 10.1029/98JC02373. [13] OTOSAKA I, RIVAS M B, and STOFFELEN A. Bayesian sea ice detection with the ERS scatterometer and sea ice backscatter model at C-band[J]. IEEE Transactions on Geoscience and Remote Sensing, 2018, 56(4): 2248–2254. doi: 10.1109/TGRS.2017.2777670. [14] RIVAS M B and STOFFELEN A. New Bayesian algorithm for sea ice detection with QuikSCAT[J]. IEEE Transactions on Geoscience and Remote Sensing, 2011, 49(6): 1894–1901. doi: 10.1109/TGRS.2010.2101608. [15] RIVAS M B, VERSPEEK J, VERHOEF A, et al. Bayesian sea ice detection with the advanced scatterometer ASCAT[J]. IEEE Transactions on Geoscience and Remote Sensing, 2012, 50(7): 2649–2657. doi: 10.1109/TGRS.2011.2182356. [16] SWAN A M and LONG D G. Multiyear Arctic sea ice classification using QuikSCAT[J]. IEEE Transactions on Geoscience and Remote Sensing, 2012, 50(9): 3317–3326. doi: 10.1109/TGRS.2012.2184123. [17] LINDELL D B and LONG D G. Multiyear Arctic sea ice classification using OSCAT and QuikSCAT[J]. IEEE Transactions on Geoscience and Remote Sensing, 2016, 54(1): 167–175. doi: 10.1109/TGRS.2015.2452215. [18] LINDELL D B and LONG D G. Multiyear Arctic ice classification using ASCAT and SSMIS[J]. Remote Sensing, 2016, 8(4): 294. doi: 10.3390/rs8040294. [19] ZHANG Zhilun, YU Yining, LI Xinqing, et al. Arctic sea ice classification using microwave scatterometer and radiometer data during 2002–2017[J]. IEEE Transactions on Geoscience and Remote Sensing, 2019, 57(8): 5319–5328. doi: 10.1109/TGRS.2019.2898872. [20] ZHANG Zhilun, YU Yining, SHOKR M, et al. Intercomparison of Arctic sea ice backscatter and ice type classification using Ku-band and C-band scatterometers[J]. IEEE Transactions on Geoscience and Remote Sensing, 2022, 60: 4301718. doi: 10.1109/TGRS.2021.3099835. [21] ZHAI Xiaochun, WANG Zhixiong, ZHENG Zhaojun, et al. Sea ice monitoring with CFOSAT scatterometer measurements using random forest classifier[J]. Remote Sensing, 2021, 13(22): 4686. doi: 10.3390/rs13224686. [22] ZHAI Xiaochun, XU Rui, WANG Zhixiong, et al. Classification of arctic sea ice type in CFOSAT scatterometer measurements using a random forest classifier[J]. Remote Sensing, 2023, 15(5): 1310. doi: 10.3390/rs15051310. [23] LI Zhen, VERHOEF A, and STOFFELEN A. Bayesian sea ice detection algorithm for CFOSAT[J]. Remote Sensing, 2022, 14(15): 3569. doi: 10.3390/rs14153569. [24] ZENG Tao, SHI Lijian, SHI Yingni, et al. Polar sea ice monitoring using HY-2B satellite scatterometer and scanning microwave radiometer measurements[J]. Remote Sensing, 2024, 16(13): 2486. doi: 10.3390/rs16132486. [25] ZHAI Xiaochun, TIAN Shengrong, YE Yufang, et al. First results of Antarctic sea ice classification using spaceborne dual-frequency scatterometer FY-3E WindRAD[J]. IEEE Geoscience and Remote Sensing Letters, 2024, 21: 2000105. doi: 10.1109/LGRS.2023.3339720. [26] XU Rui, ZHAO Chaofang, ARNDT S, et al. Dual-frequency radar observations of snowmelt processes on Antarctic perennial sea ice by CFOSCAT and ASCAT[J]. The Cryosphere, 2024, 18(12): 5769–5788. doi: 10.5194/tc-18-5769-2024. [27] LIN Wenming, DONG Xiaolong, PORTABELLA M, et al. A perspective on the performance of the CFOSAT rotating fan-beam scatterometer[J]. IEEE Transactions on Geoscience and Remote Sensing, 2019, 57(2): 627–639. doi: 10.1109/TGRS.2018.2858852. [28] National Snow and Ice Data Center. Sea ice concentrations from nimbus-7 SMMR and DMSP SSM/I-SSMIS passive microwave data, version 2[R]. NSIDC-0051, 2025. doi: 10.5067/MPYG15WAA4WX. [29] AABOE S, DOWN E J, and EASTWOOD S. Product user manual for the global sea-ice edge and type product[R]. GBL SIED OSI-402-d and GBL SITY OSI-403-d, 2021. [30] National Snow and Ice Data Center. EASE-grid sea ice age, version 4[R]. NSIDC-0611, 2024. doi: 10.5067/UTAV7490FEPB. [31] National Snow and Ice Data Center. MODIS/aqua sea ice extent daily L3 global 1km EASE-grid day, version 61[R]. MYD29P1D, 2026. doi: 10.5067/MODIS/MYD29P1D.061. [32] SNYDER J P. Map Projections: A Working Manual[M]. Washington, DC, USA: U.S. Government Printing Office, 1987: 157–163. [33] BUGAYEVSKIY L M and SNYDER J. Map Projections: A Reference Manual[M]. London, UK: Taylor & Francis, 1995: 109–122. doi: 10.1201/b16431. [34] NGHIEM S V and BERTOIA C. Study of multi-polarization C-band backscatter signatures for Arctic sea ice mapping with future satellite SAR[J]. Canadian Journal of Remote Sensing, 2001, 27(5): 387–402. doi: 10.1080/07038992.2001.10854882. [35] CHAPELLE O, HAFFNER P, and VAPNIK V N. Support vector machines for histogram-based image classification[J]. IEEE Transactions on Neural Networks, 1999, 10(5): 1055–1064. doi: 10.1109/72.788646. [36] LI Xiaoming, SUN Yan, and ZHANG Qiang. Extraction of sea ice cover by Sentinel-1 SAR based on support vector machine with unsupervised generation of training data[J]. IEEE Transactions on Geoscience and Remote Sensing, 2021, 59(4): 3040–3053. doi: 10.1109/TGRS.2020.3007789. [37] XU Changjing, WANG Zhixiong, ZHAI Xiaochun, et al. SVM-based sea ice extent retrieval using multisource scatterometer measurements[J]. Remote Sensing, 2023, 15(6): 1630. doi: 10.3390/rs15061630. -


计量
- 文章访问数:
- HTML全文浏览量:
- PDF下载量:
- 被引次数: 0