
 作者中心
作者中心 专家审稿
专家审稿 责编办公
责编办公 编辑办公
编辑办公
Multi-temporal Polarimetric Synthetic Aperture Radar Salt Field Regional Classification Based on Dominant Scattering Temporal Entropy
-
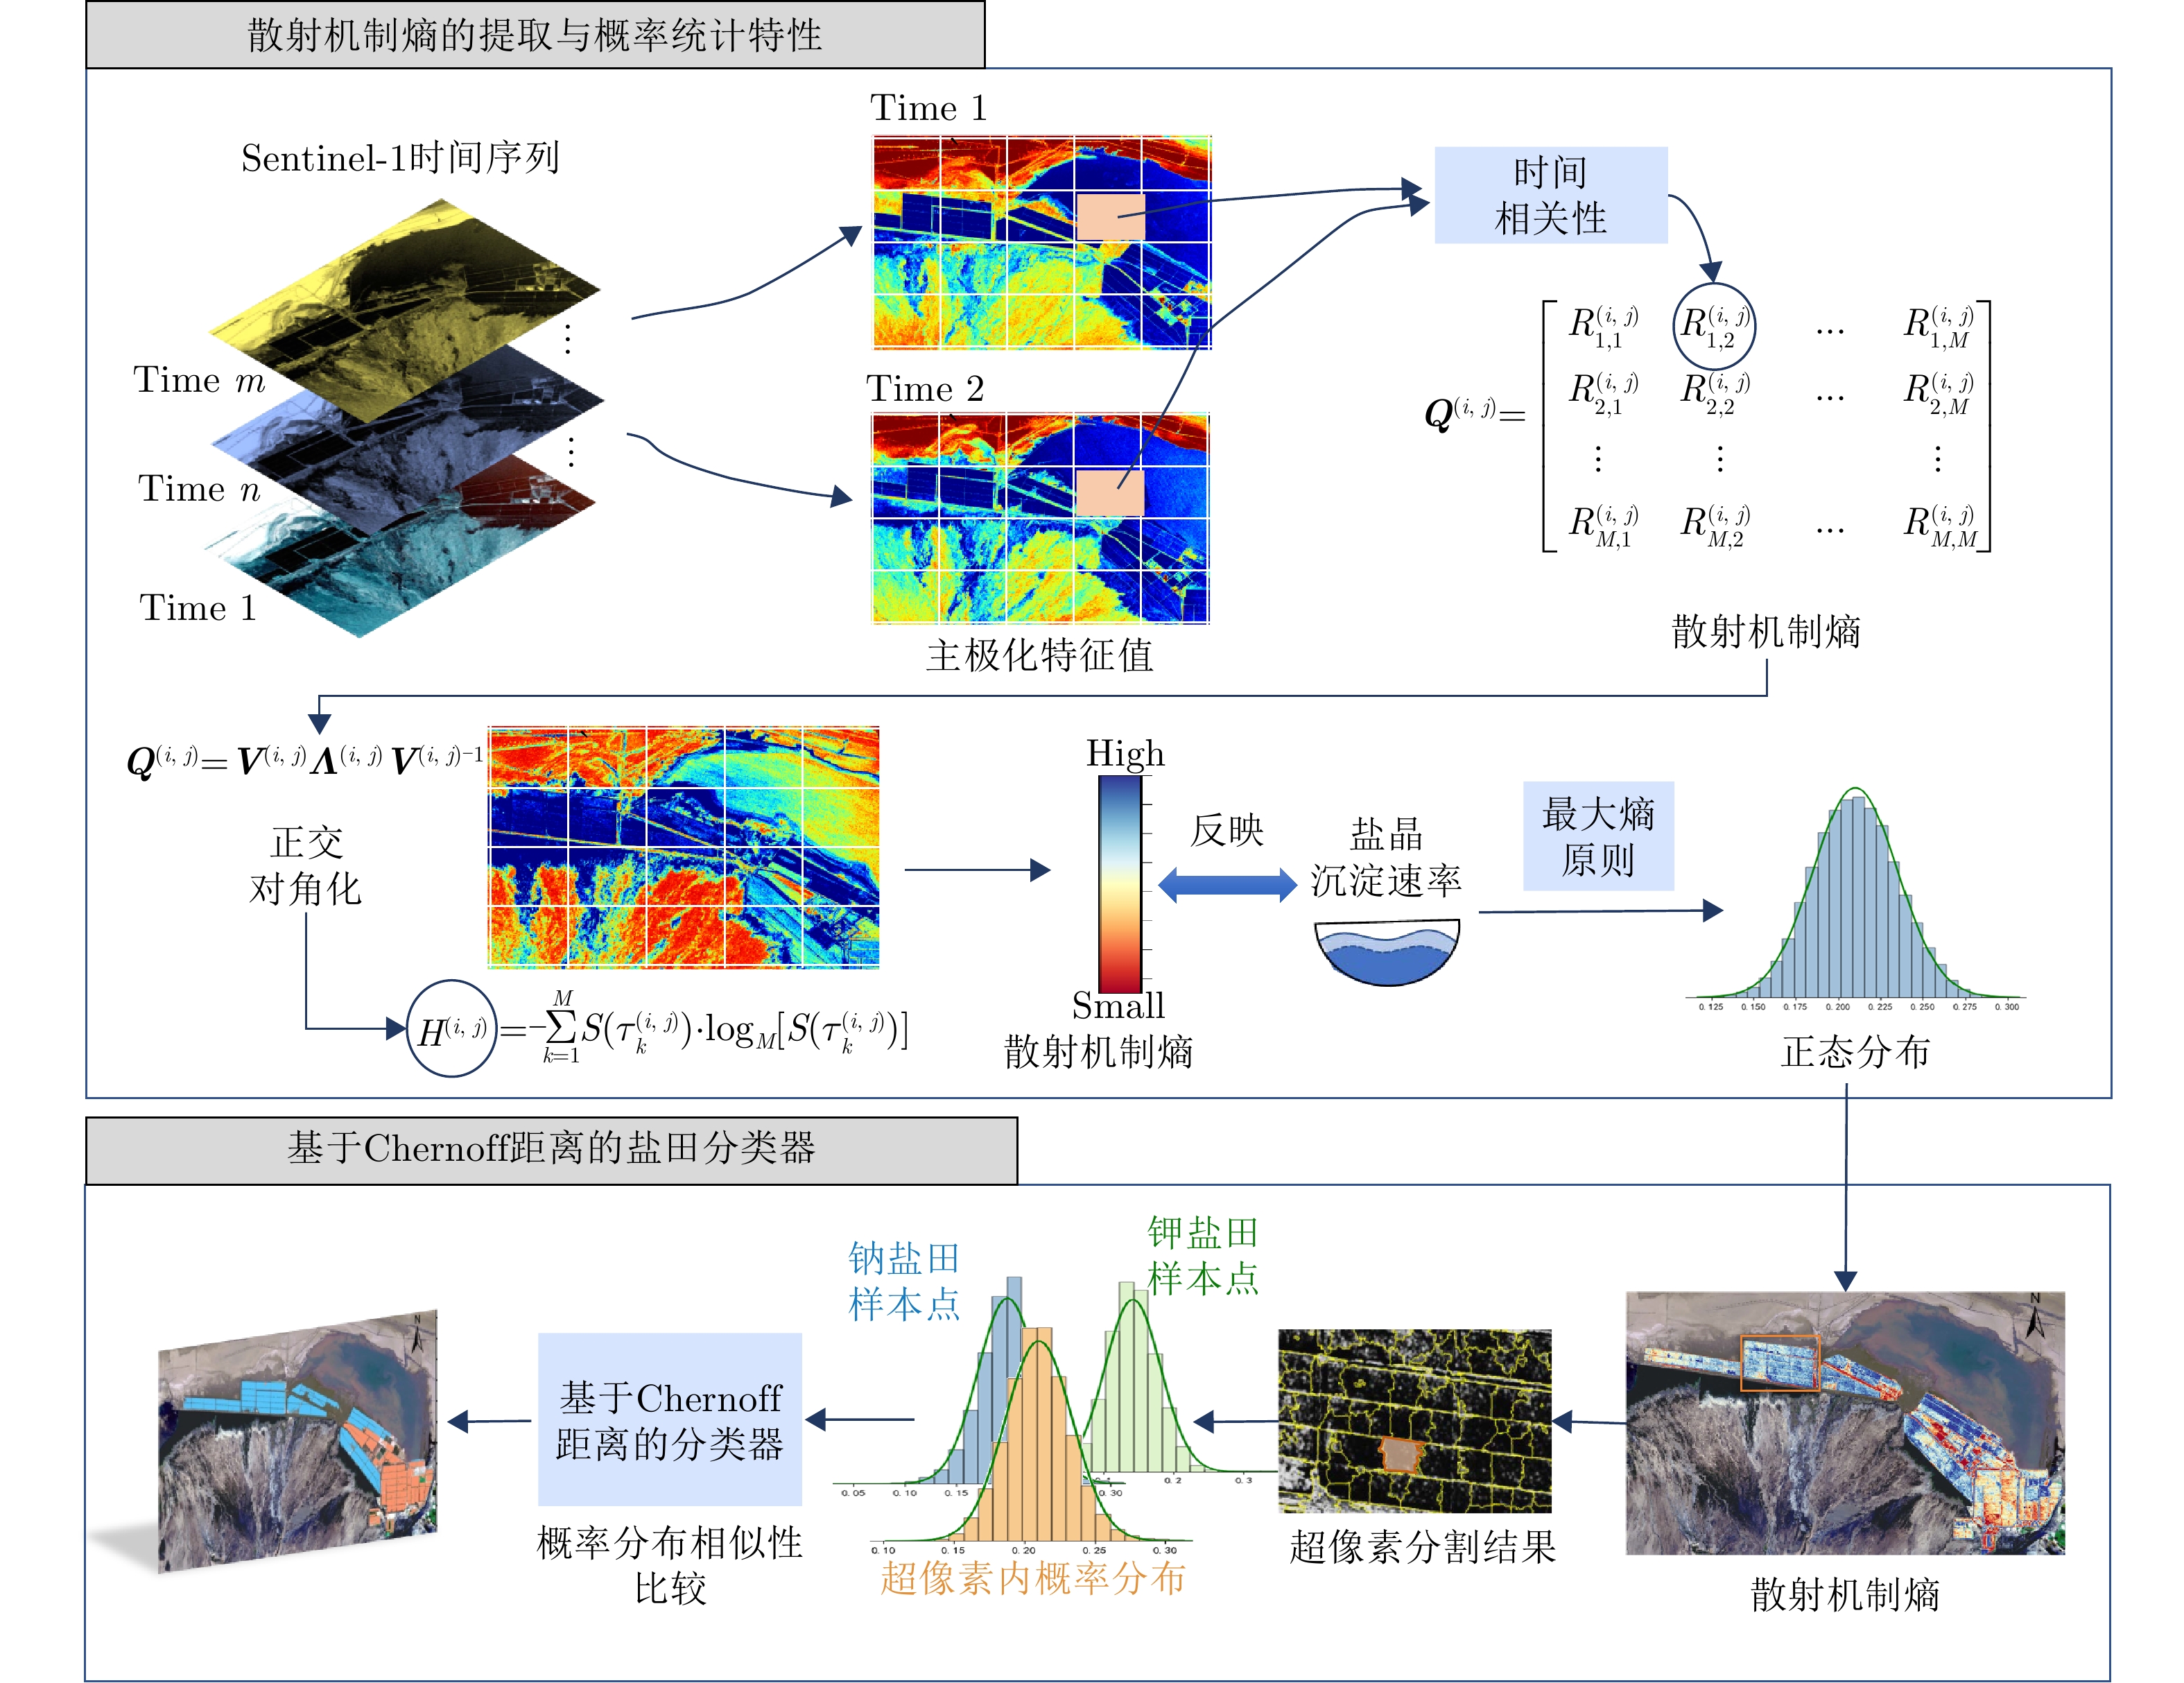
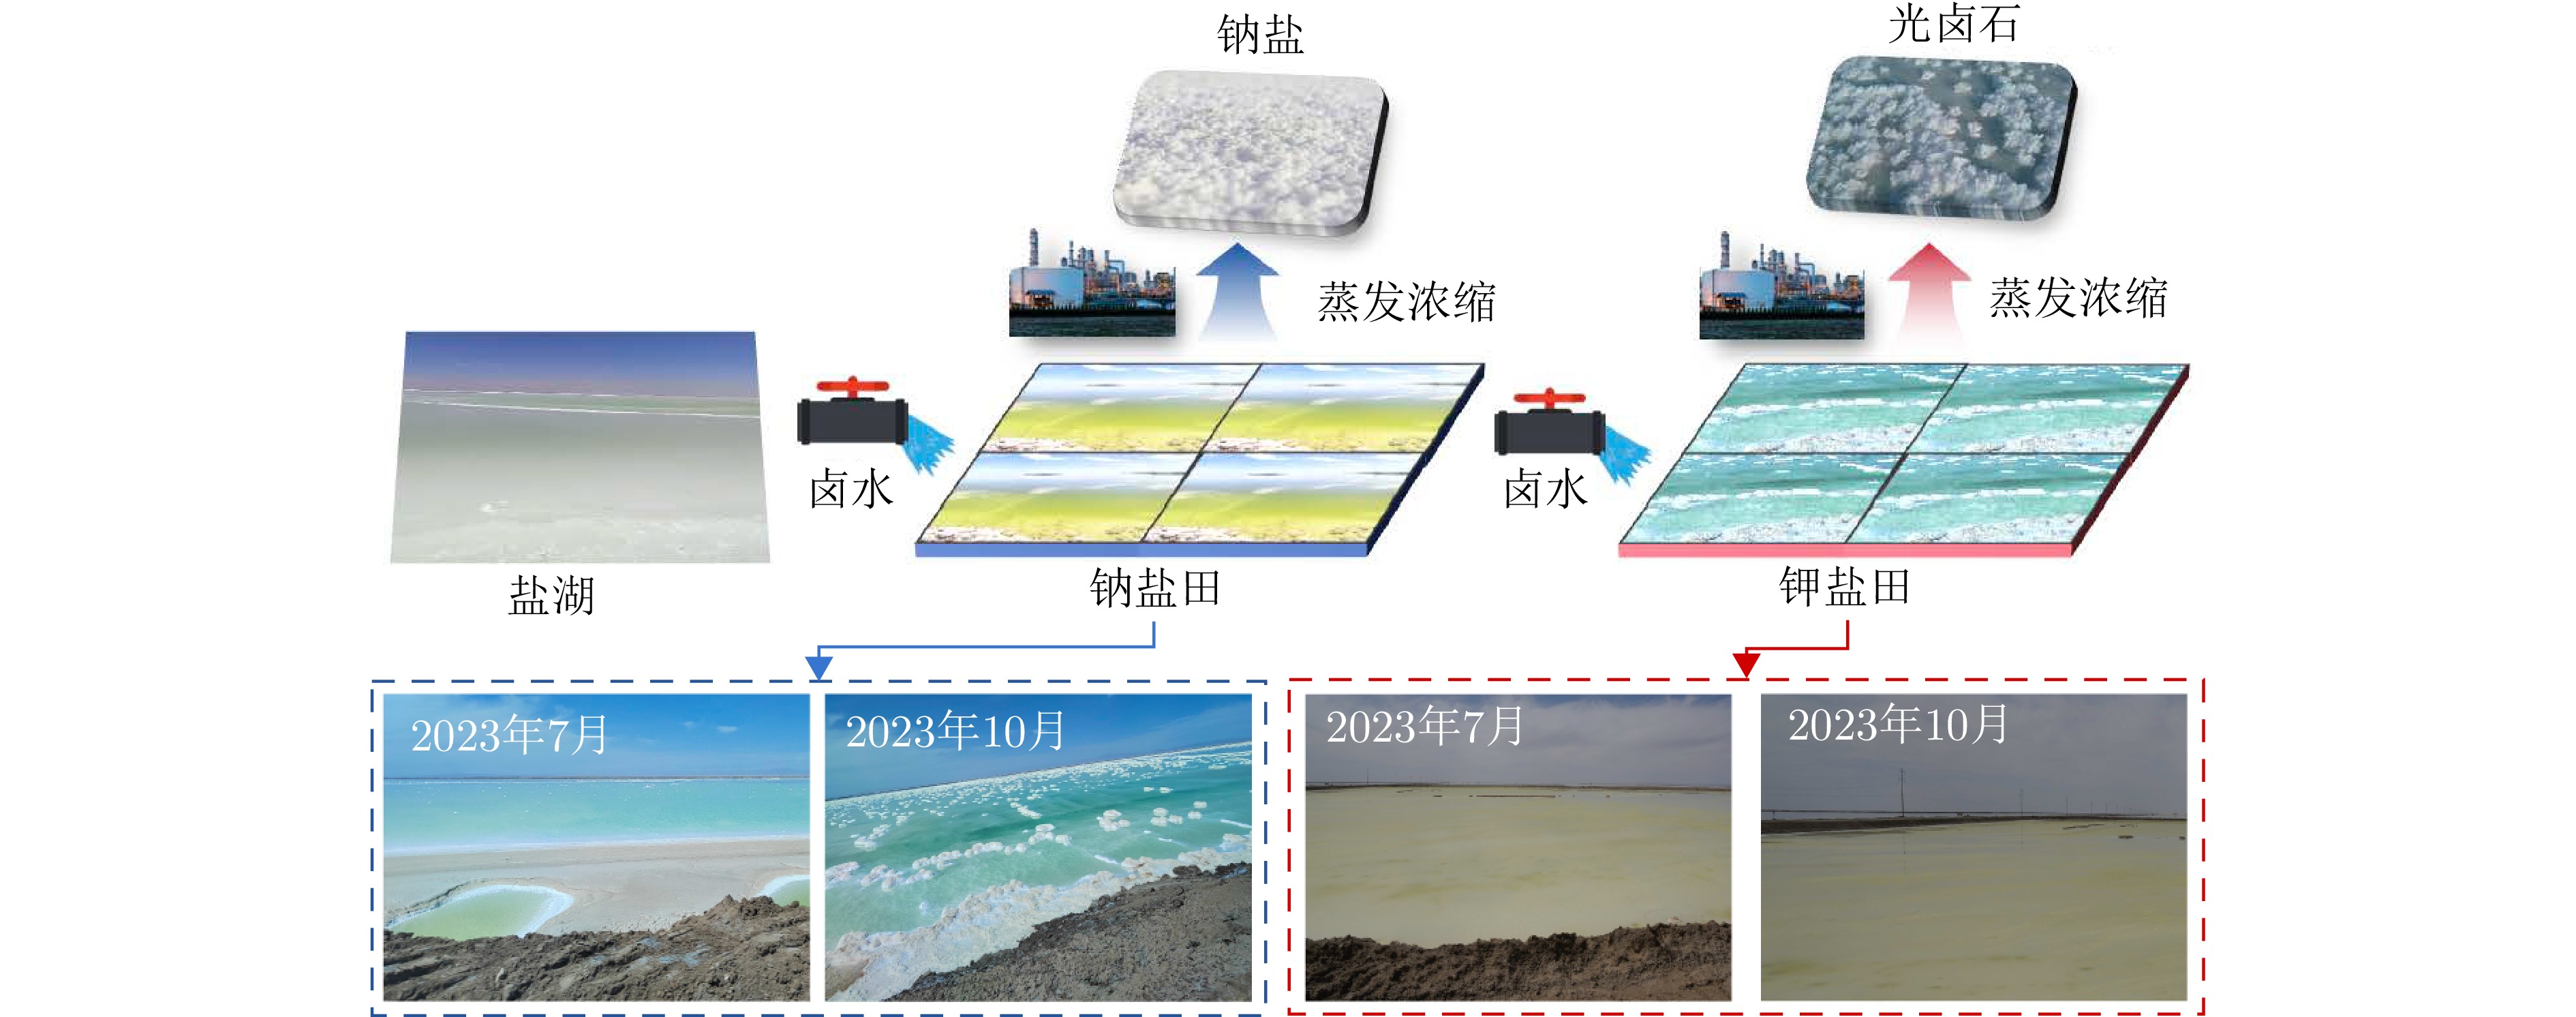
摘要: 盐湖蕴藏丰富的钾锂矿产资源,开采方法为盐田析盐法:盐湖卤水依次转入钠盐田和钾盐田,分别析出钠、钾盐。盐田类型判别是预估盐矿产量、确保高效开采的关键。不同类型的盐田在析盐速度上存在差异,导致在多时相极化合成孔径雷达(SAR)数据中散射强度变化程度不同,因此该文提出了基于多时相极化SAR的盐田区域分类方法。首先,为解决长时间周期内盐田散射特性变化难以准确表征的问题,该文提出了一个新的多时相极化特征,即主散射时间熵。从极化协方差矩阵中提取目标主散射机制,基于主散射机制计算任意两时间极化SAR图像之间时间相关性并构建时间相关矩阵,通过对角化操作从时间相关矩阵中获取地物在时间序列中主要的变化方向和强度,并借鉴熵的概念衡量变化强度情况,对地物的累积变化进行准确表征。其次,该文证明主散射时间熵服从高斯分布,据此提出了基于Chernoff距离的分类器,该分类器利用Chernoff距离比较超像素内主散射时间熵概率分布的相似性来实现分类。该方法在察尔汗盐湖和死海盐湖哨兵1号数据集上分别取得了84.13%和86.13%准确率。相比于现有的时序极化SAR方法,精度提升了10%,分类结果的空间一致性和噪声鲁棒性等方面也优于其他方法。
-
关键词:
- 极化合成孔径雷达 /
- 多时相极化特征 /
- 主散射时间熵 /
- Chernoff距离 /
- 盐田分类
Abstract: Salt lakes, rich in potassium and lithium mineral resources, are typically mined using the salt field crystallization method. Specifically, brine is first moved to sodium salt fields where sodium salts crystallize, and then it is moved to potassium salt fields for the precipitation of potassium salts. Determining the type of salt field is essential for accurately estimating salt production and ensuring efficient mining operations. Because different types of salt fields exhibit different salt precipitation rates, they also produce distinct variations in scattering intensity that can be observed in multi-temporal Polarimetric Synthetic Aperture Radar (PolSAR) data. To explore this property, this study proposes a salt field classification method based on multi-temporal PolSAR. First, to accurately characterize the long-term scattering variations in salt fields, a new multi-temporal polarization feature, i.e., dominant scattering temporal entropy, is introduced. The main scattering mechanism of the target area is extracted from the polarimetric covariance matrix, from which the temporal correlation between any two PolSAR images is calculated to construct a temporal correlation matrix. The principal change direction and magnitude of scattering variation in land cover across the time series are then obtained from the temporal correlation matrix through diagonalization, and entropy is used to quantify change intensity and provide an accurate measure of cumulative change. Second, this study demonstrates that the dominant scattering temporal entropy follows the Gaussian distribution, enabling the design of a classifier based on Chernoff distance. Classification is performed by comparing the Chernoff distance of entropy probability distributions within superpixels. The proposed method achieves overall classification accuracies of 84.13% and 86.13% on the Qarhan Salt Lake and Dead Sea Sentinel-1 datasets, respectively, representing an improvement of about 10% over existing time-series PolSAR methods. The classification results exhibit superior spatial consistency and noise robustness compared with other methods. -
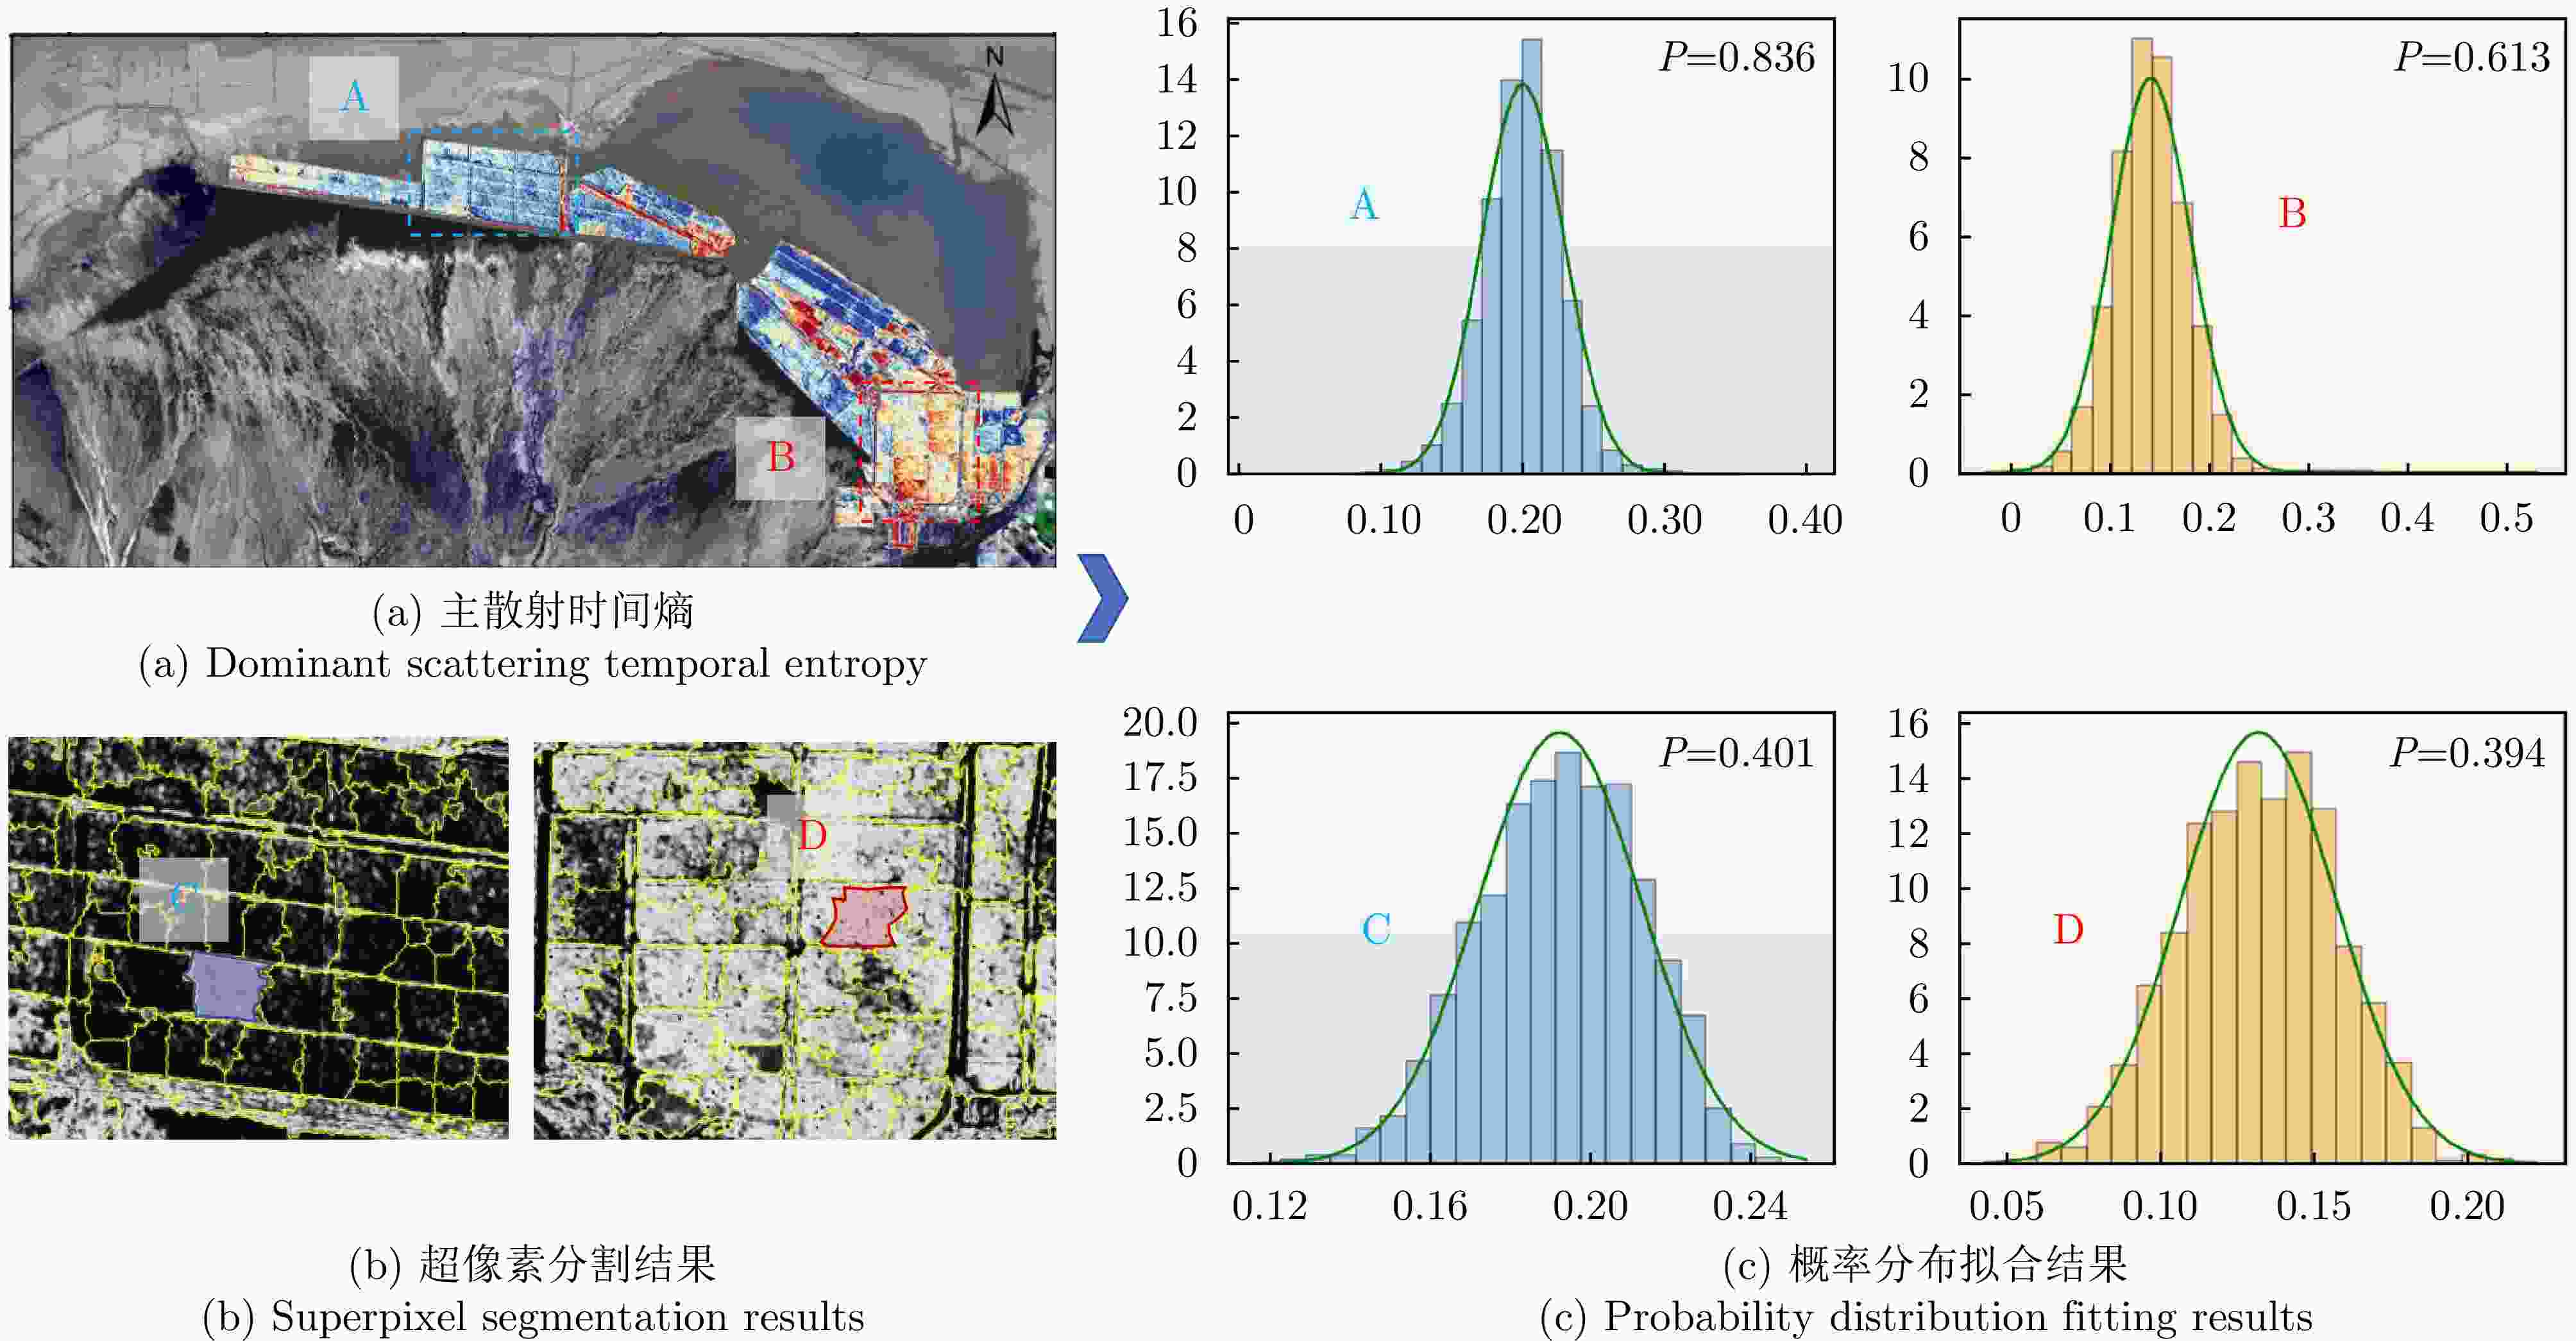
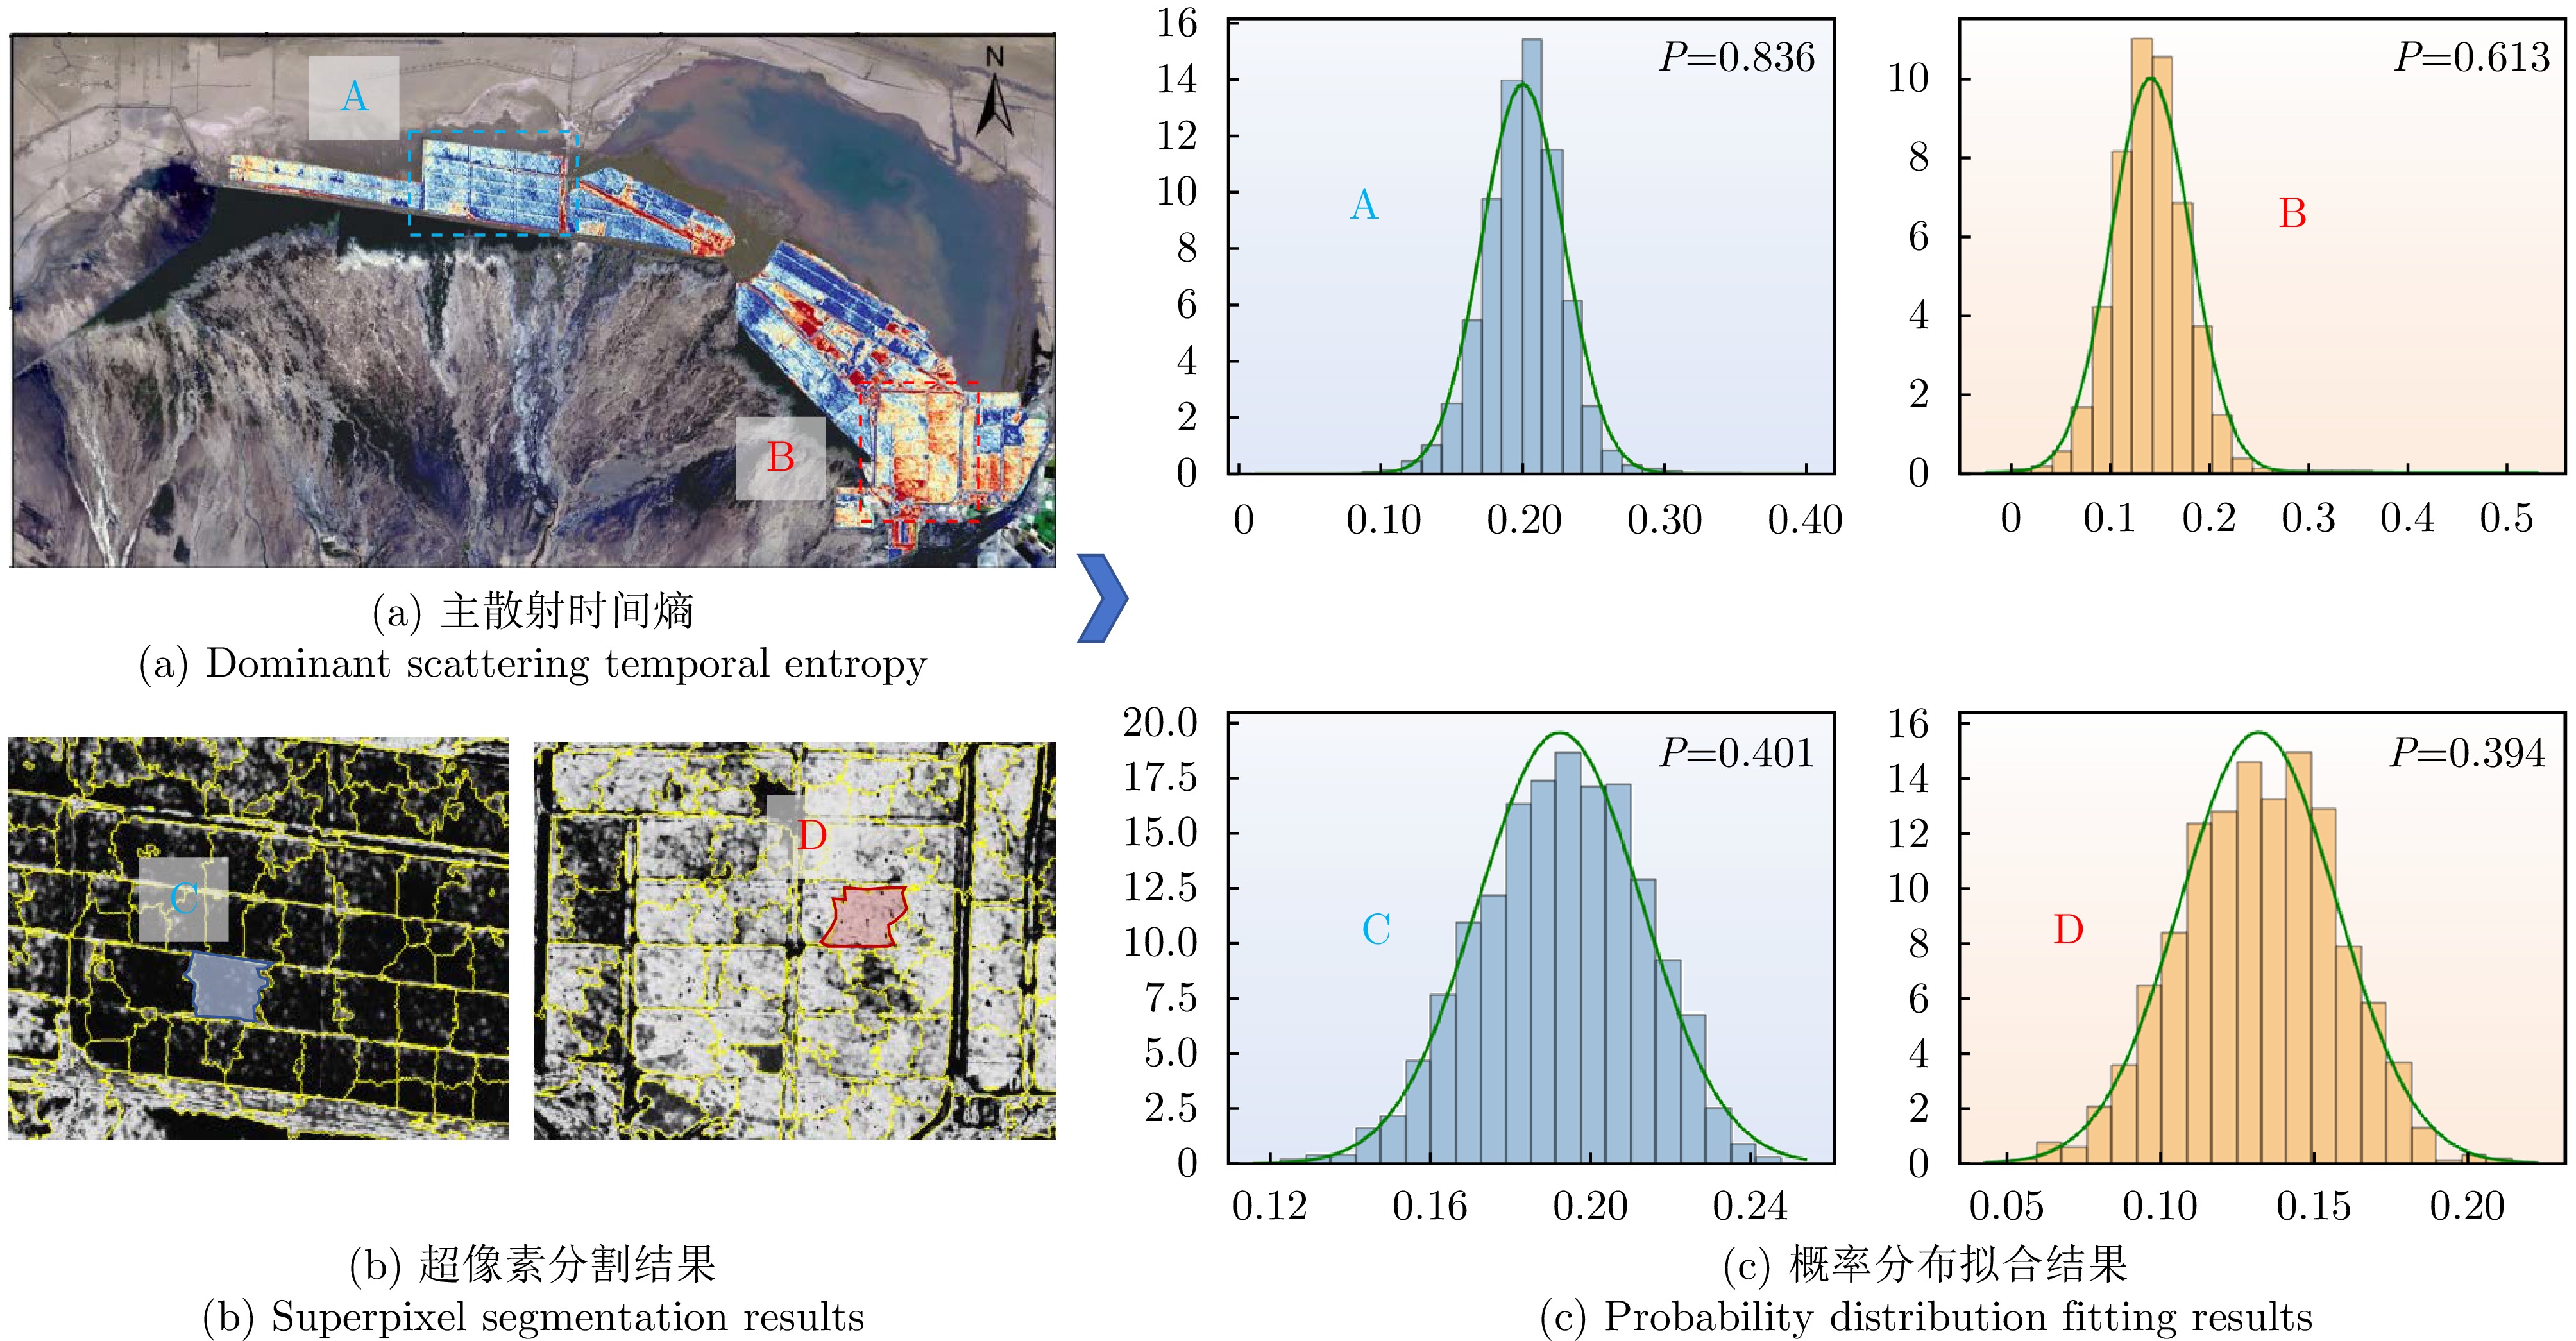
图 4 超像素分割和正态分布拟合结果
Figure 4. Superpixel segmentation and normal distribution fitting results
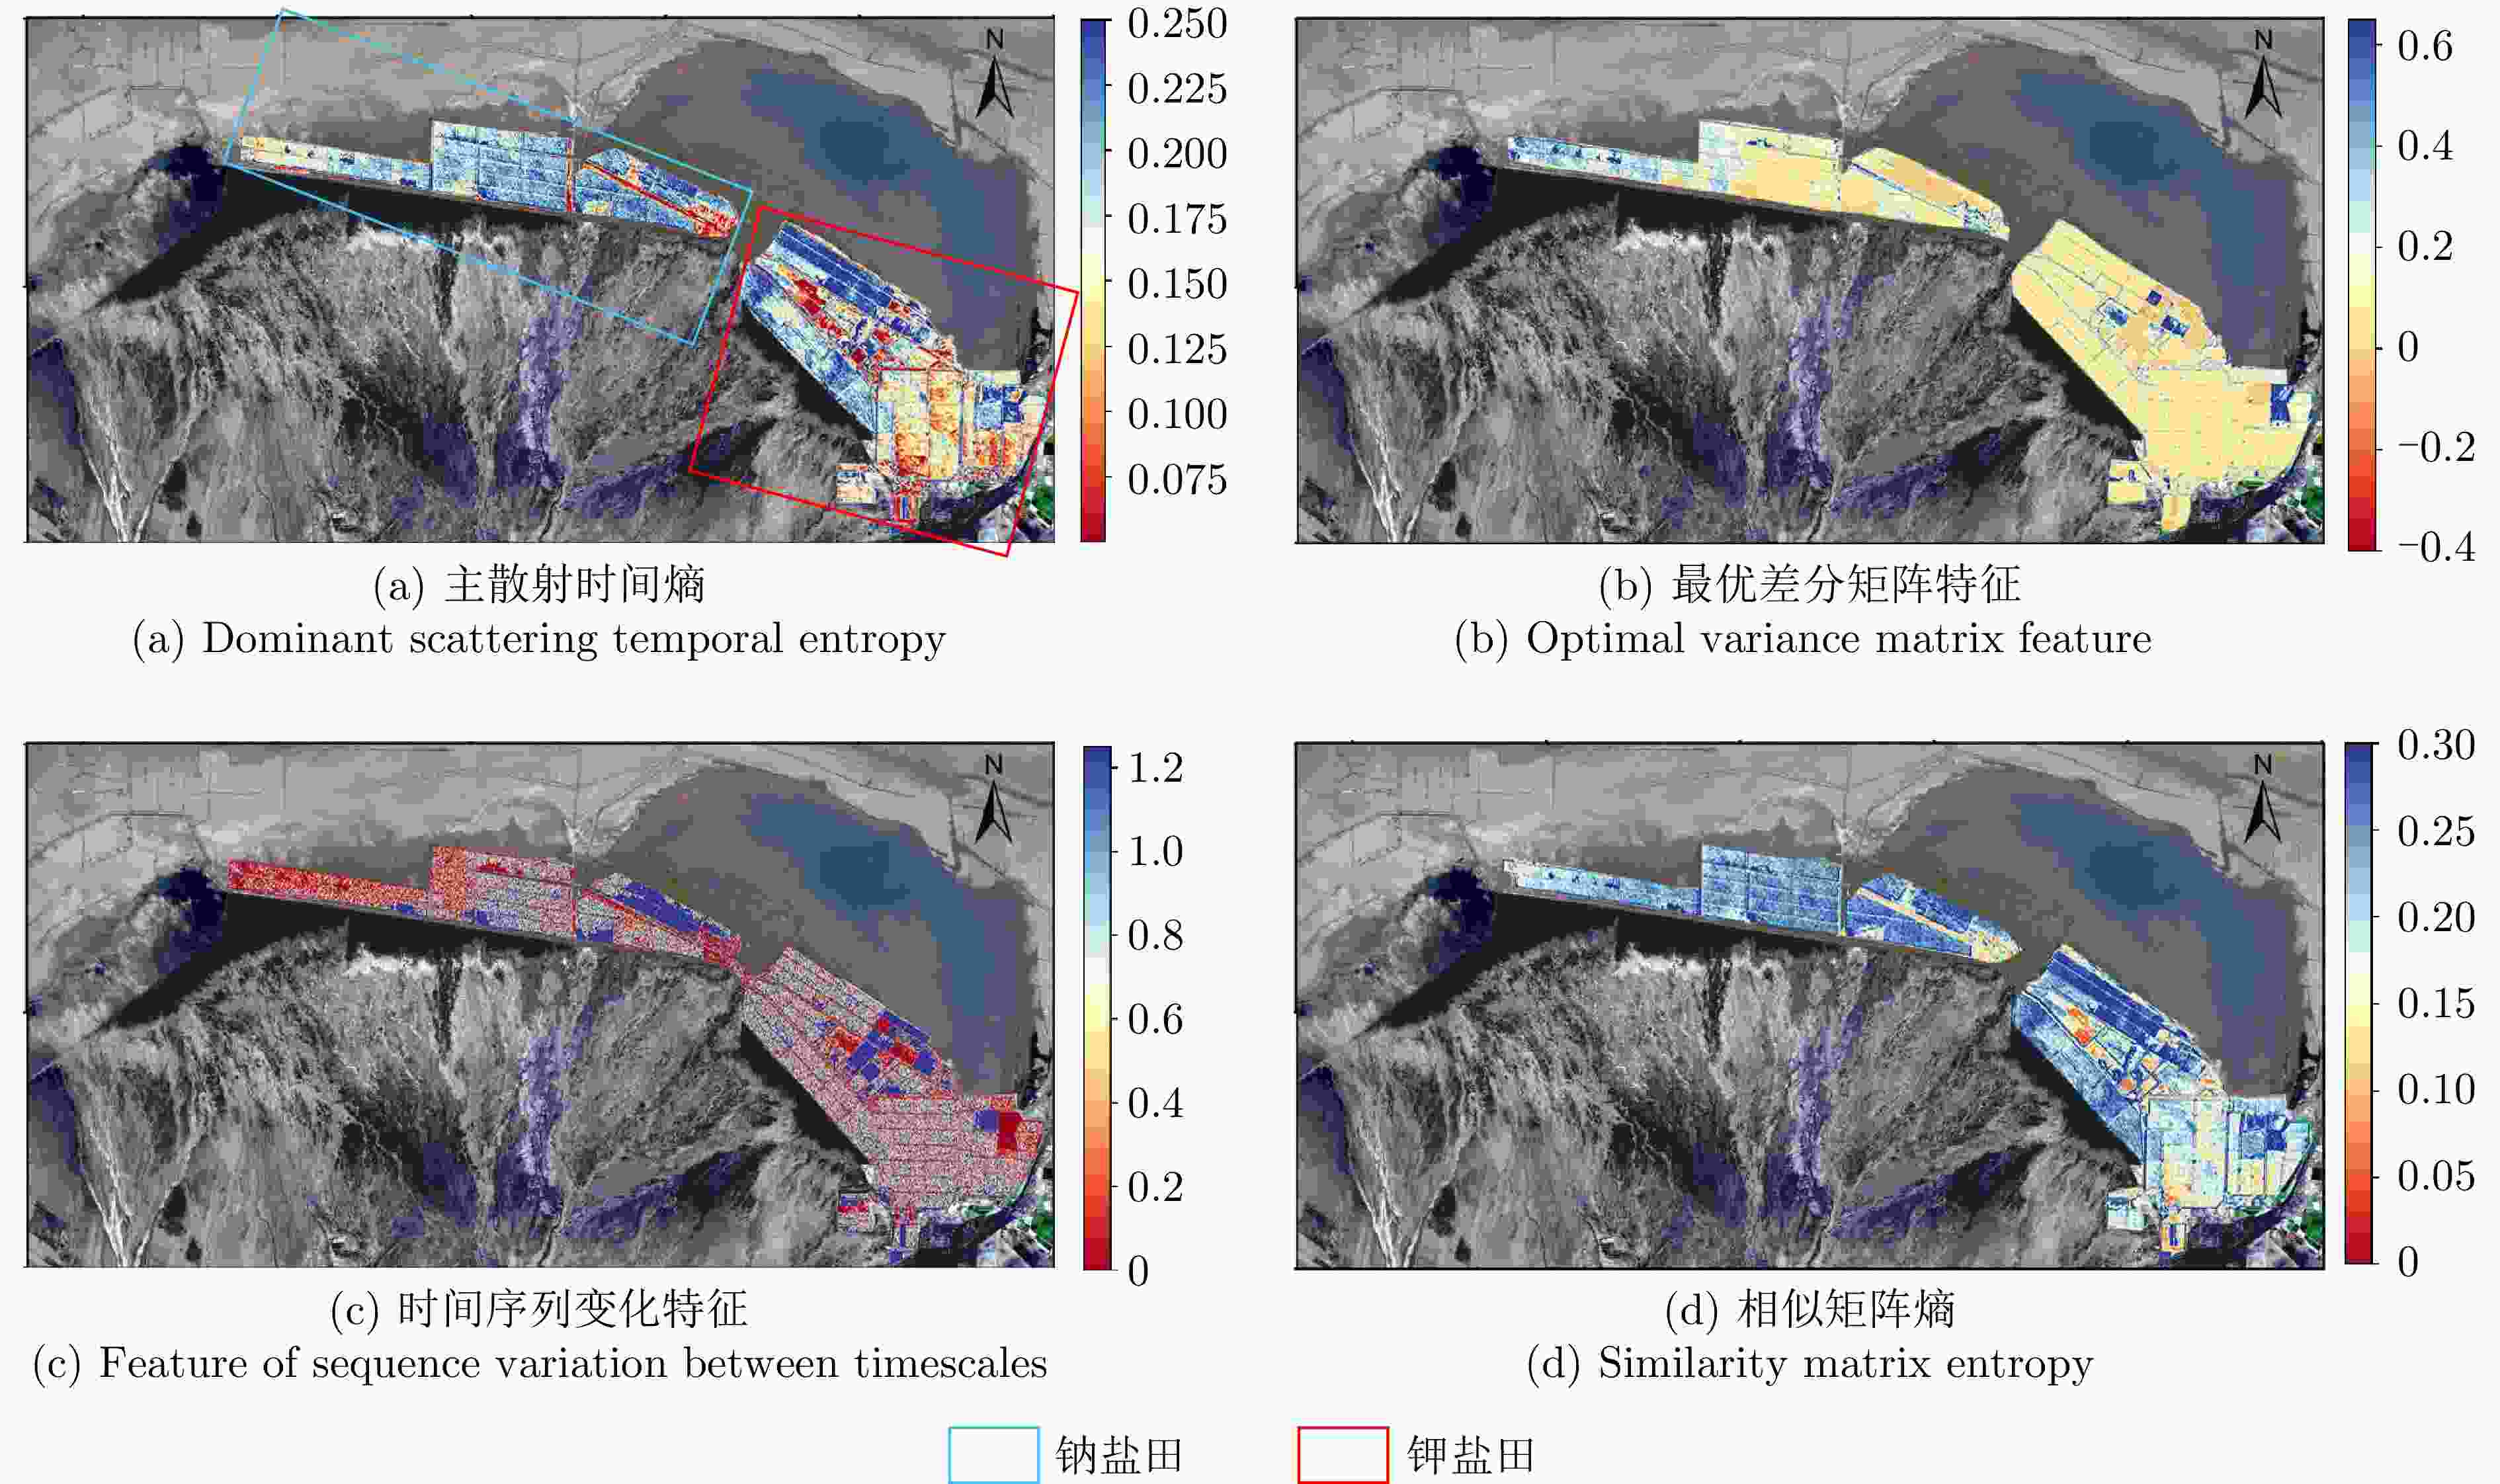
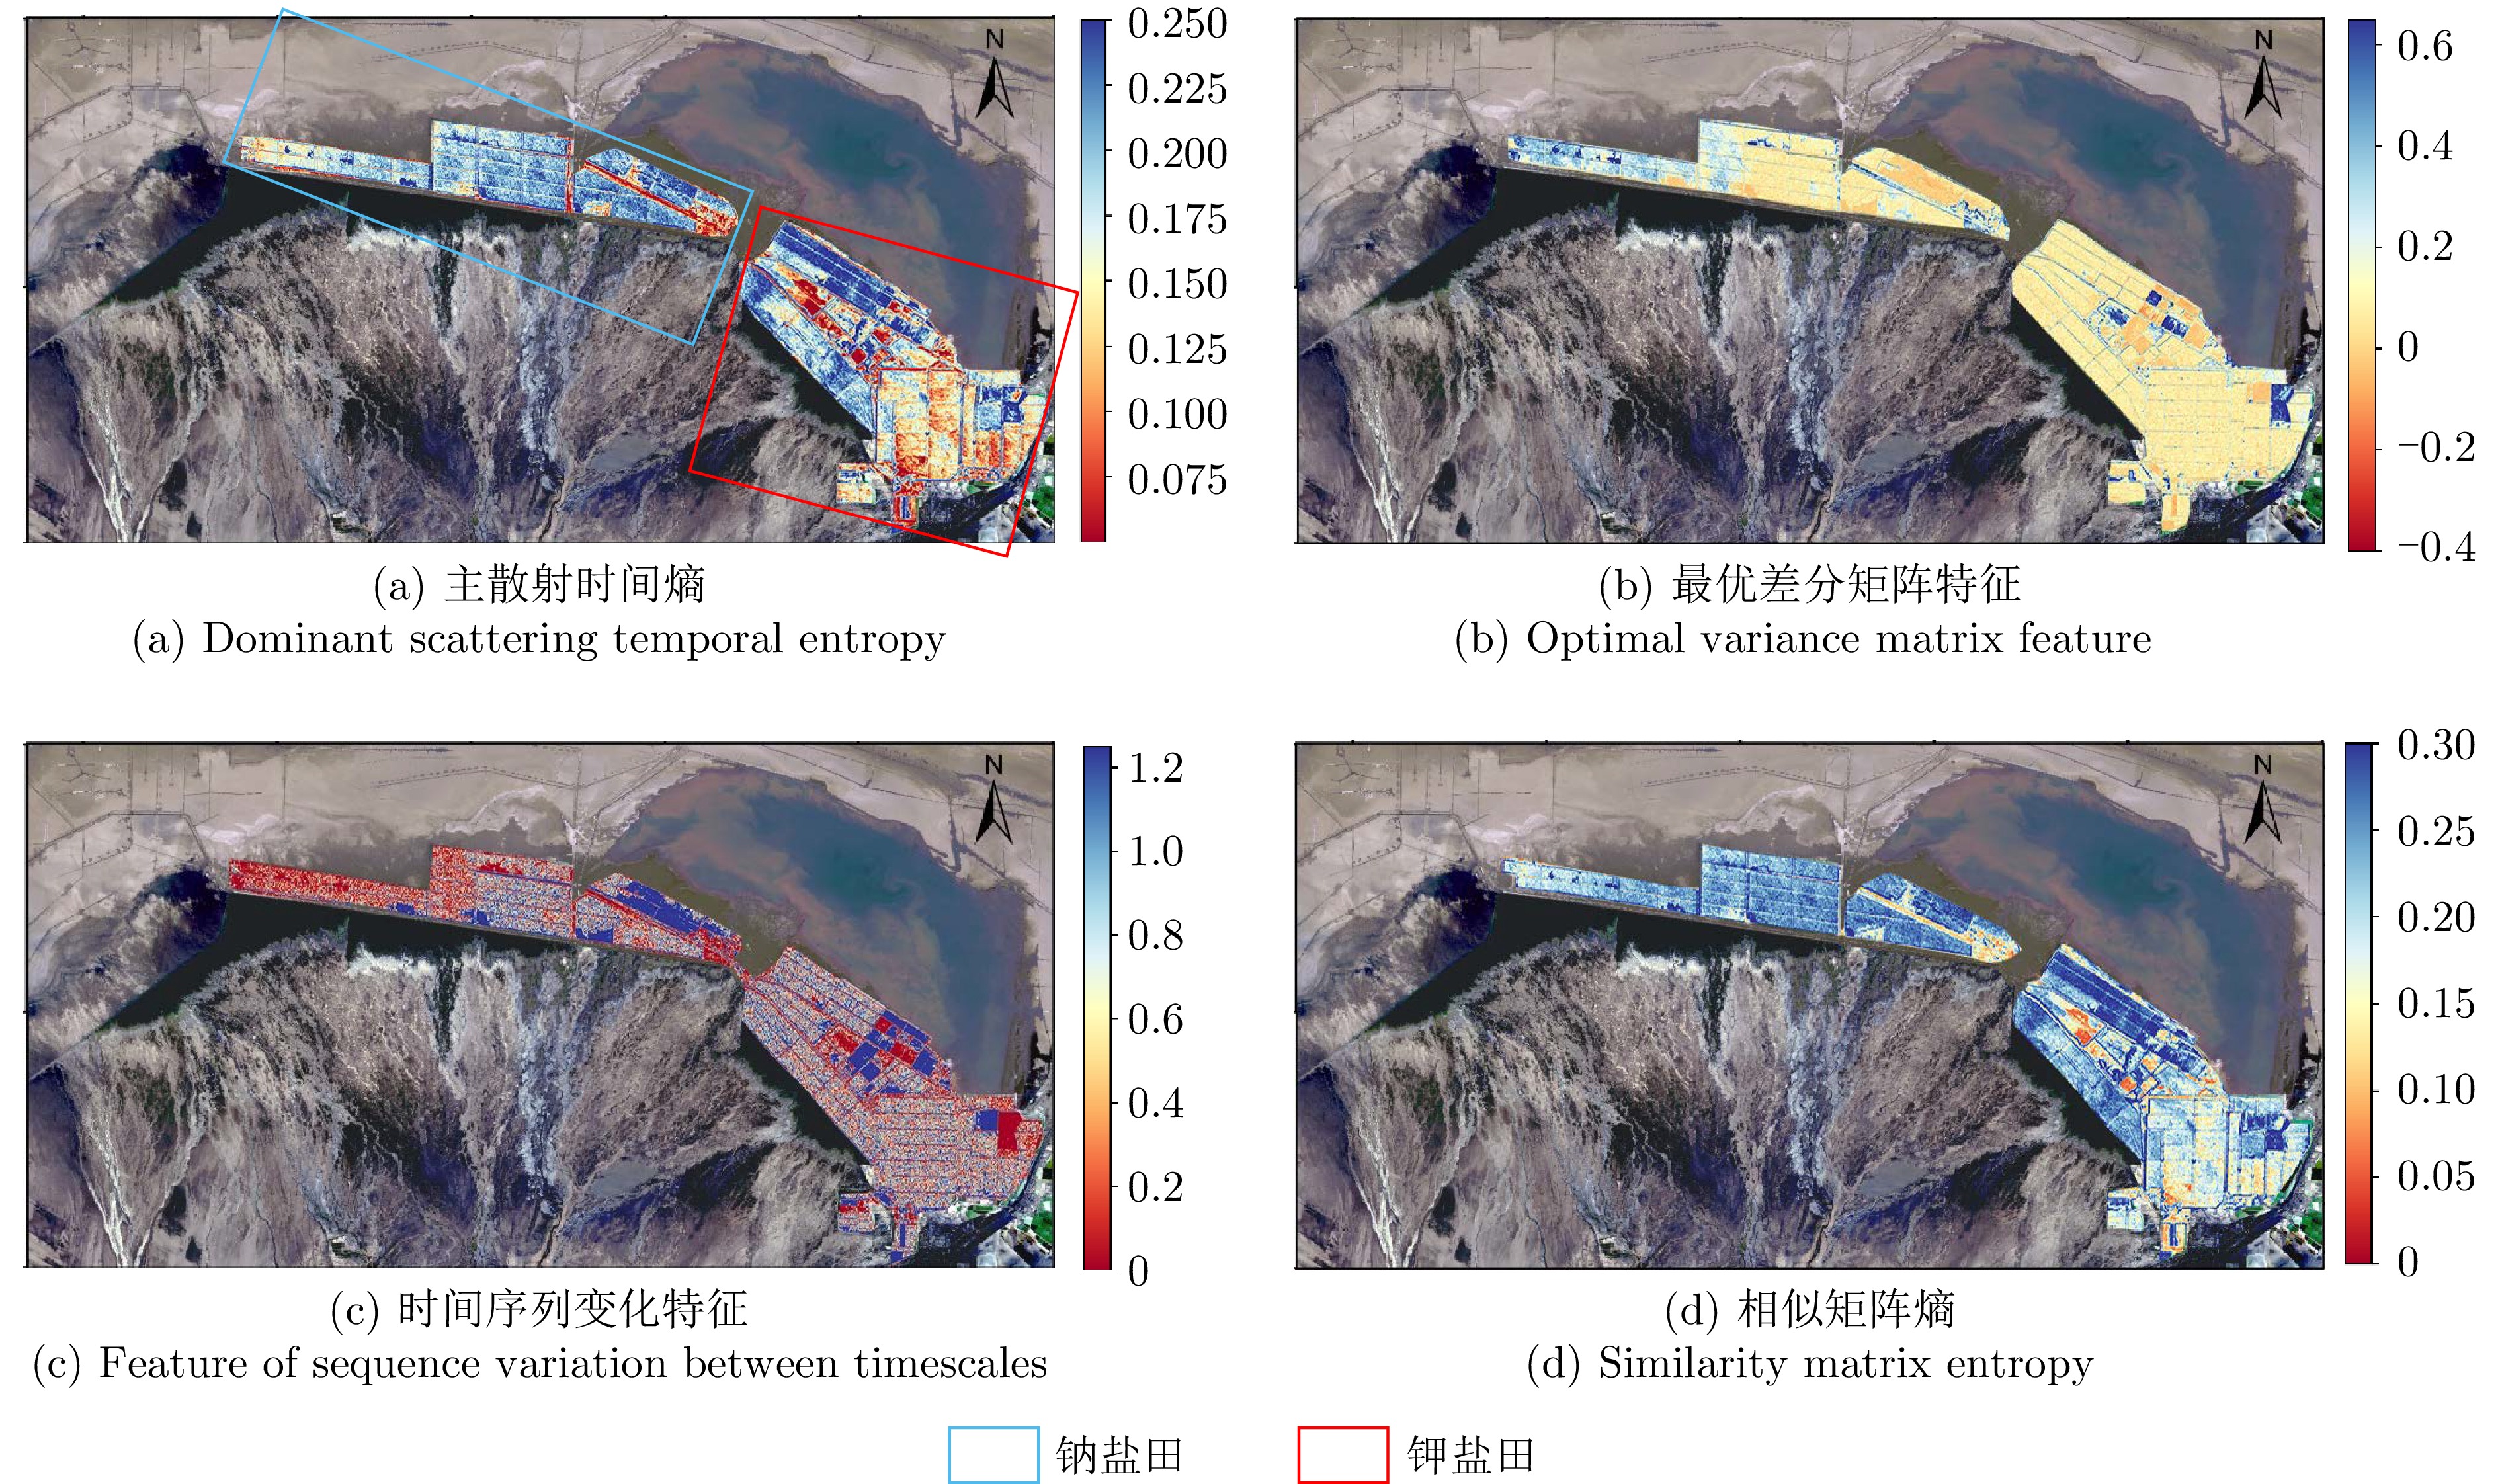
图 5 察尔汗盐湖数据集上不同多时相极化特征可视化比较
Figure 5. A visual comparison of different multi-temporal polarization features on the Qarhan Salt Lake dataset
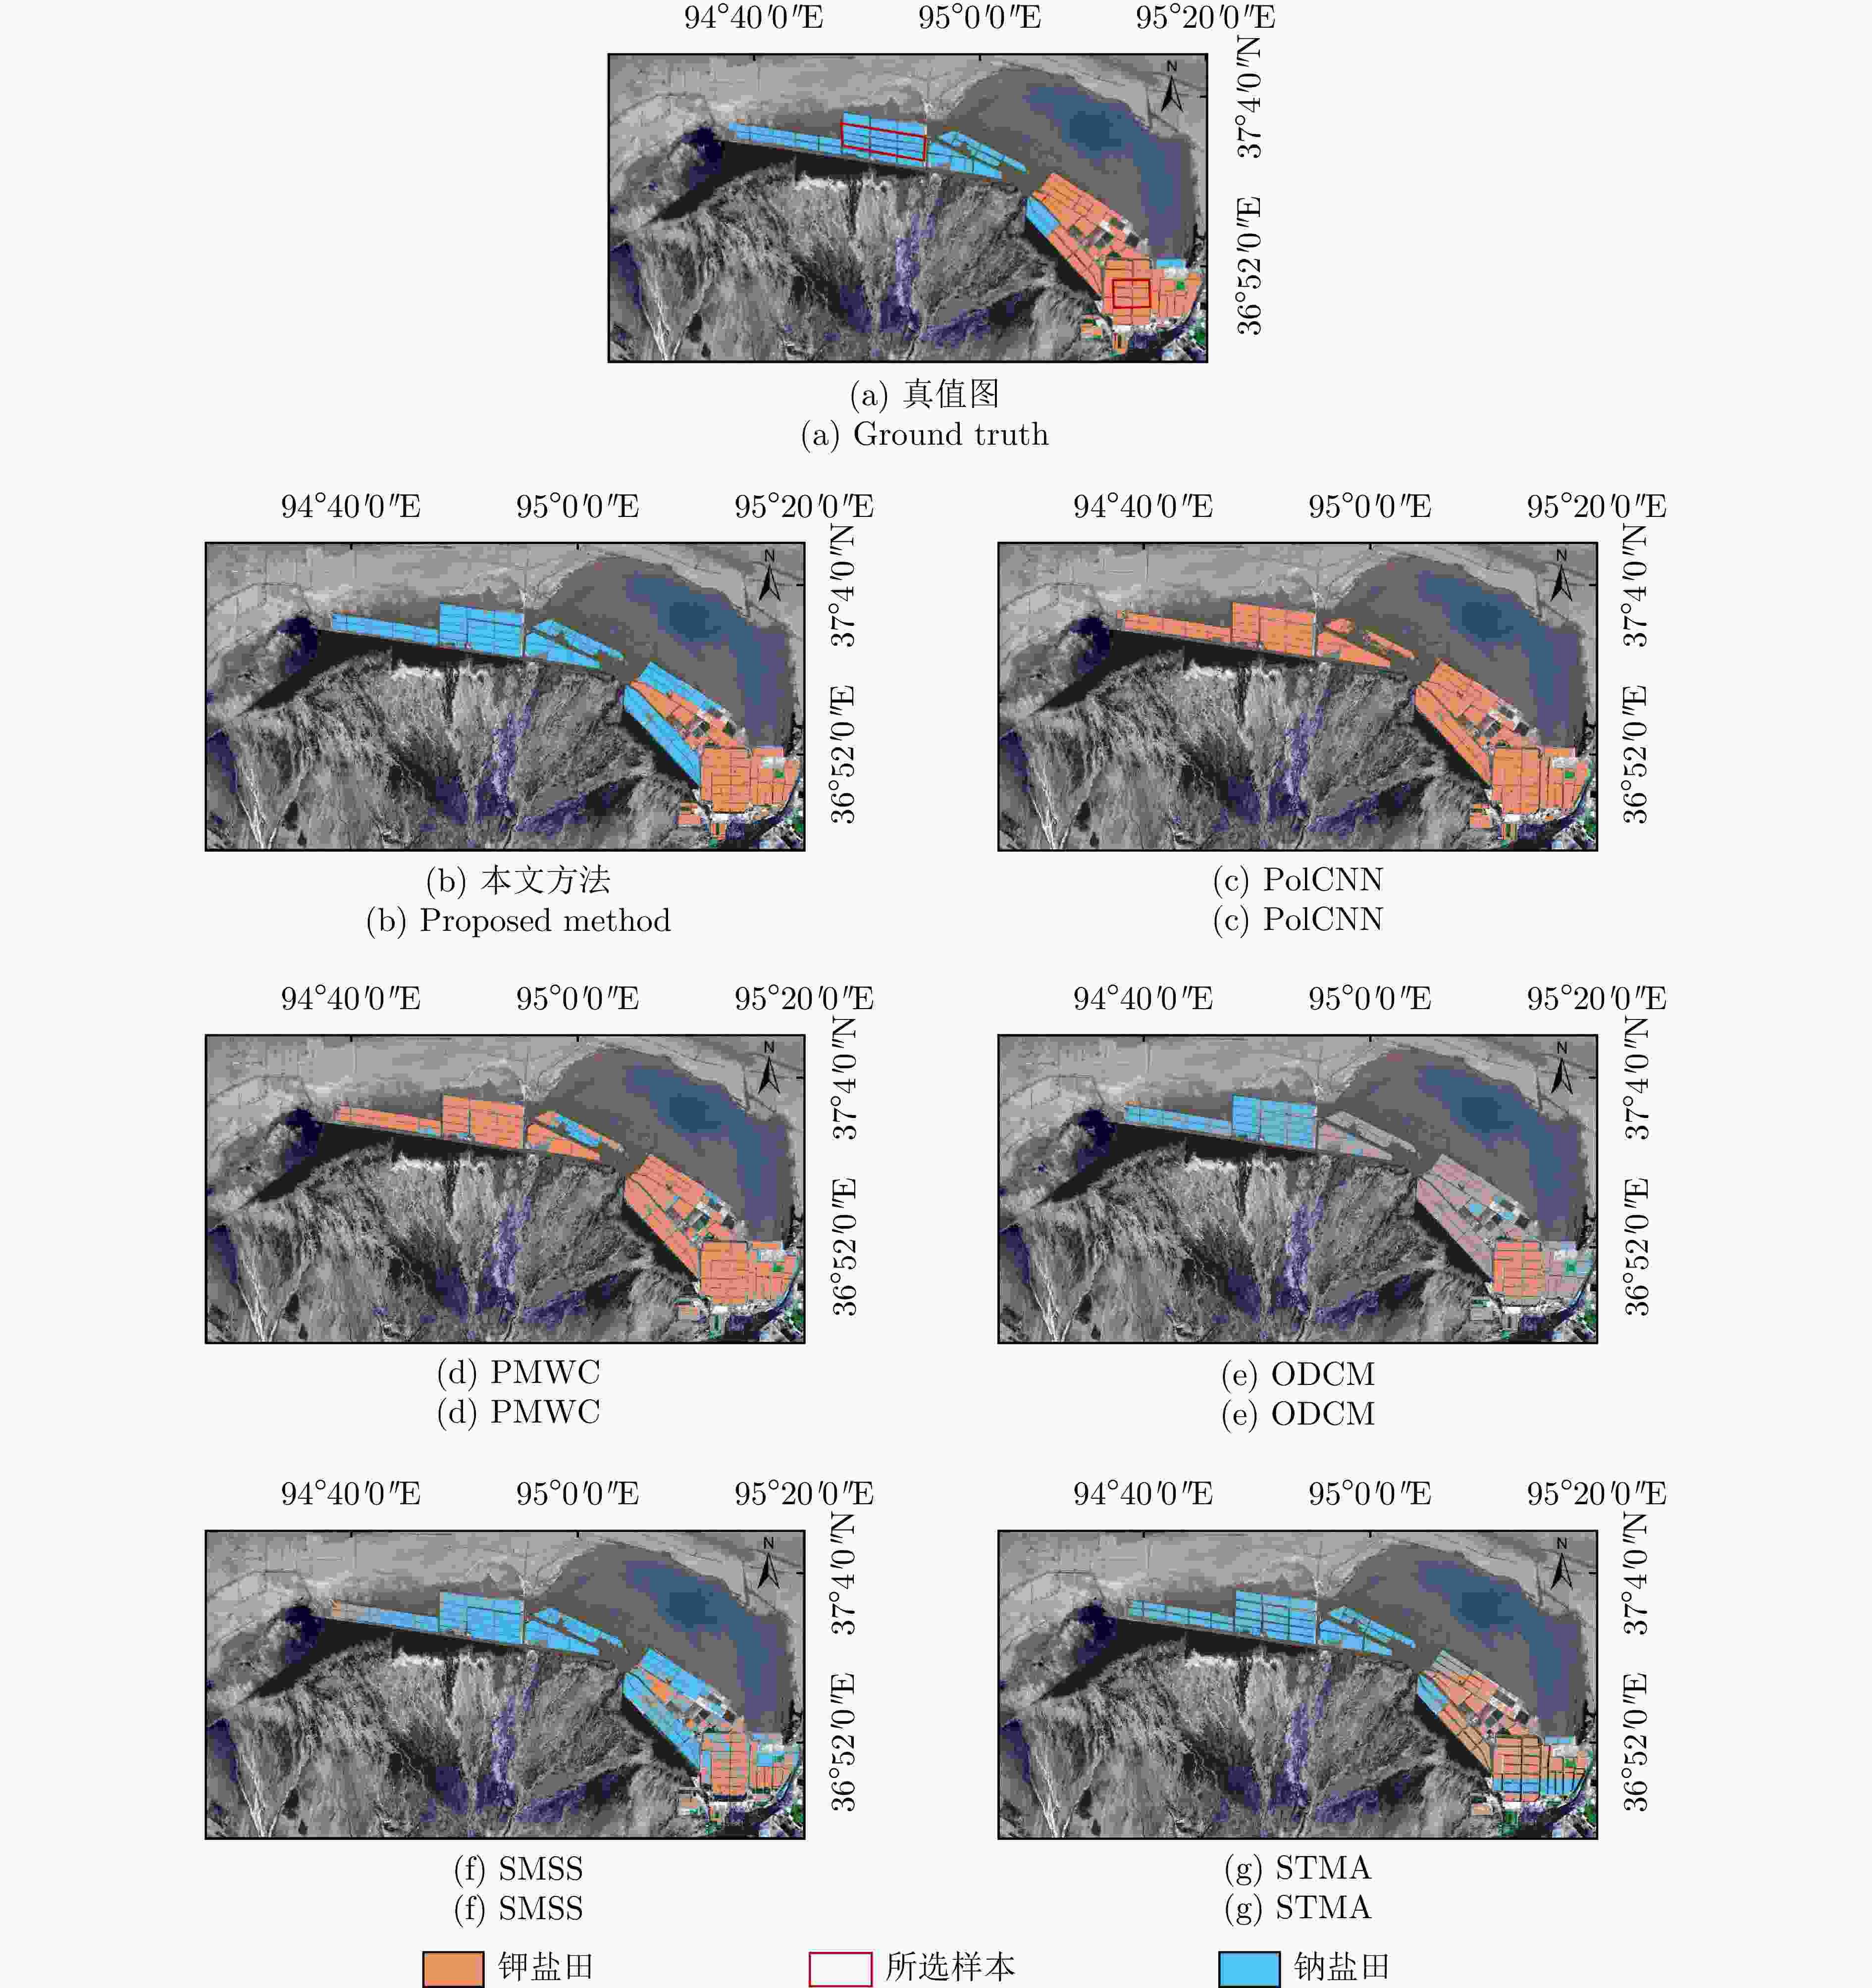
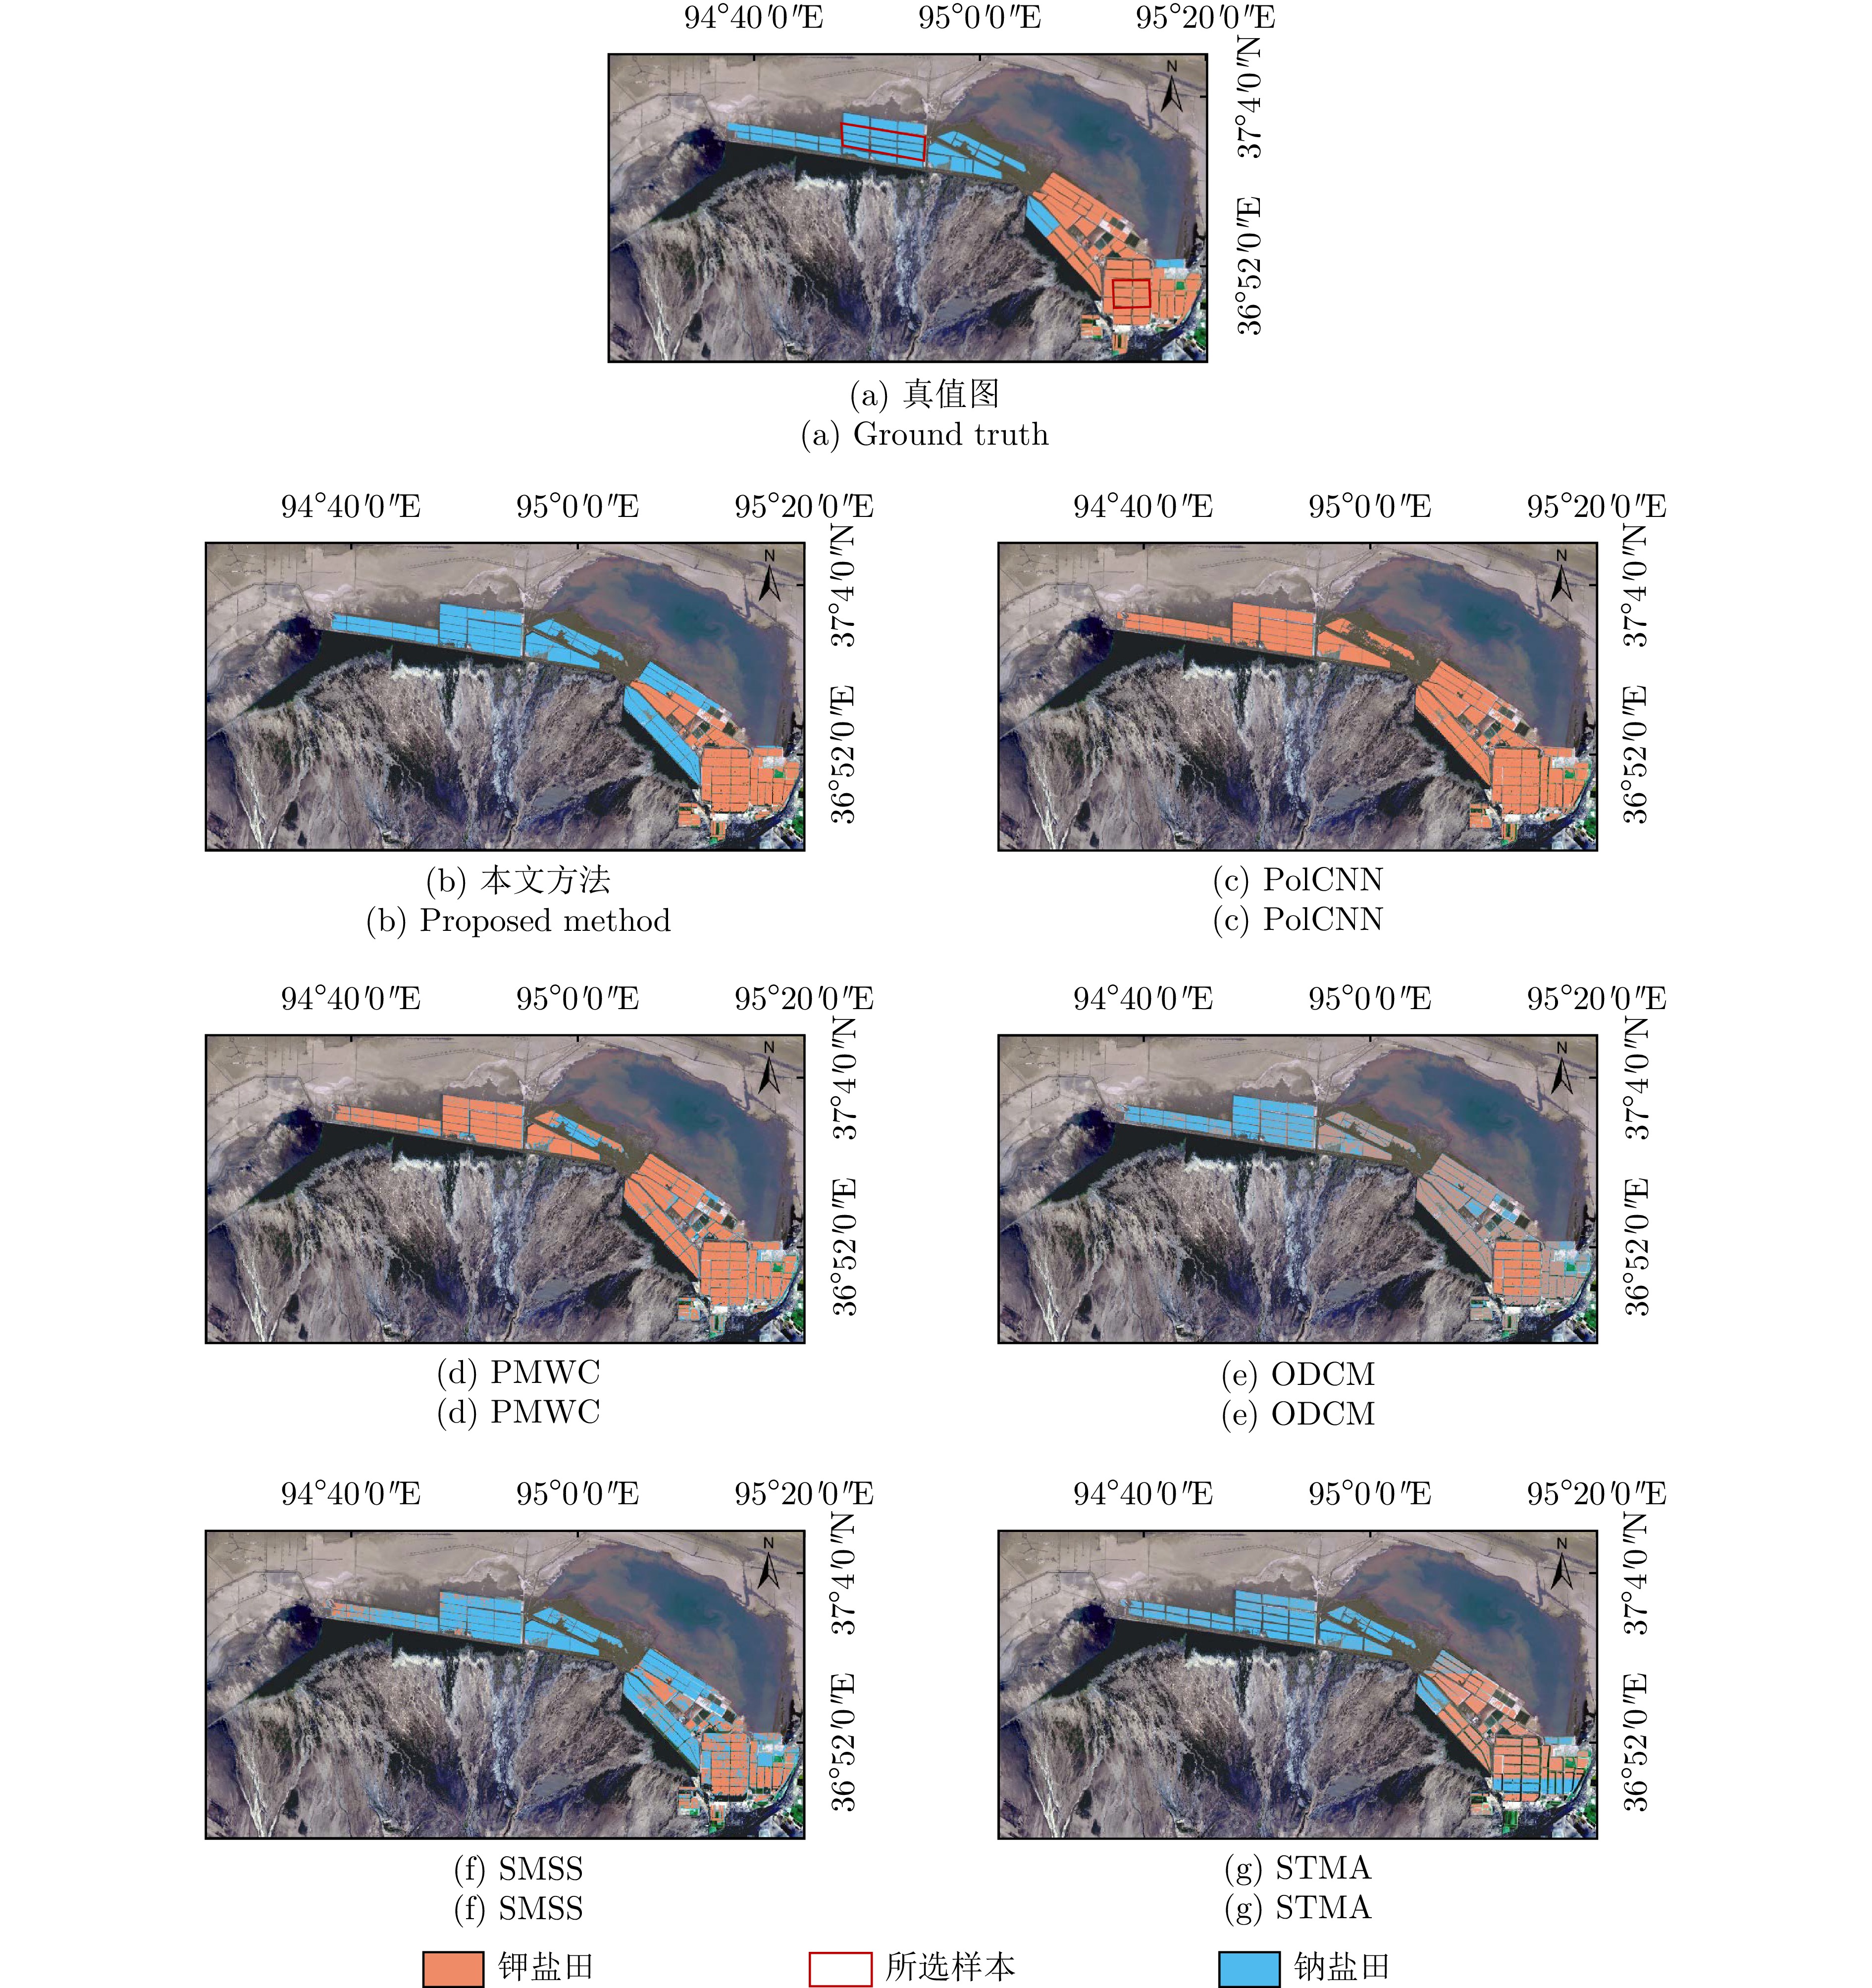
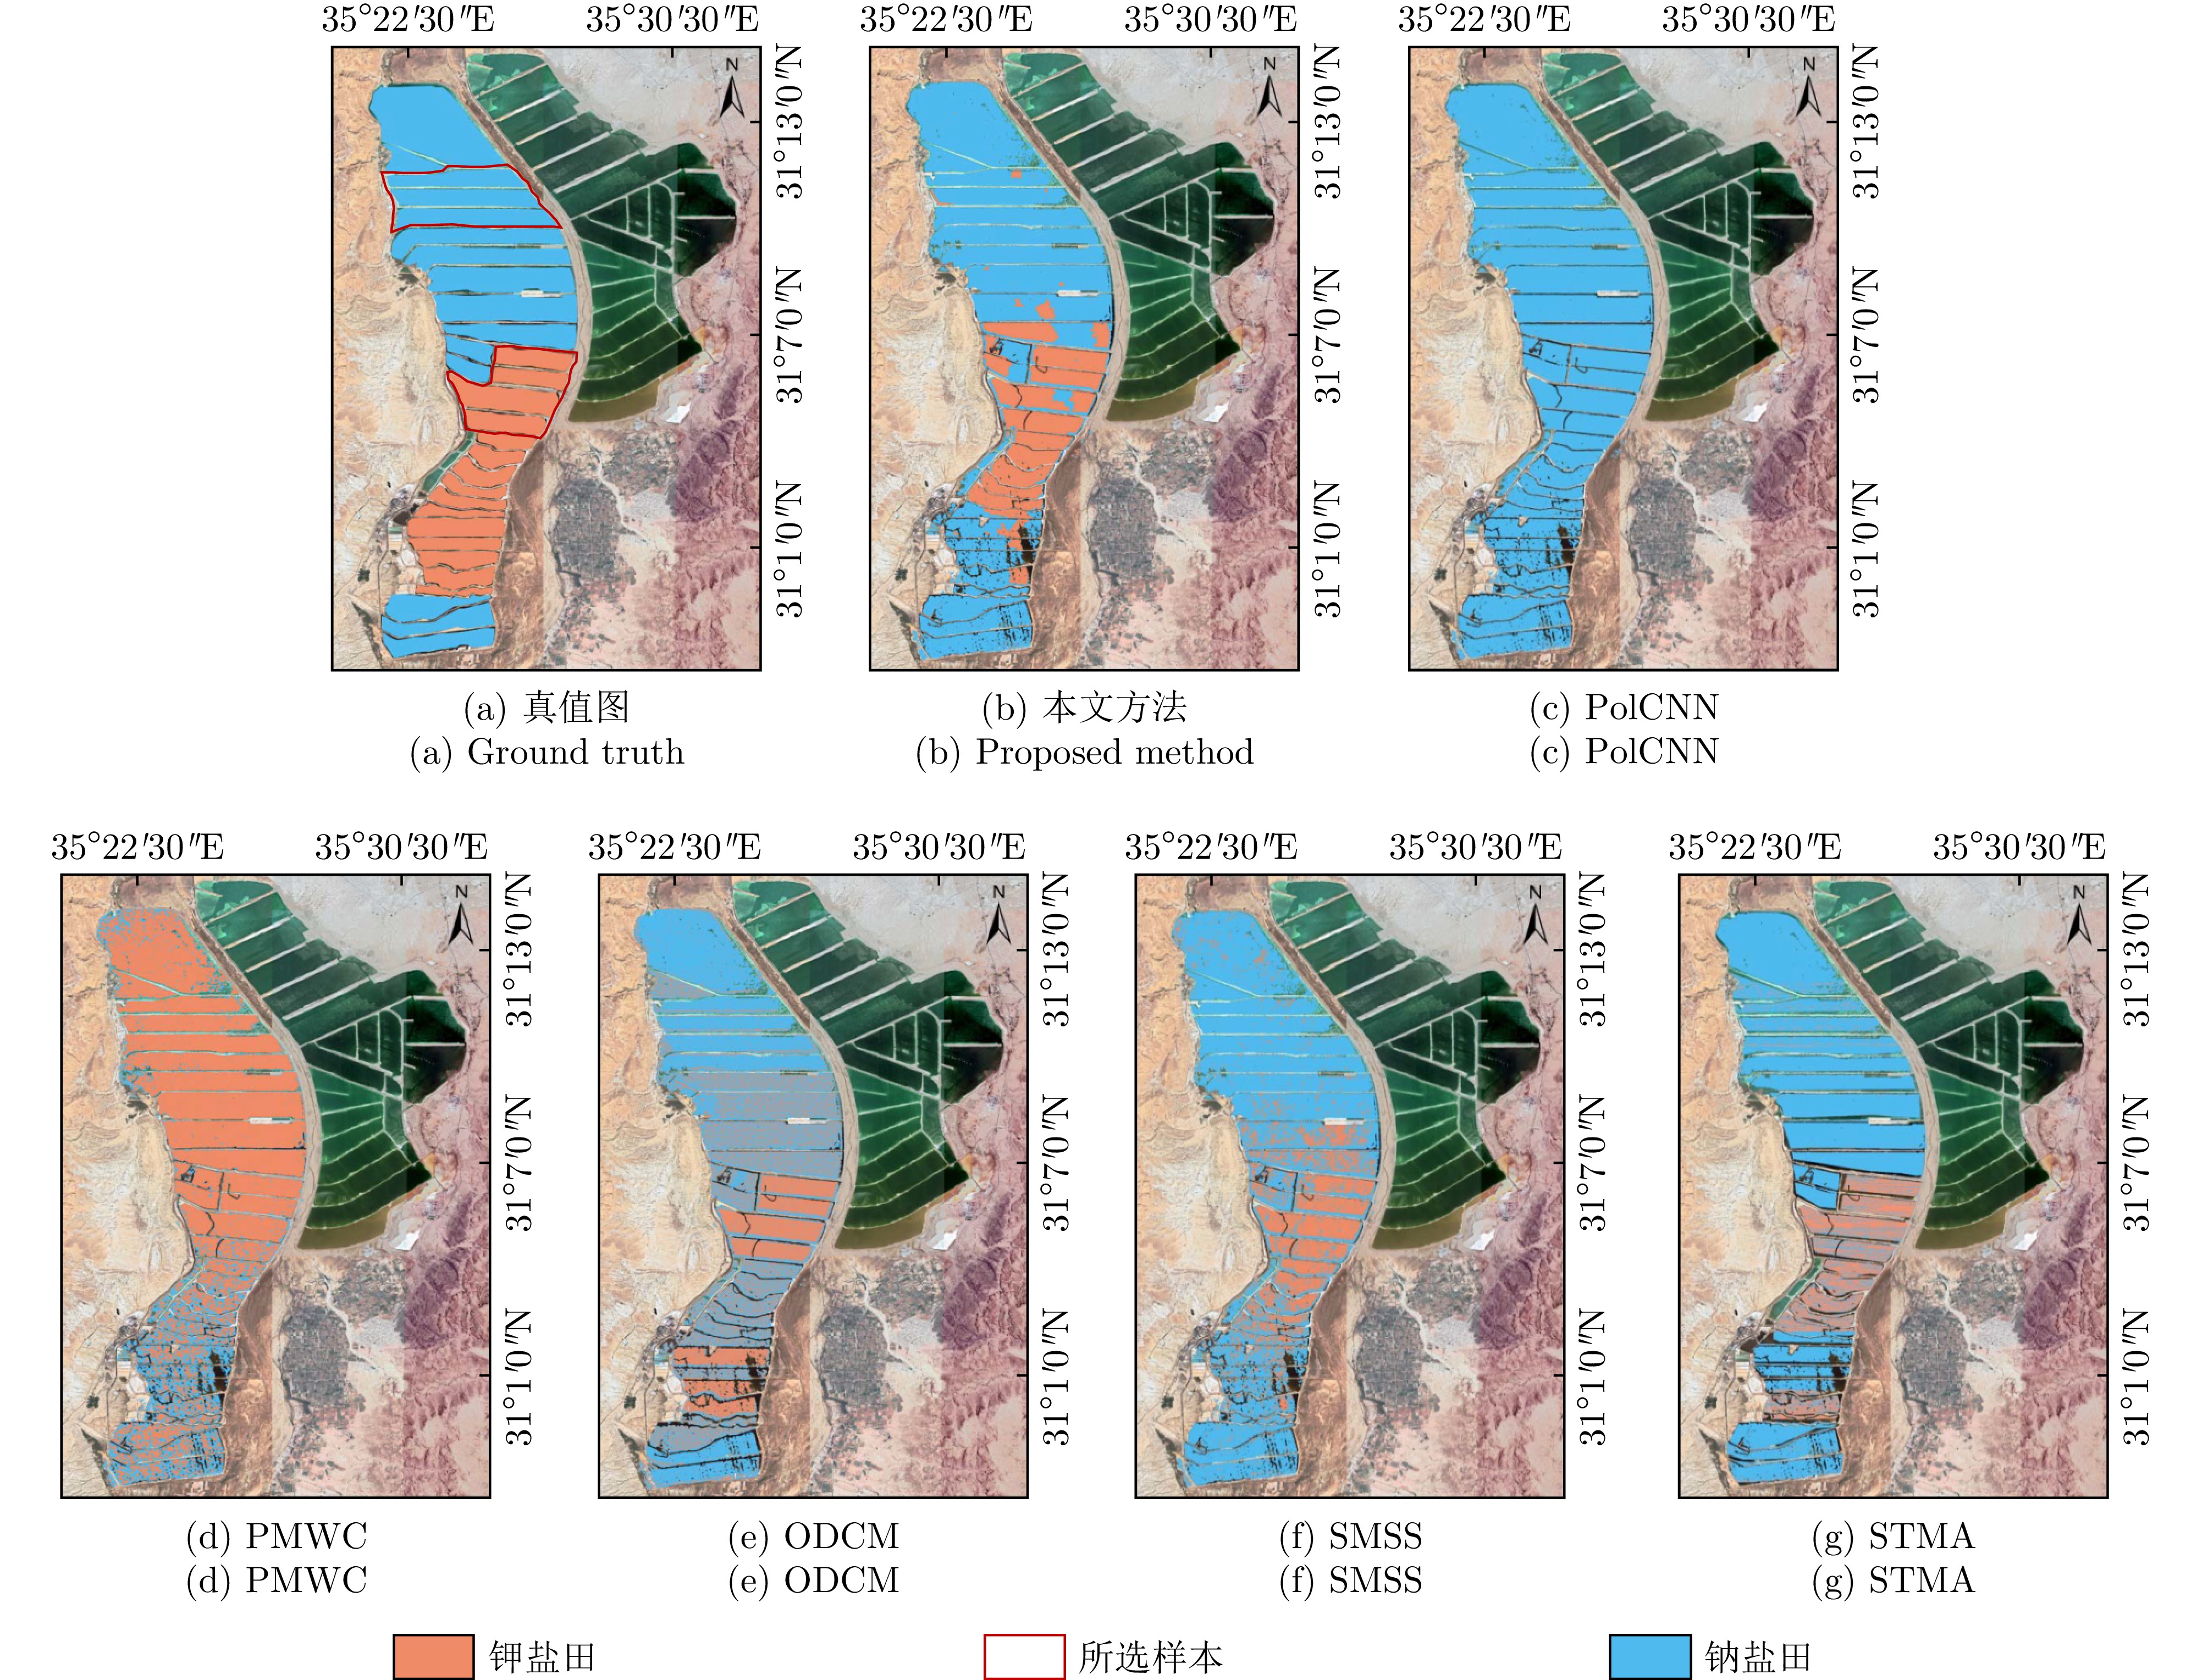
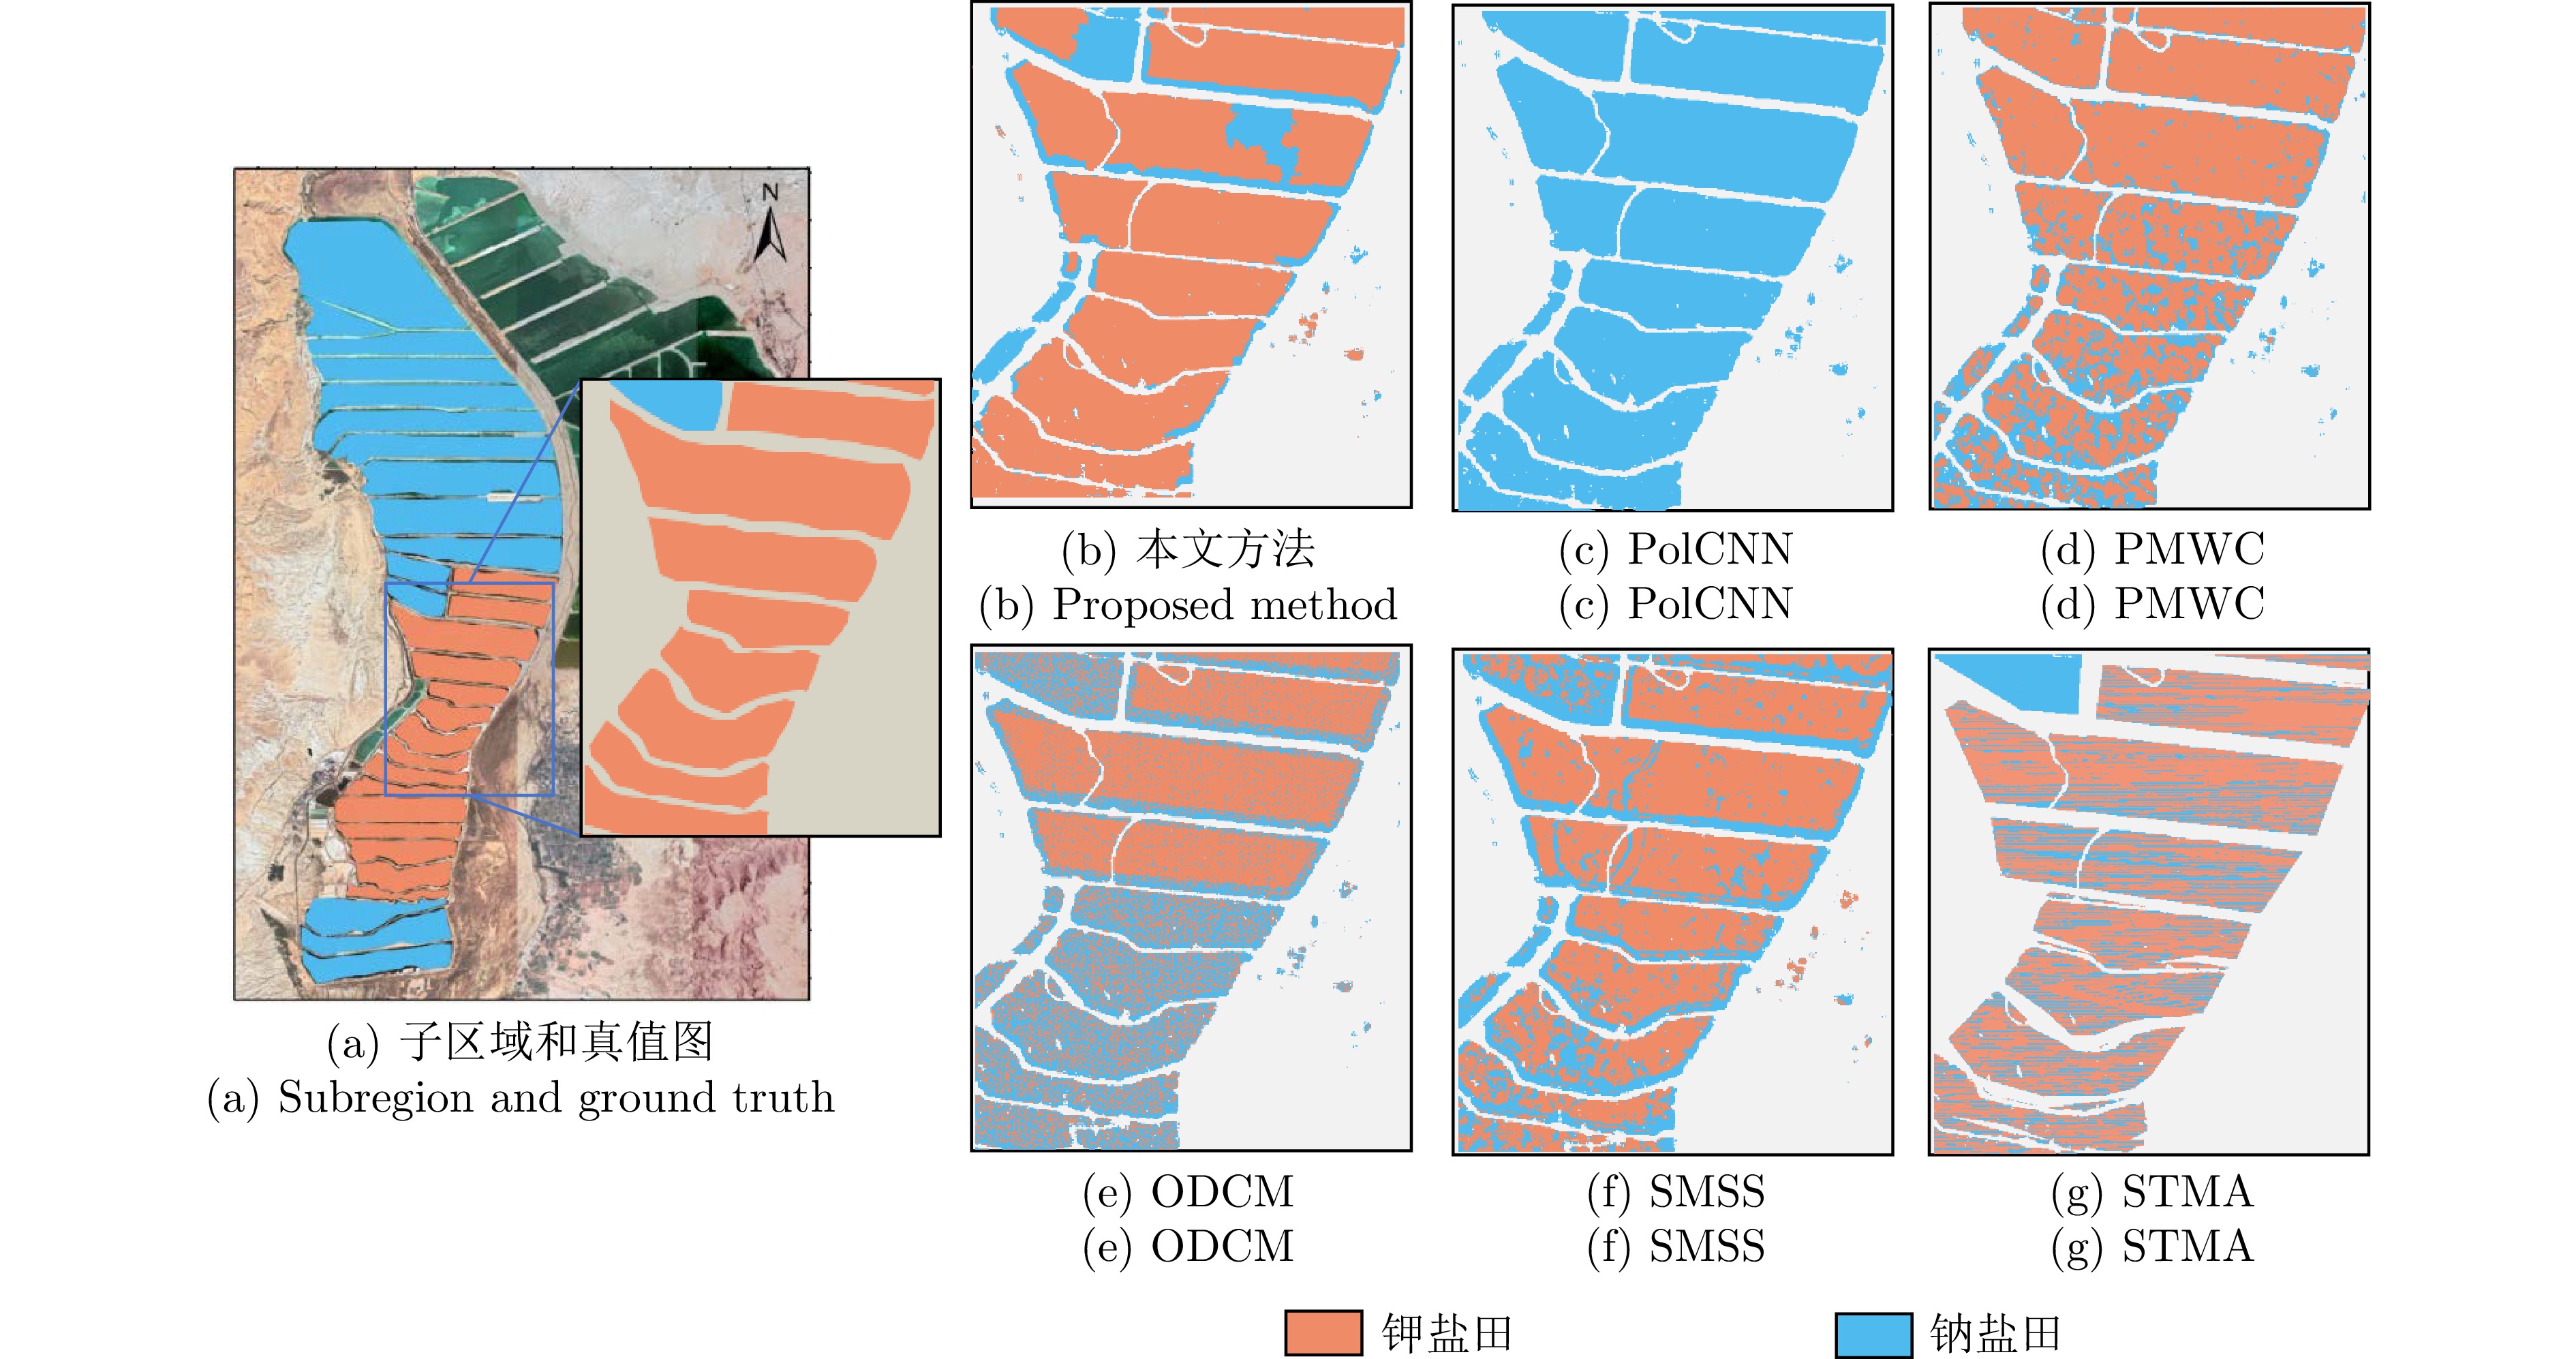
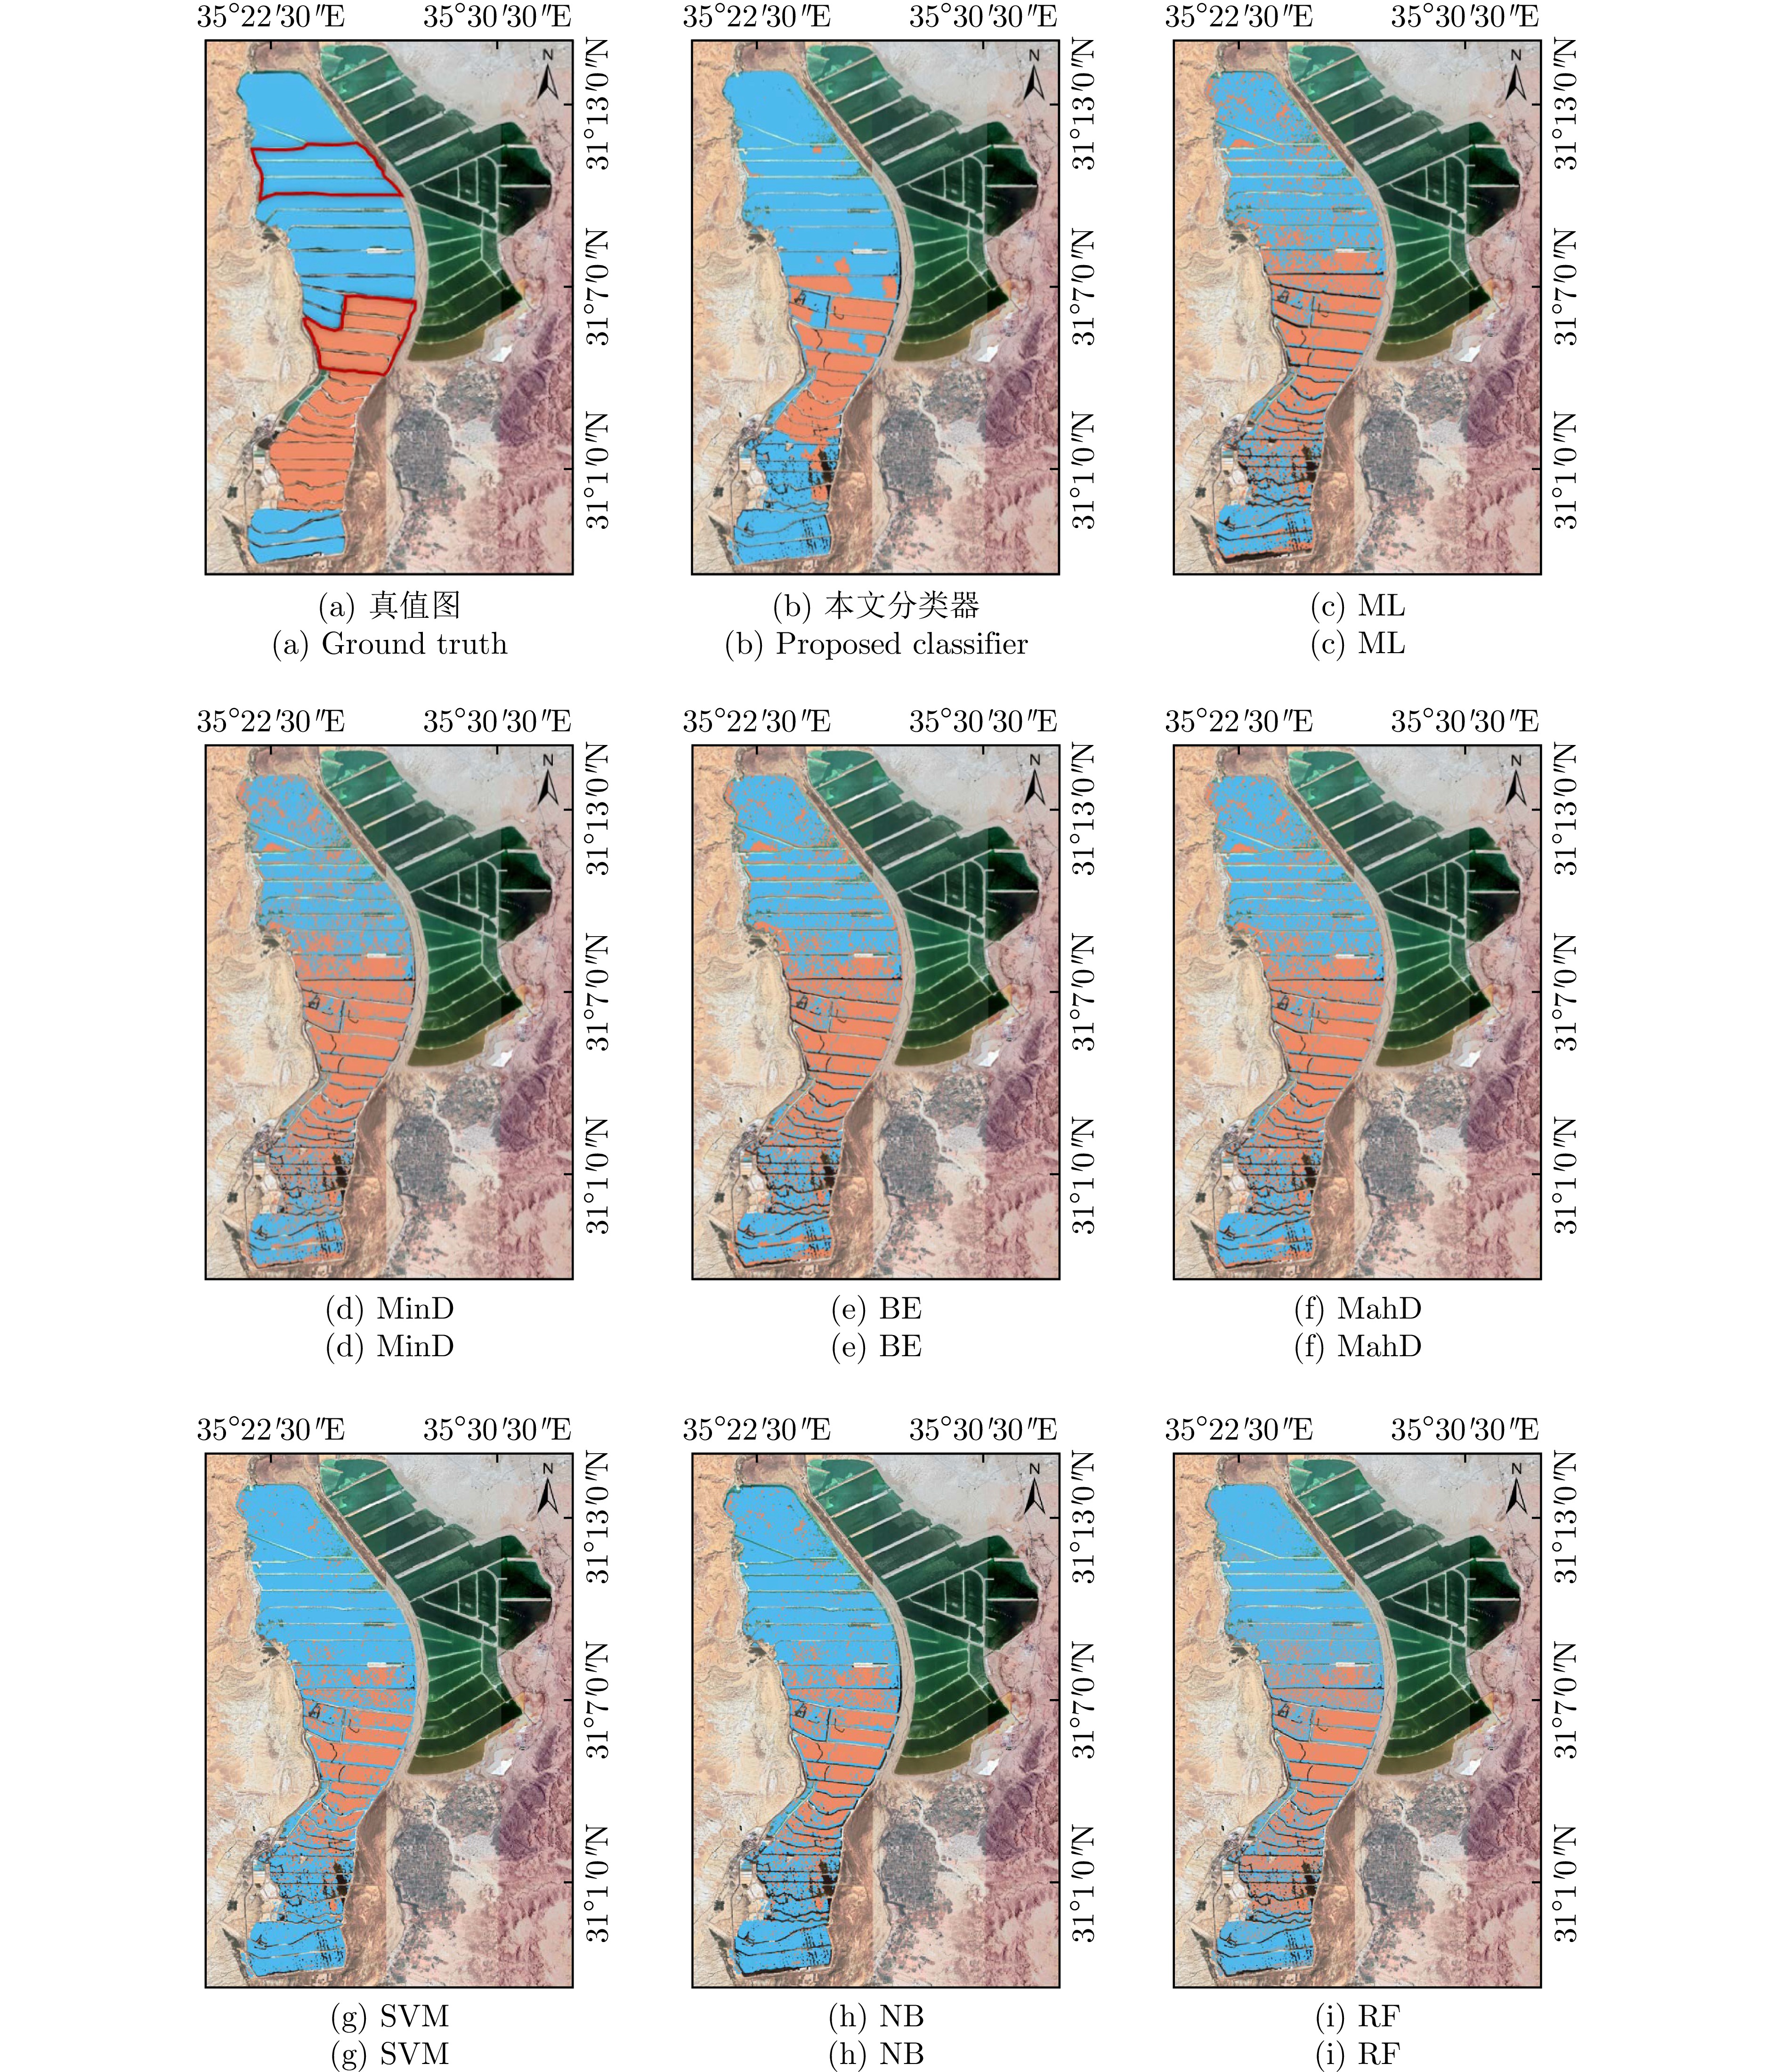
图 6 察尔汗盐湖数据集上的分类结果
Figure 6. Classification results of methods on the Qarhan Salt Lake dataset
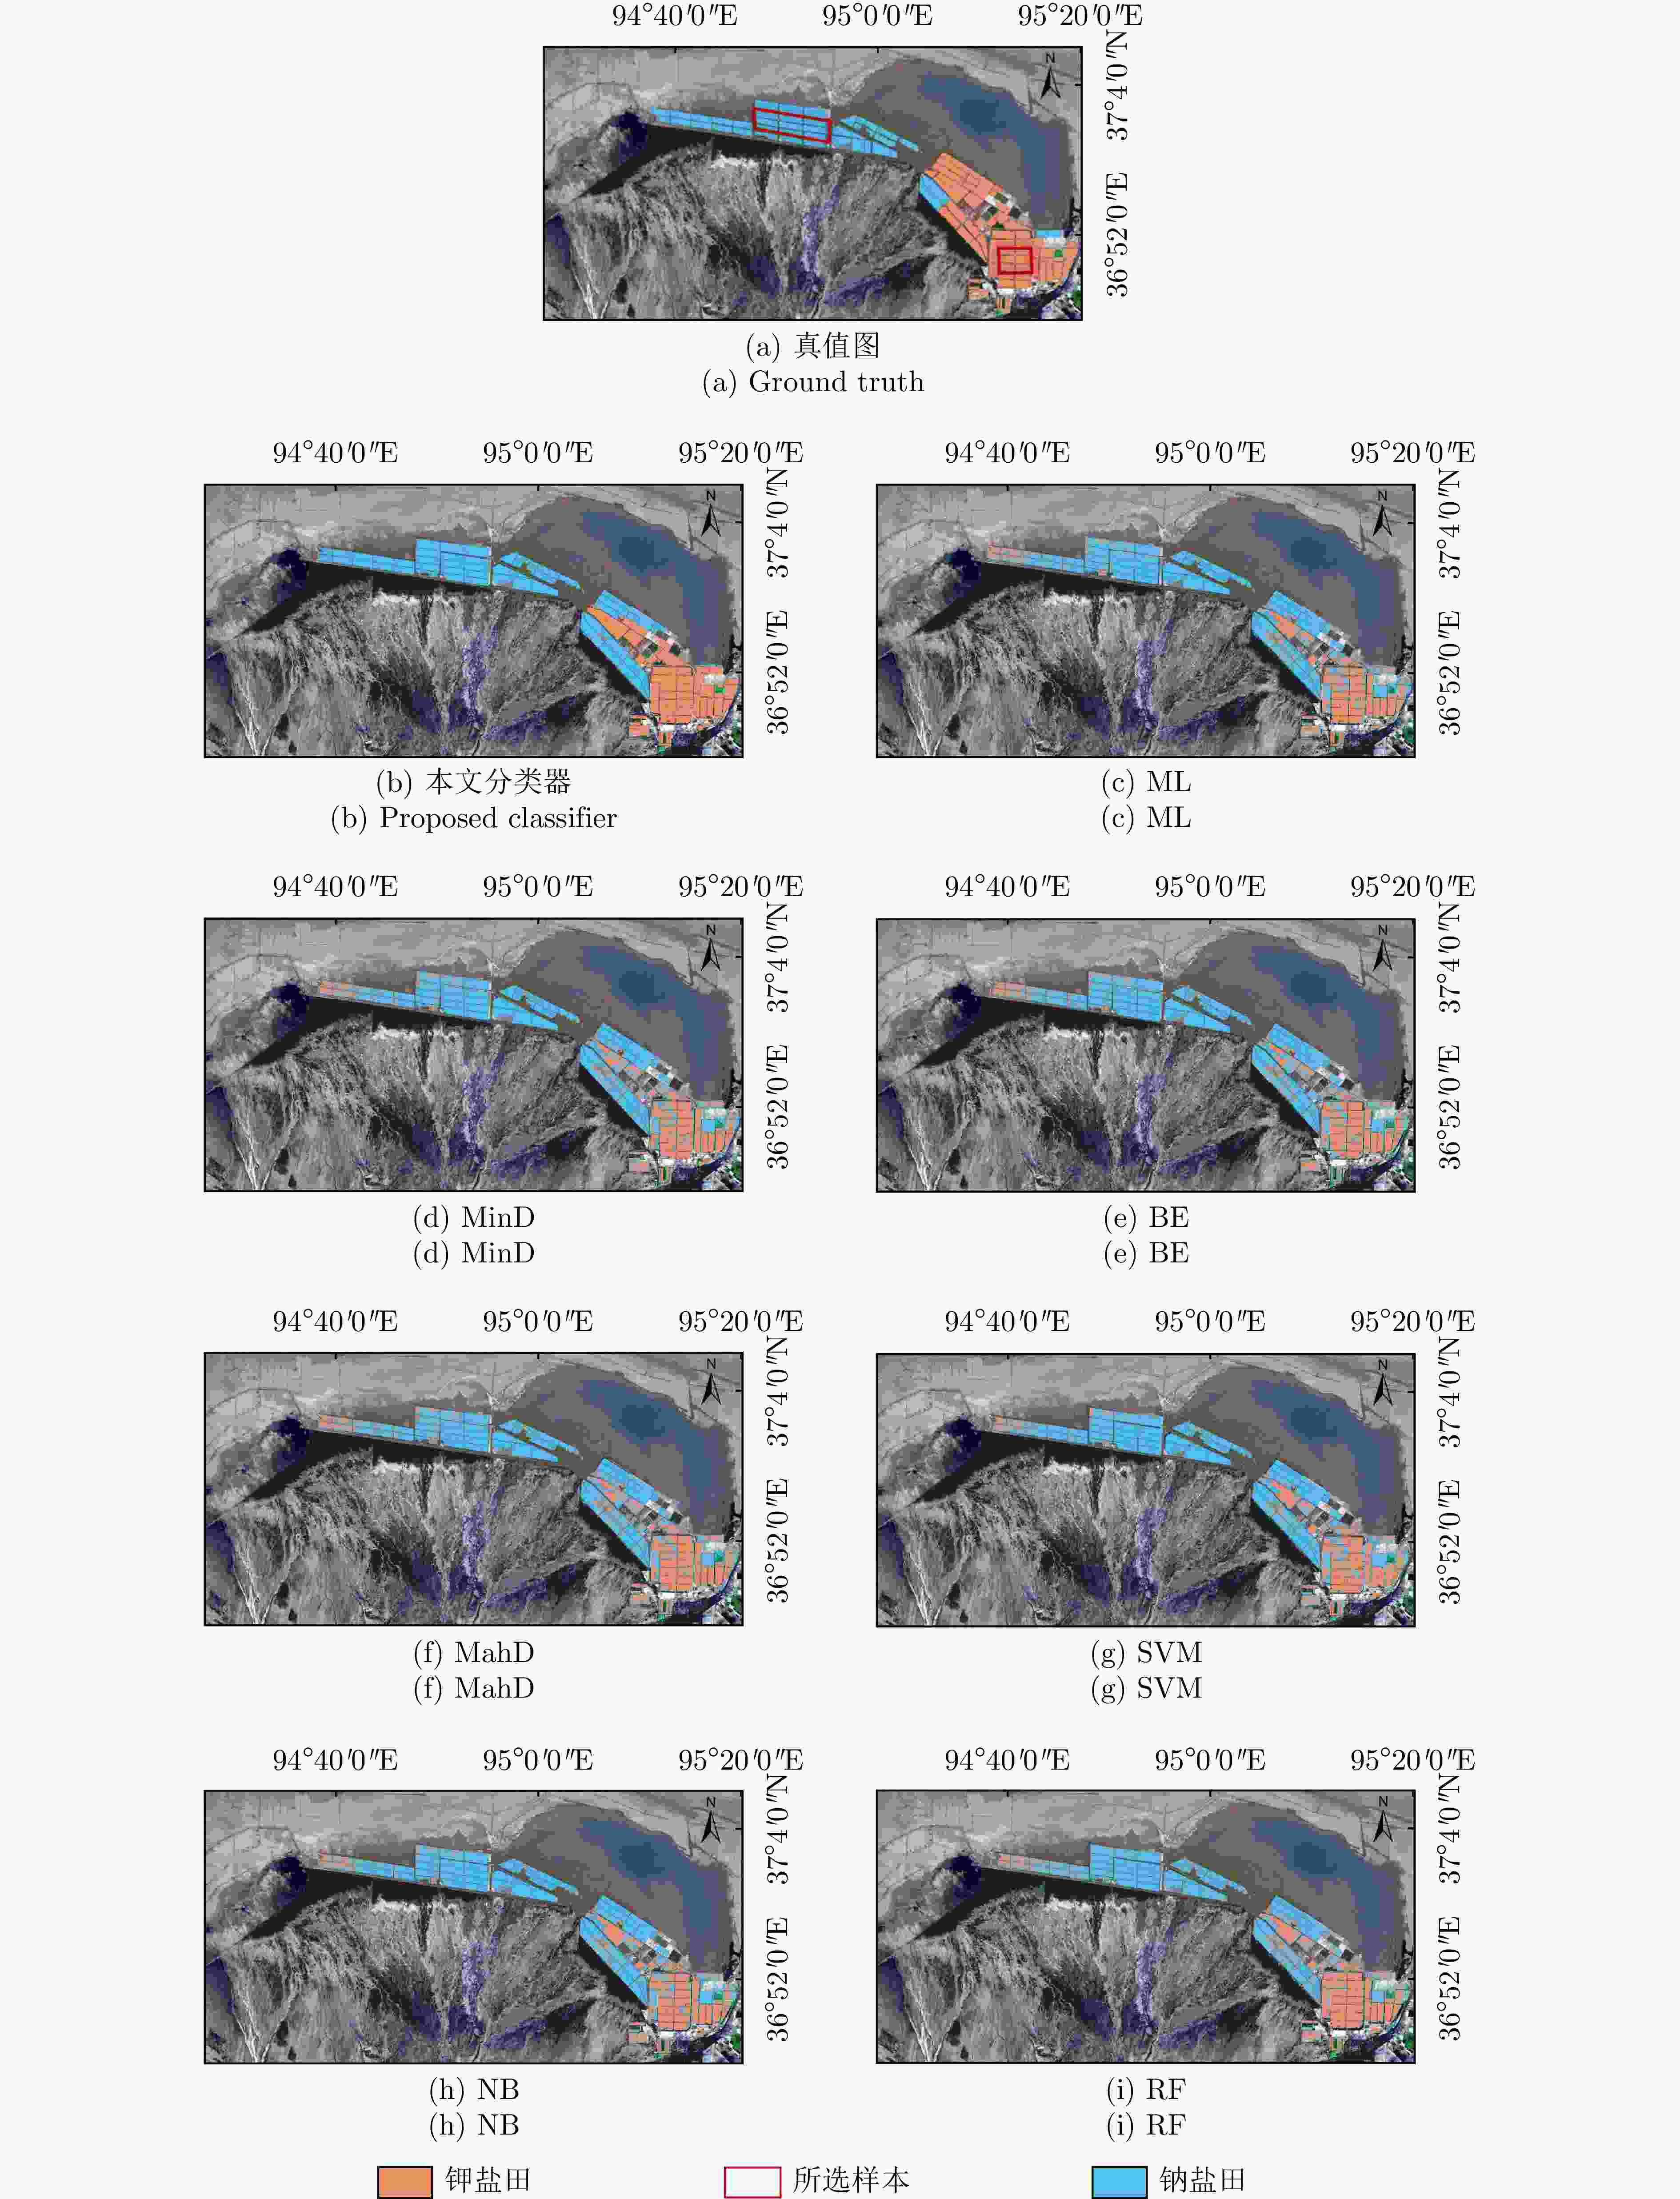
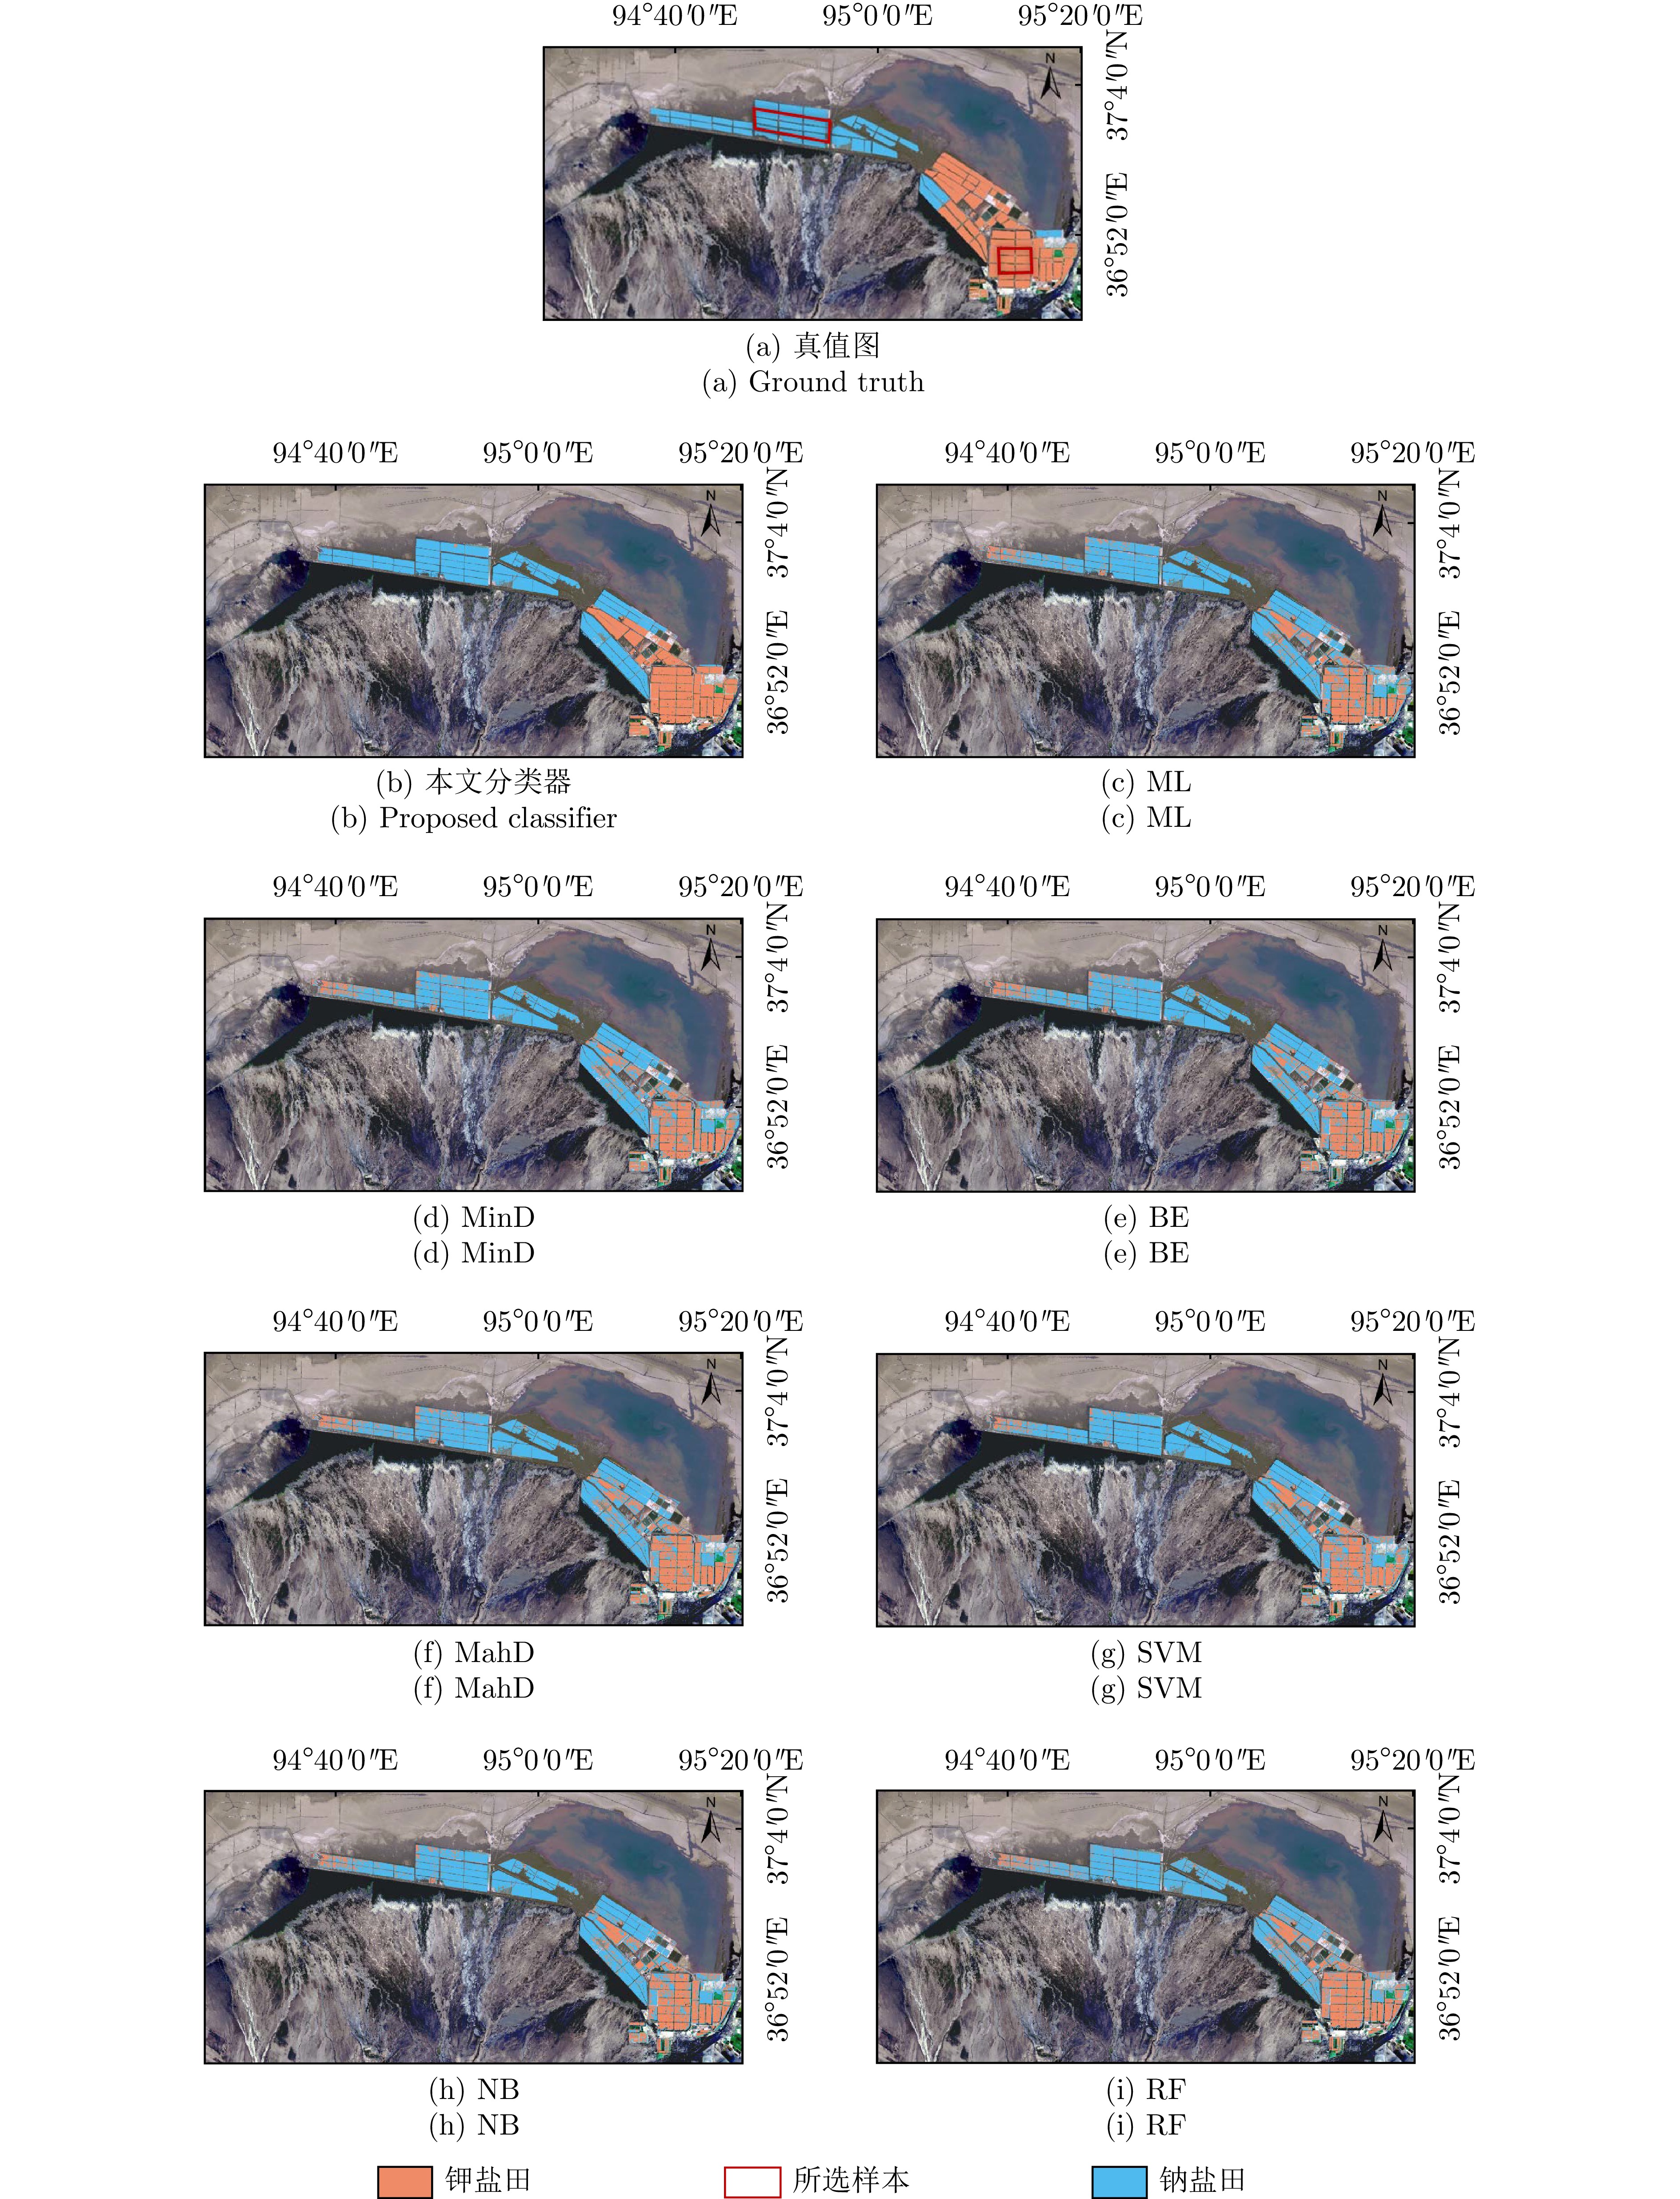
图 9 不同分类器在察尔汗盐湖数据集上的分类结果比较
Figure 9. Comparison of classification results from different classifiers on the Qarhan Salt Lake dataset
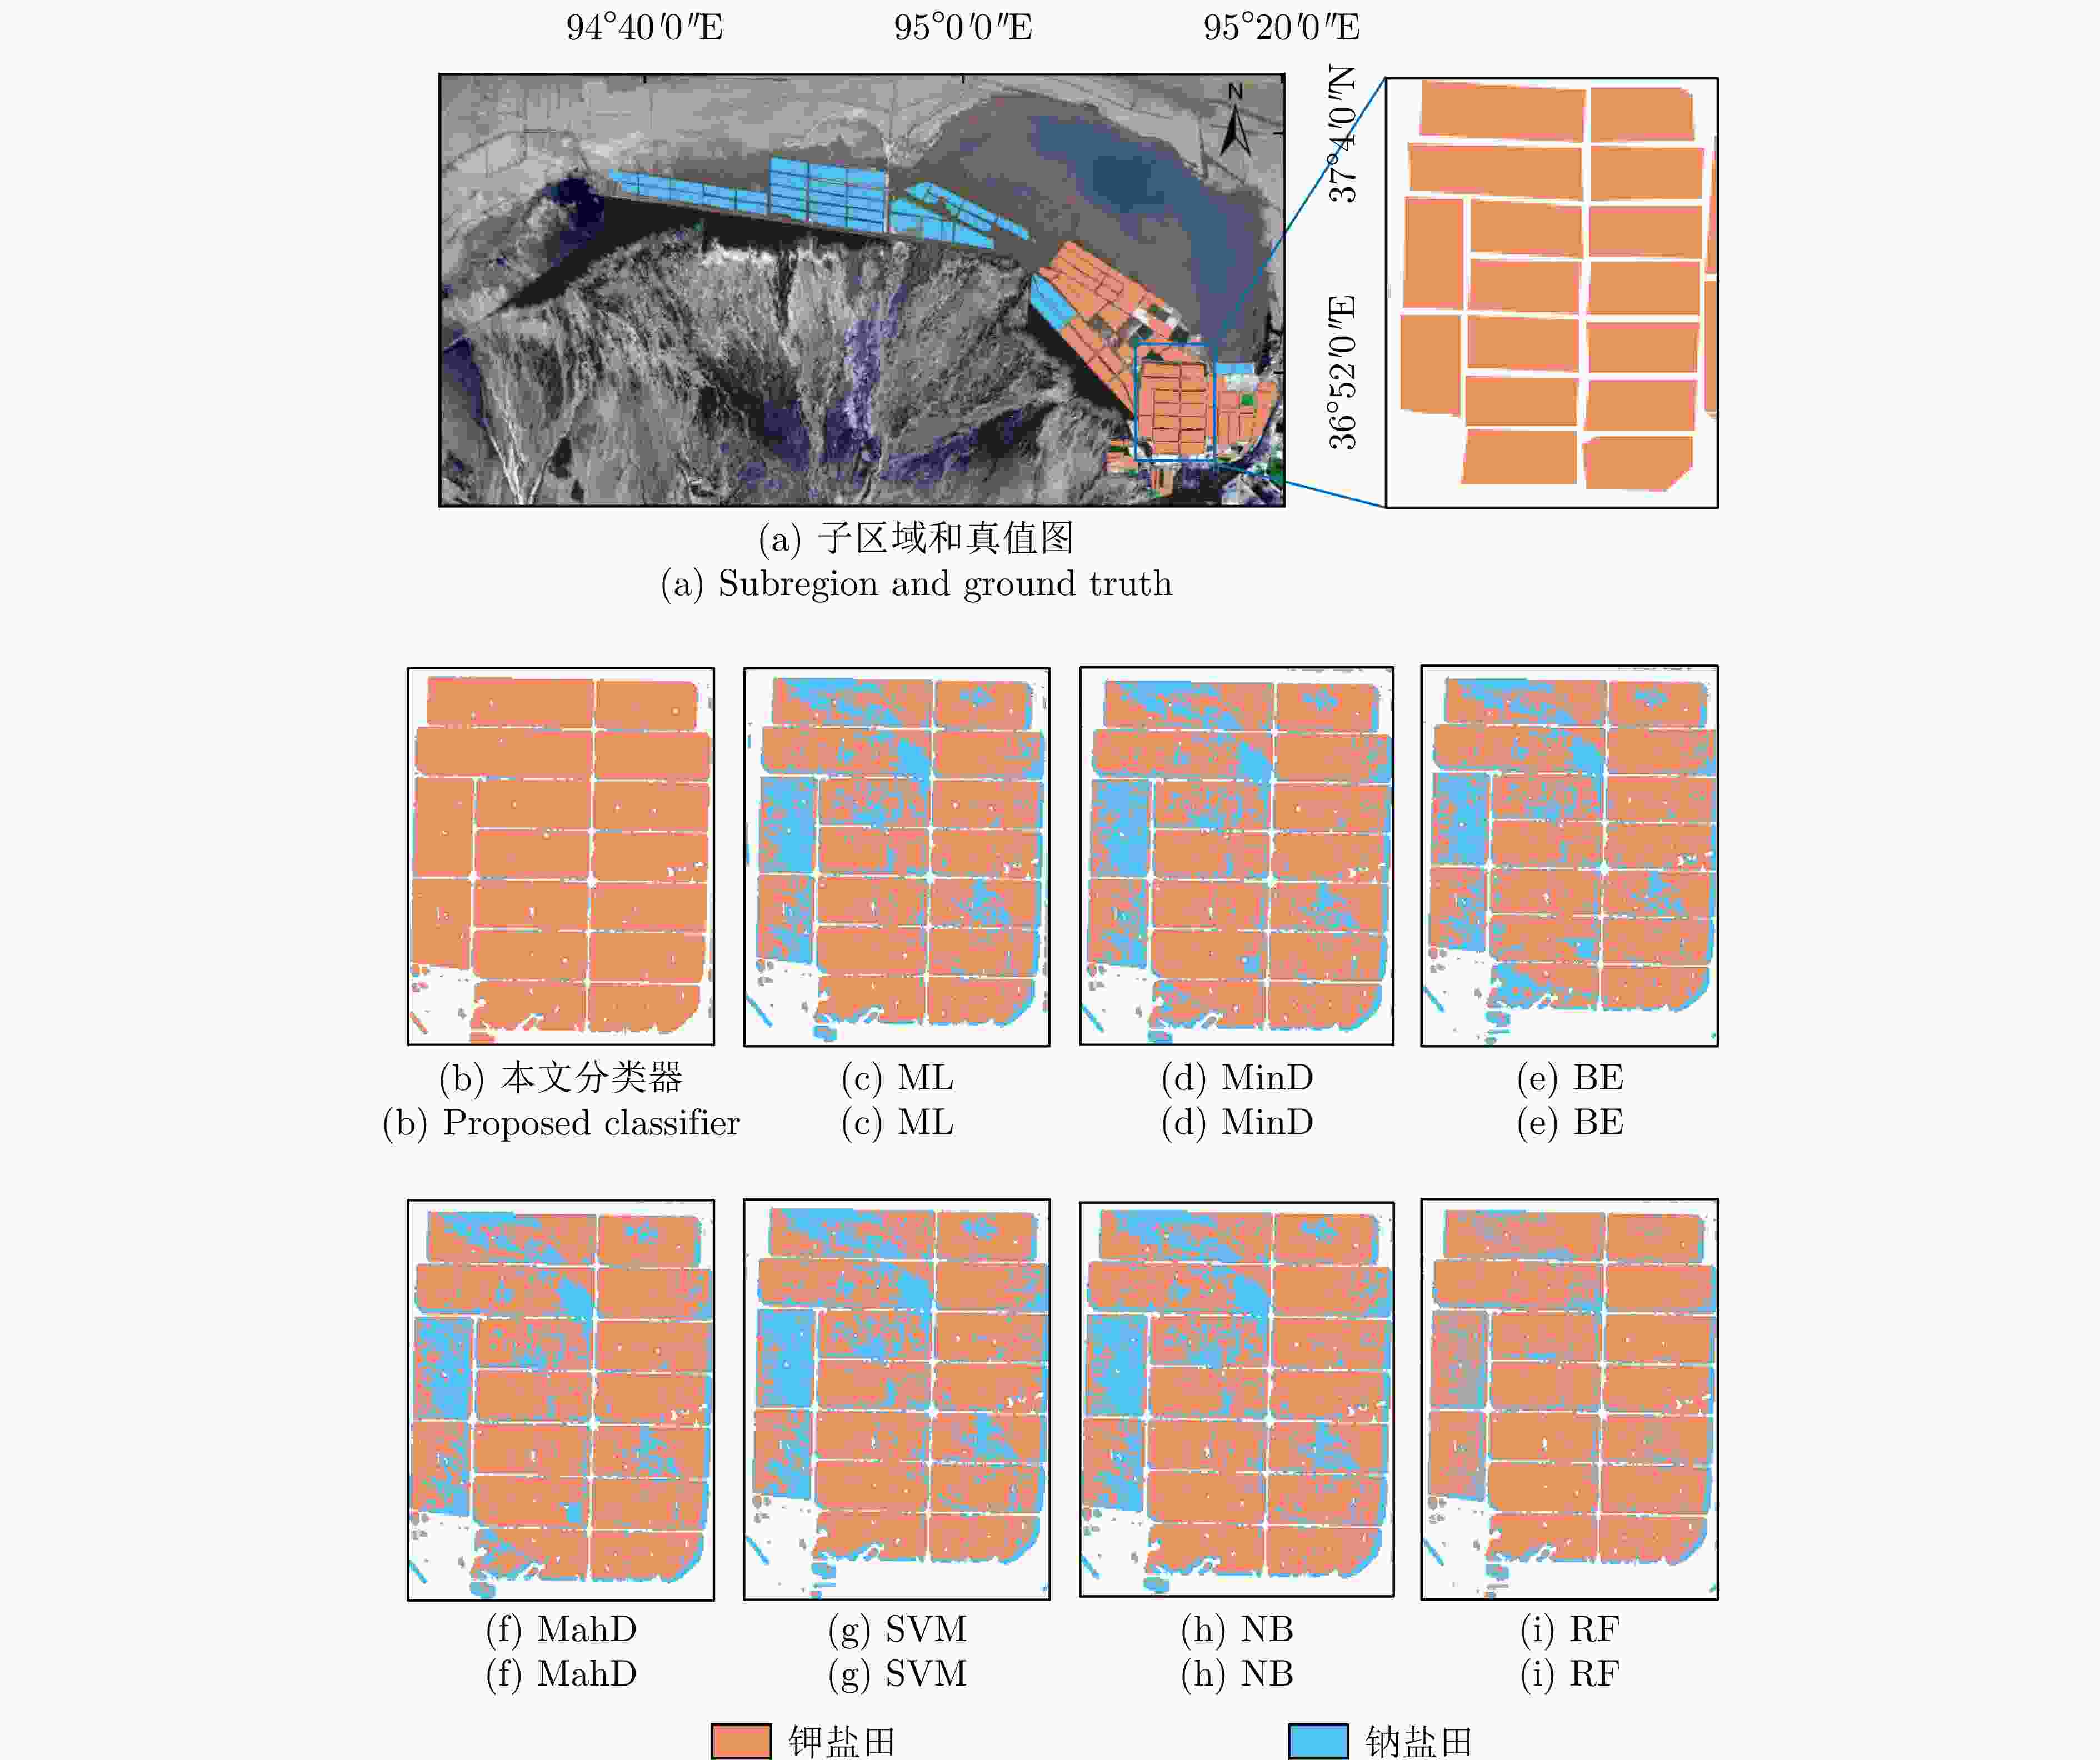
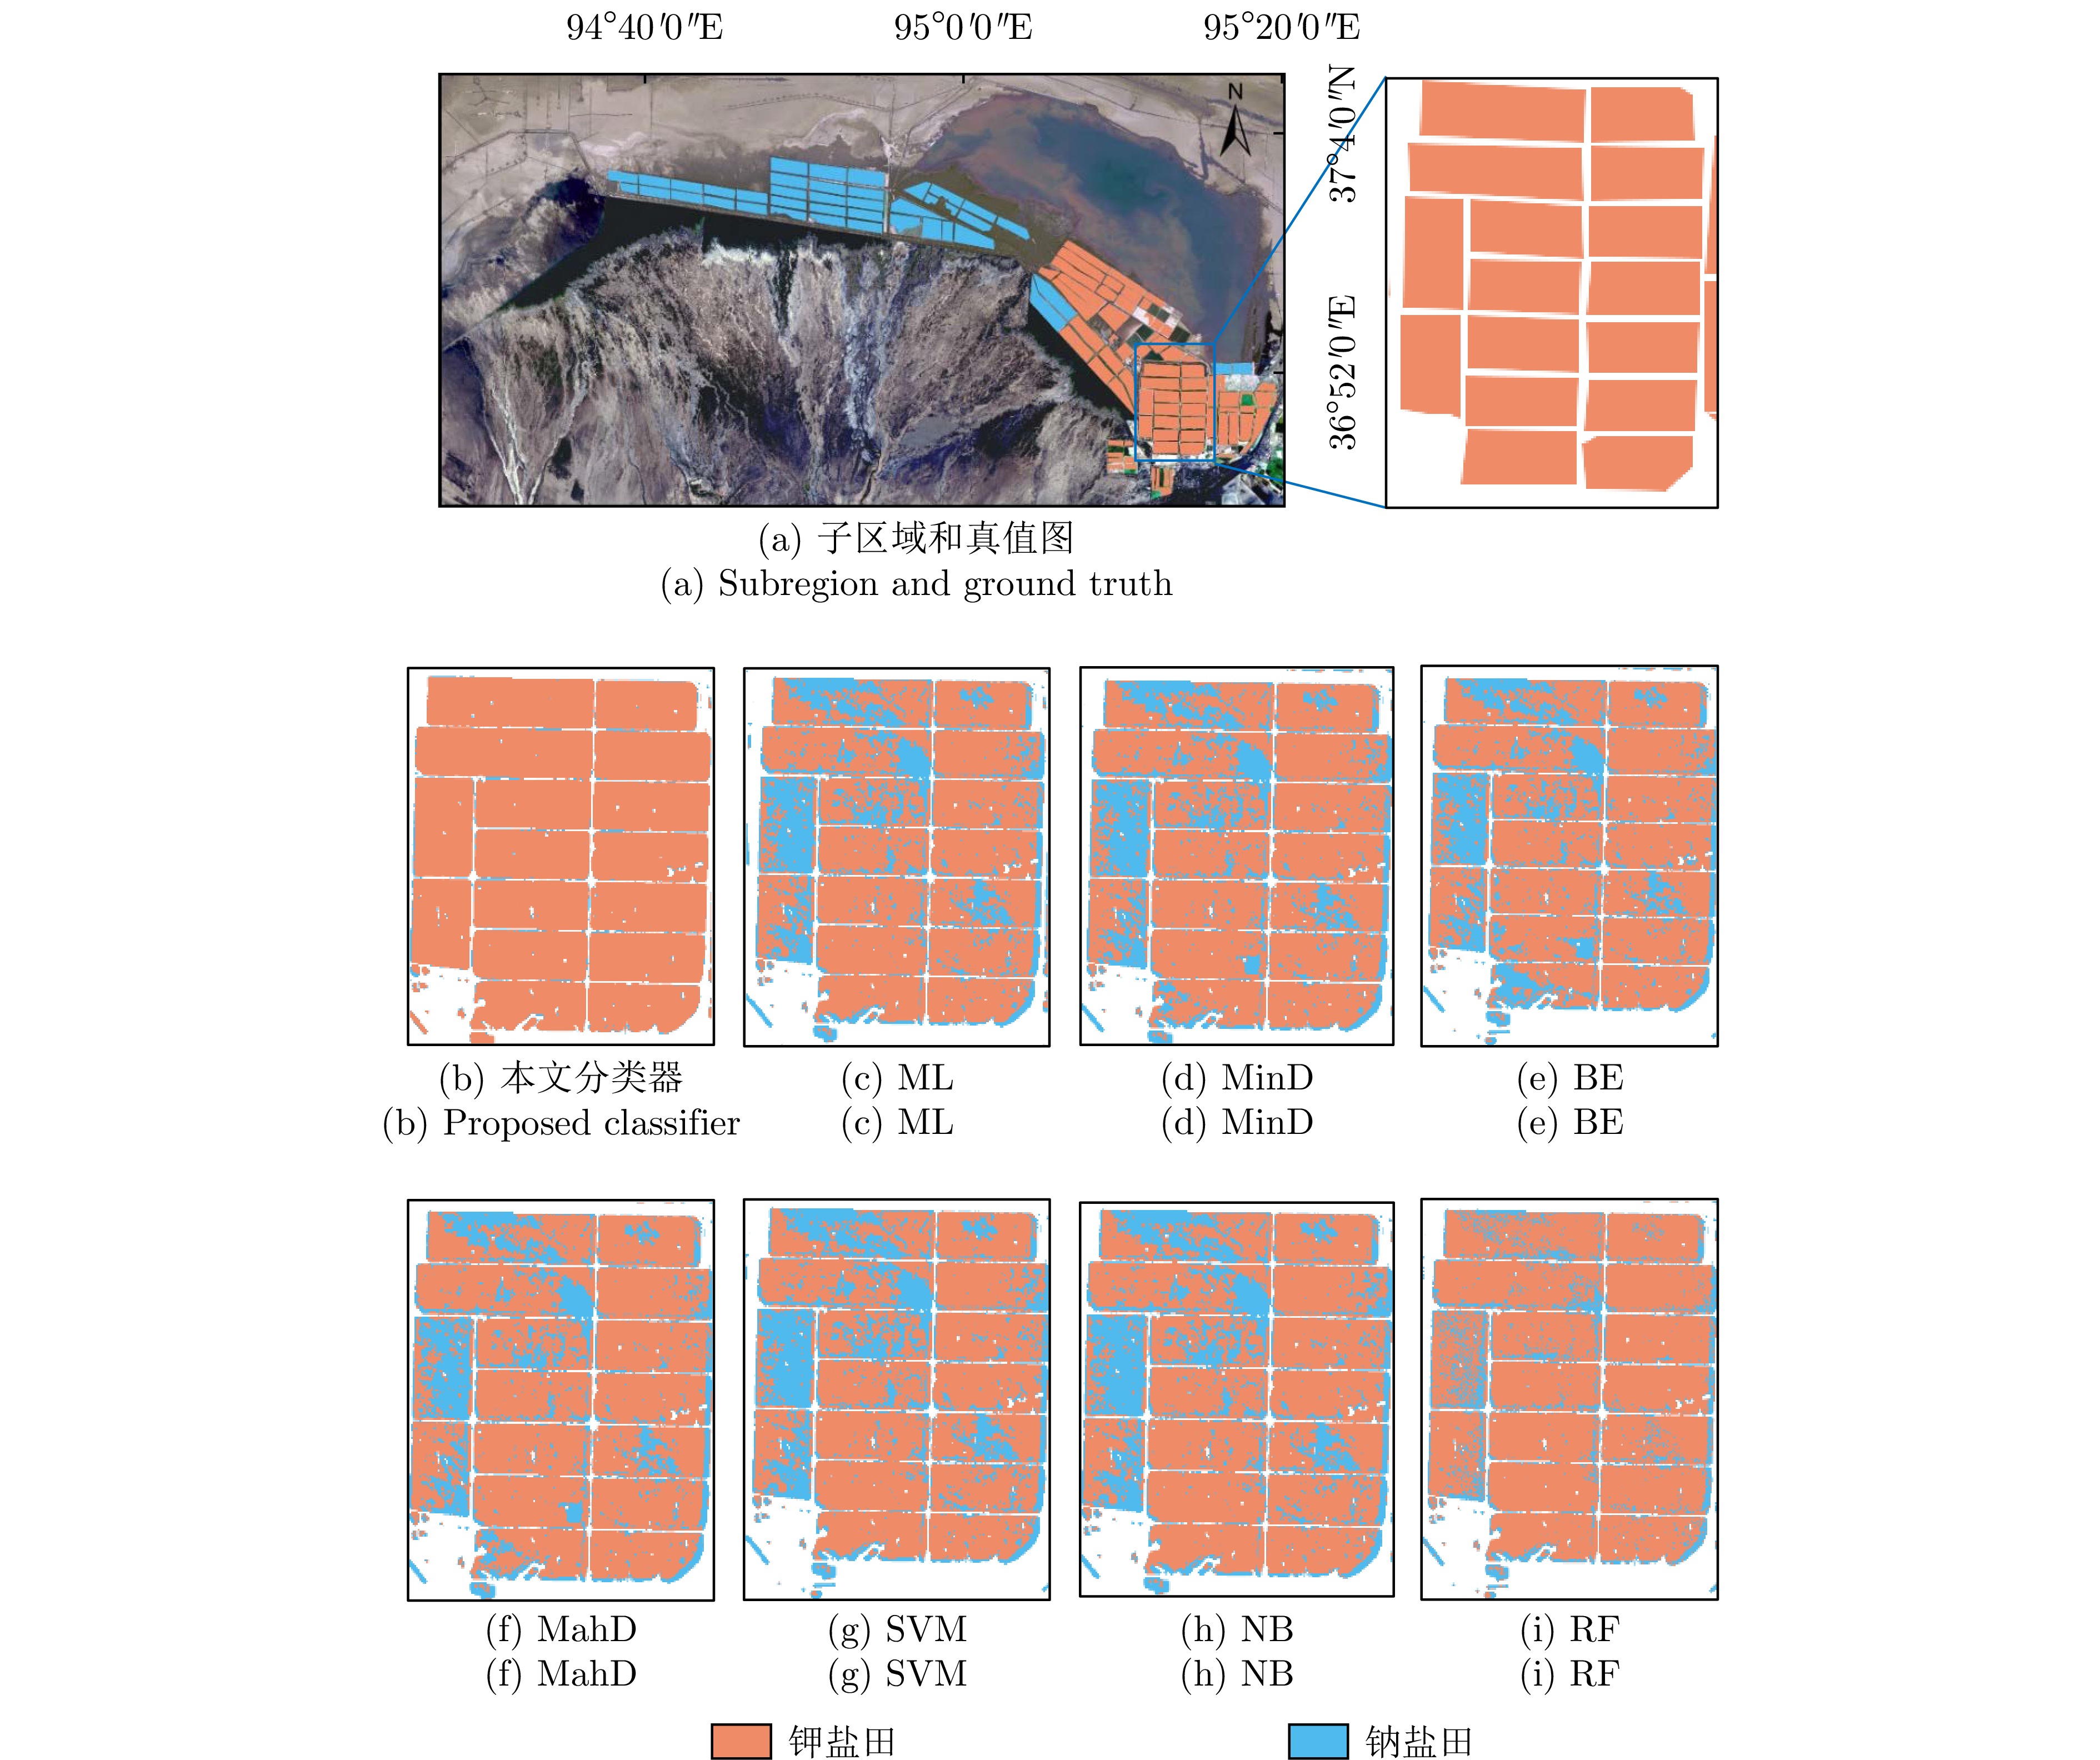
图 10 多种分类器在察尔汗盐湖子区域中的分类结果
Figure 10. Classification results of various methods for an enlarged subregion of the Qarhan Salt Lake dataset
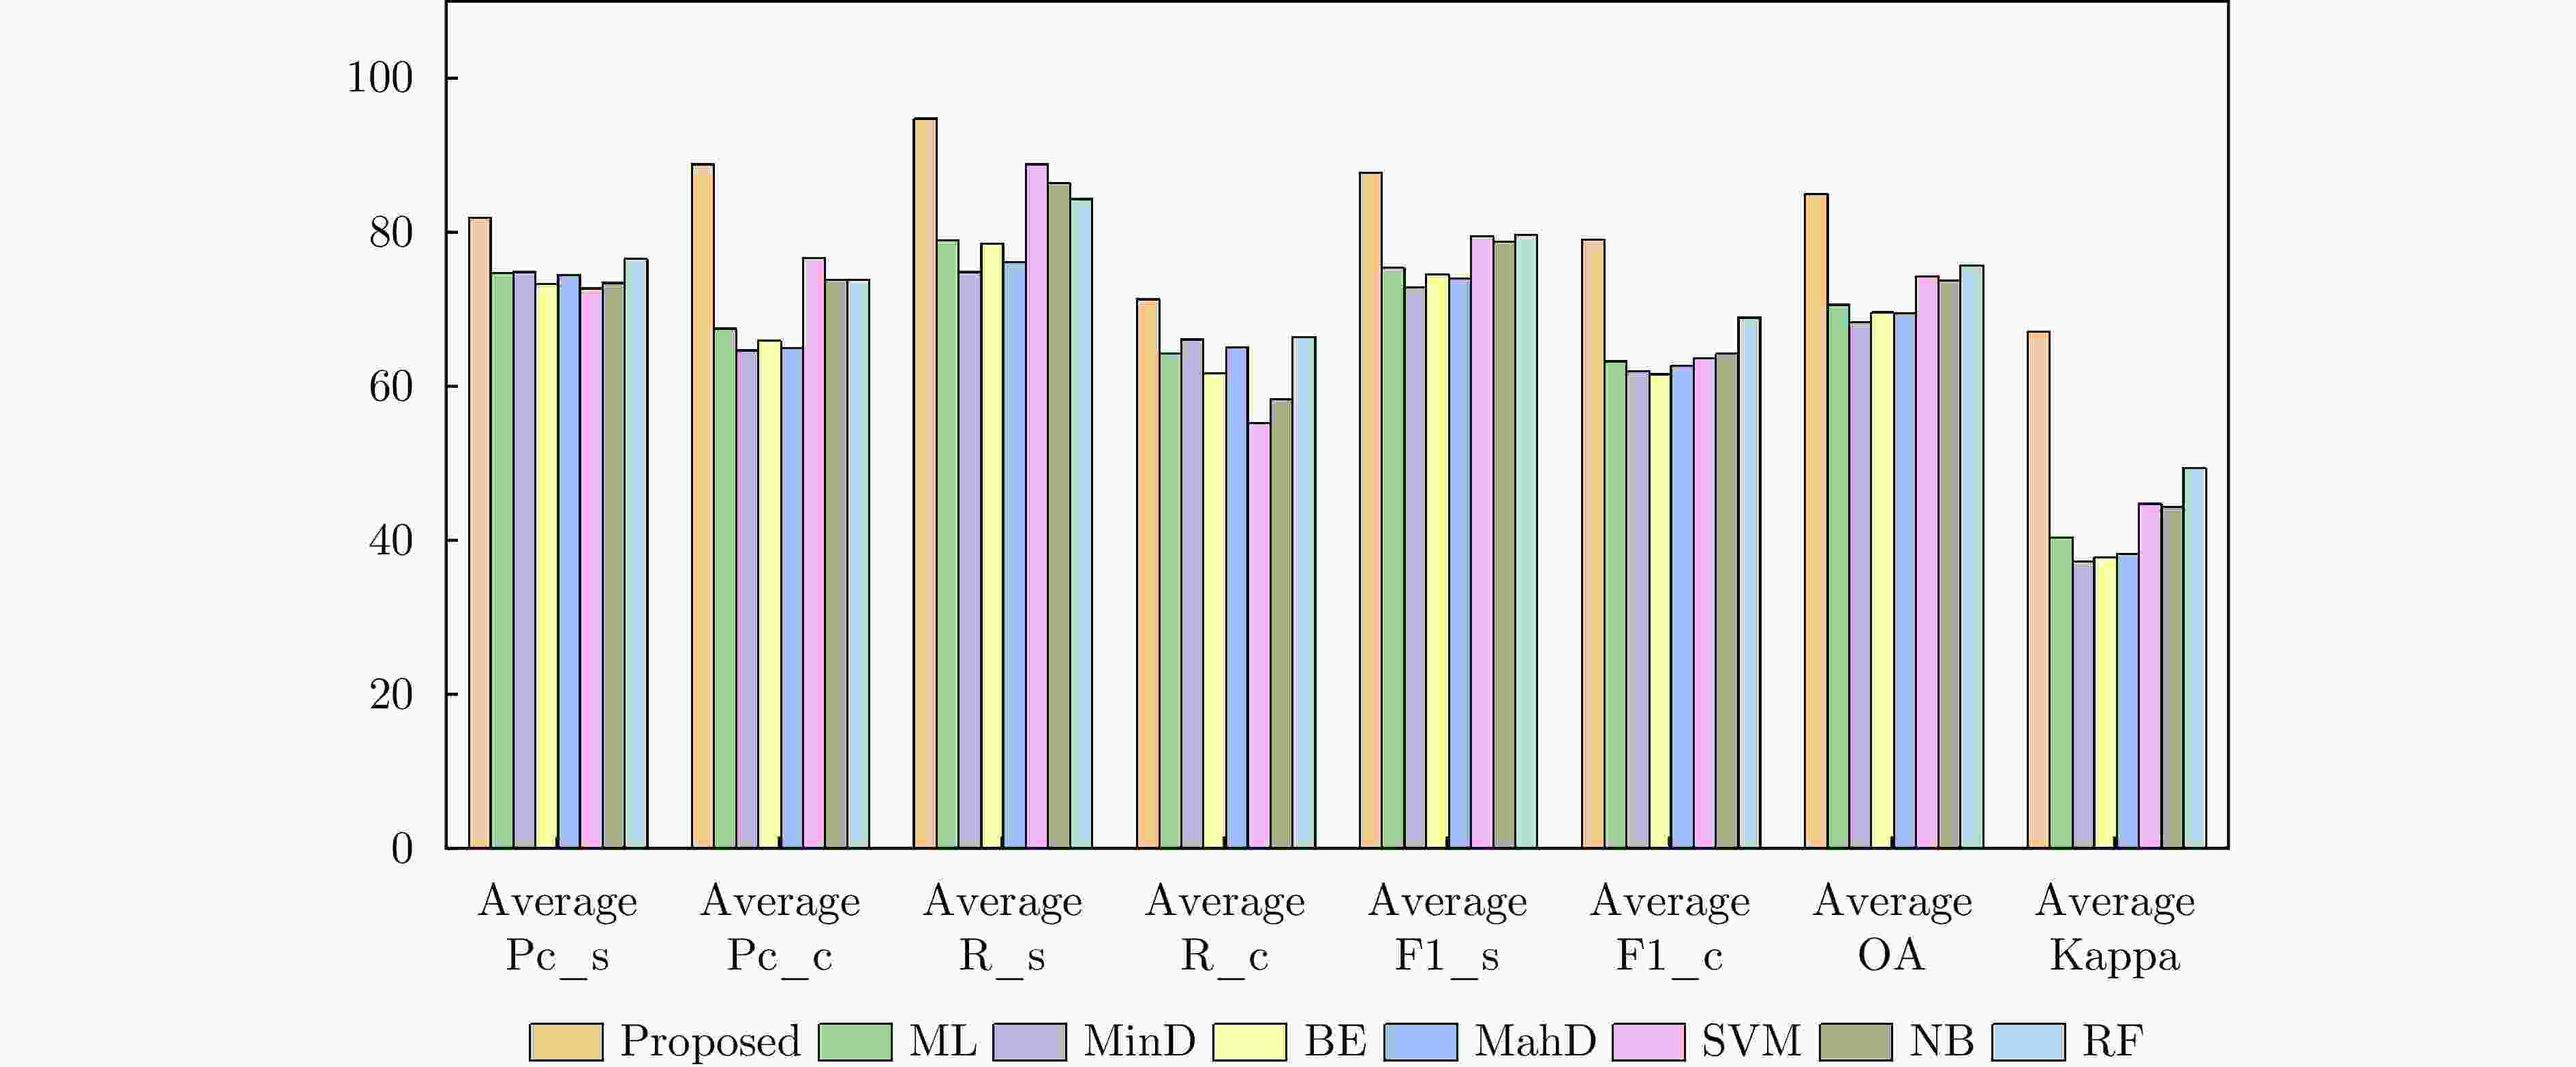
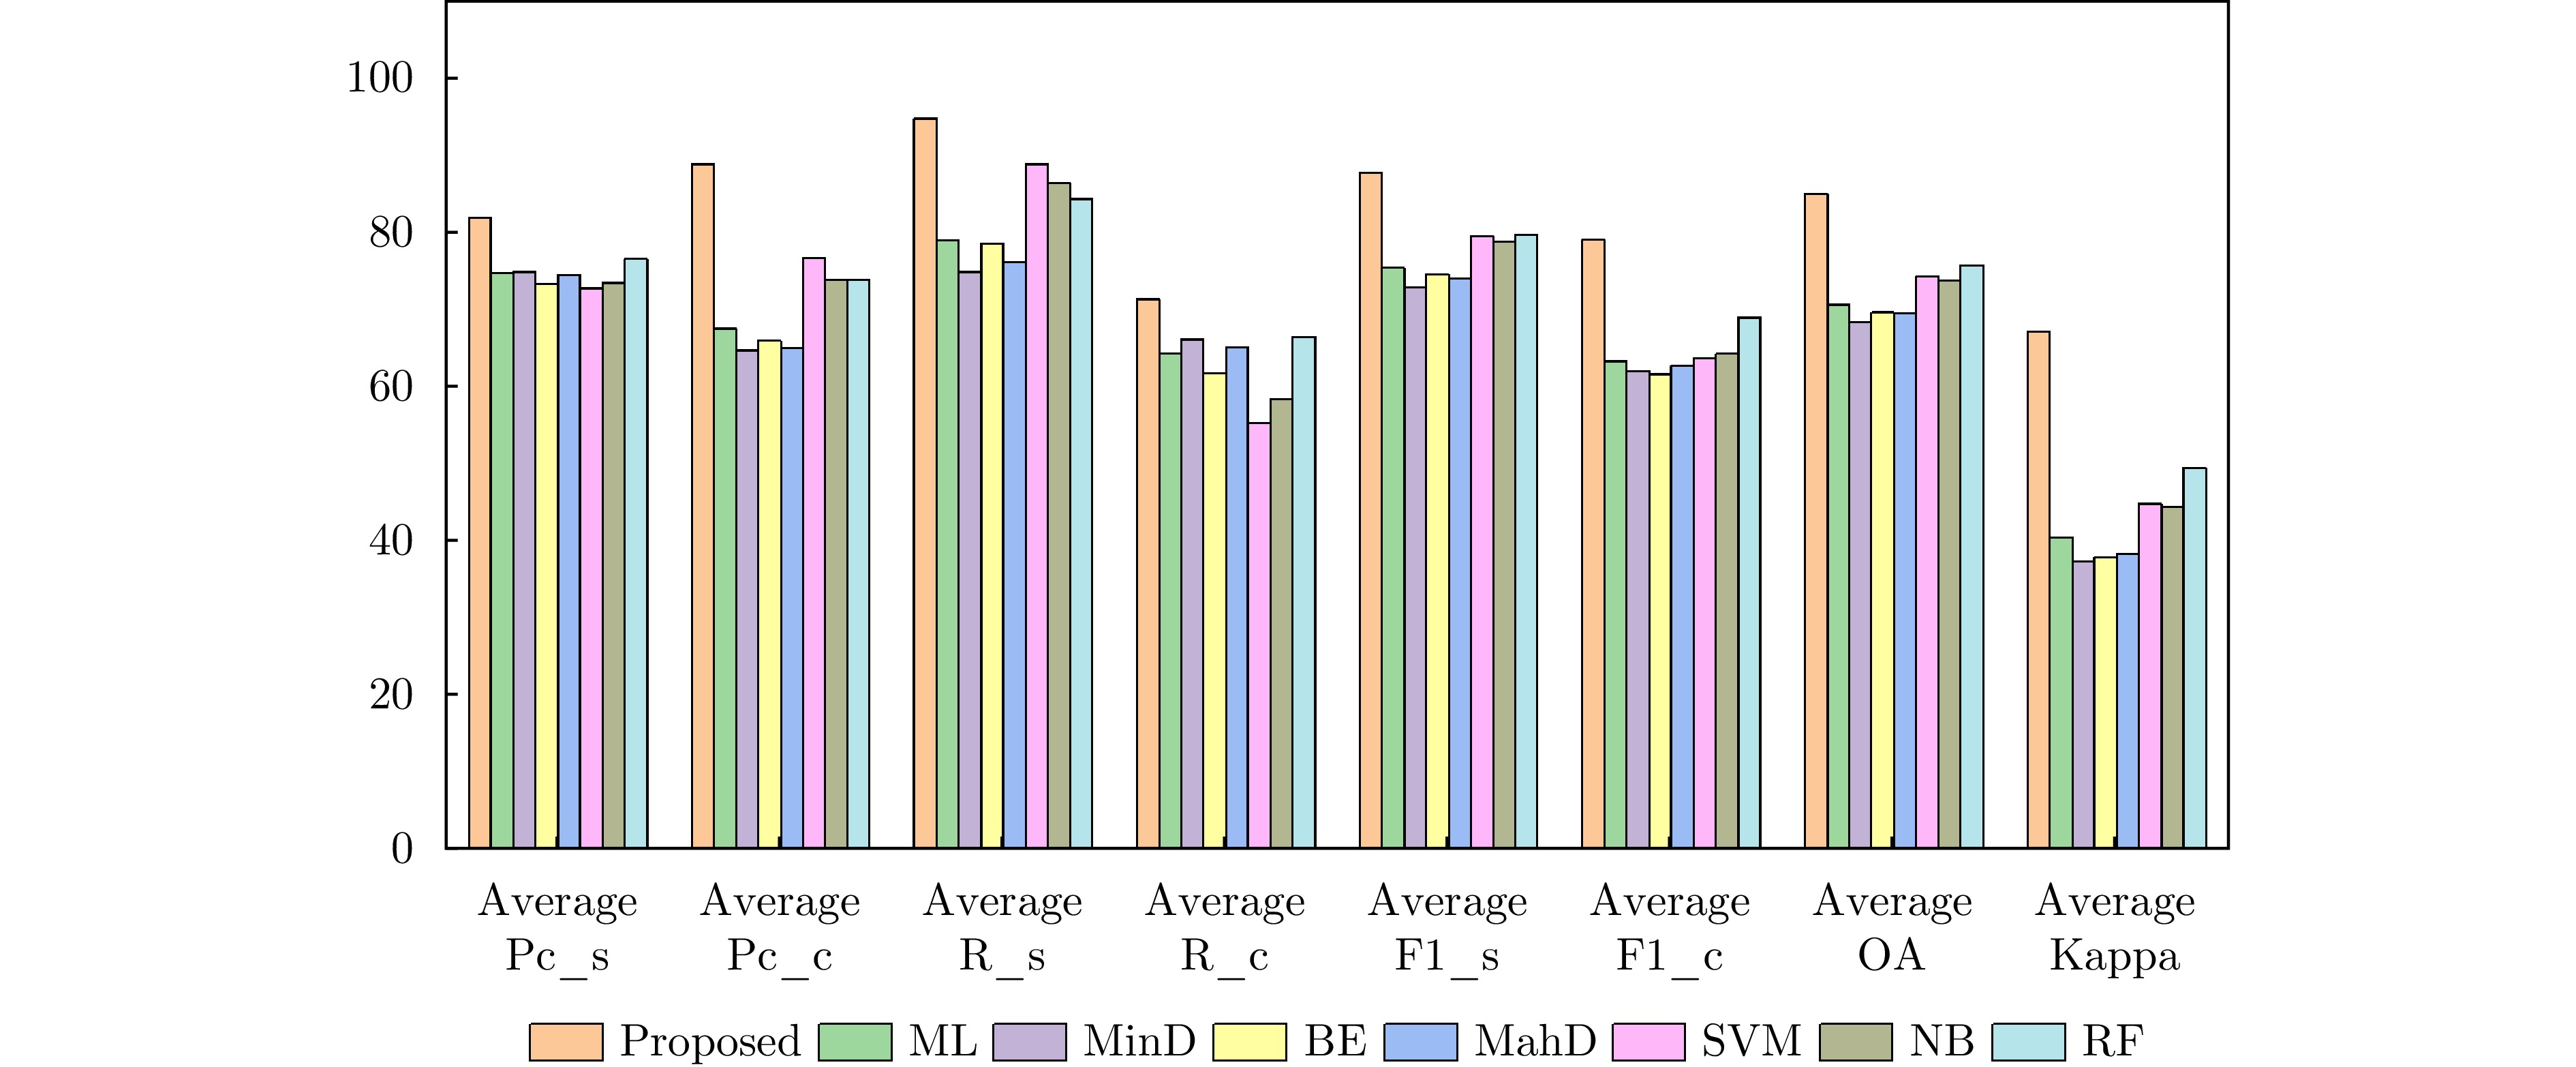
图 12 不同分类器在全部数据集上评价指标的均值
Figure 12. The mean of five indicators obtained by different methods for all datasets
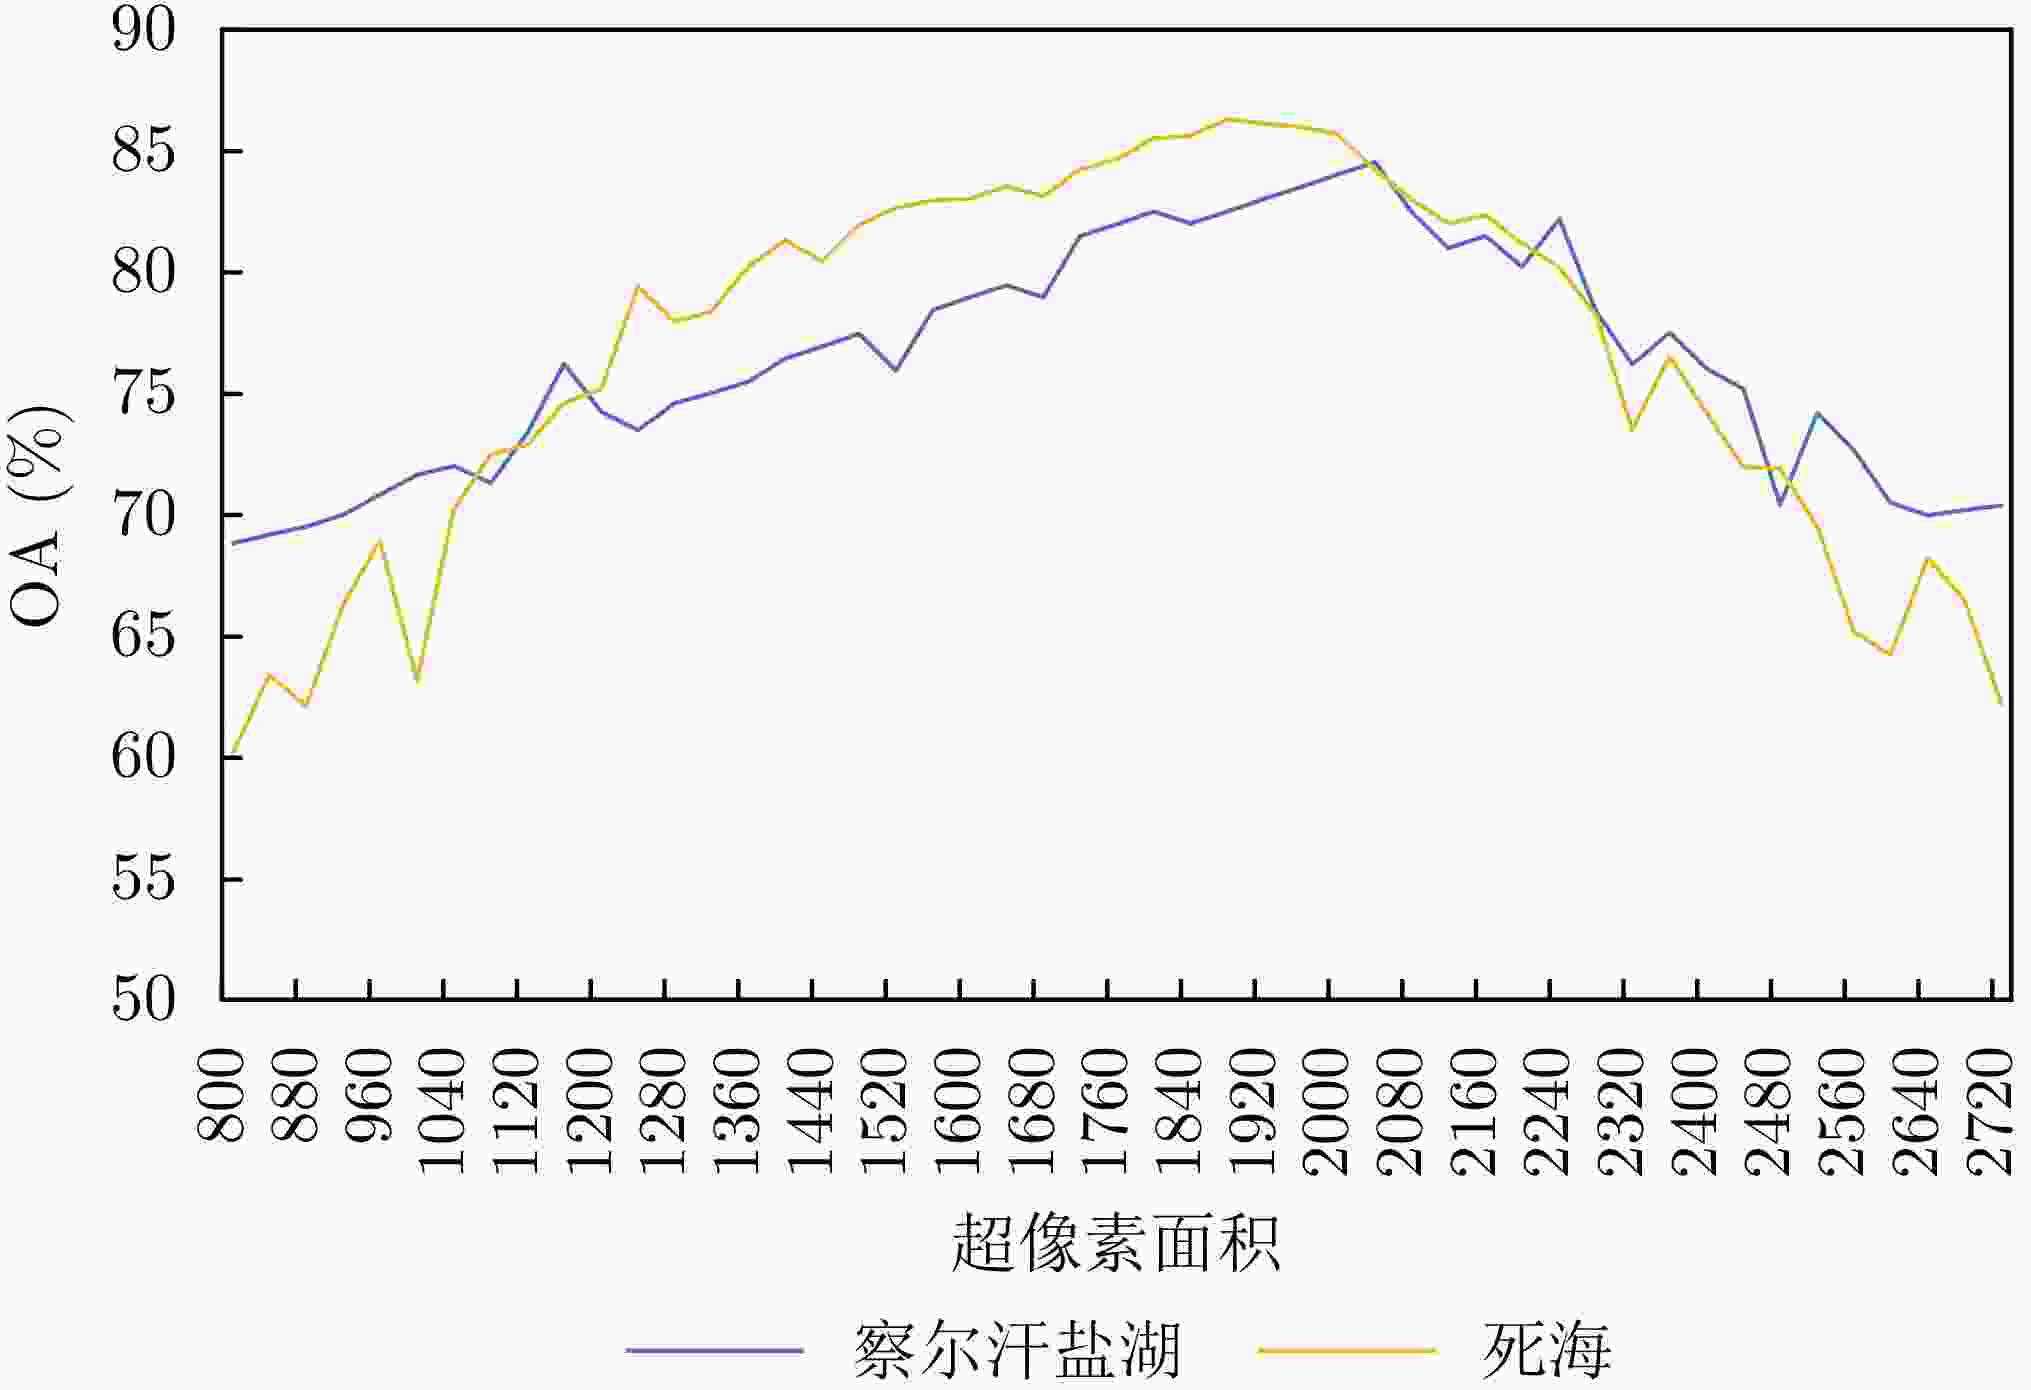
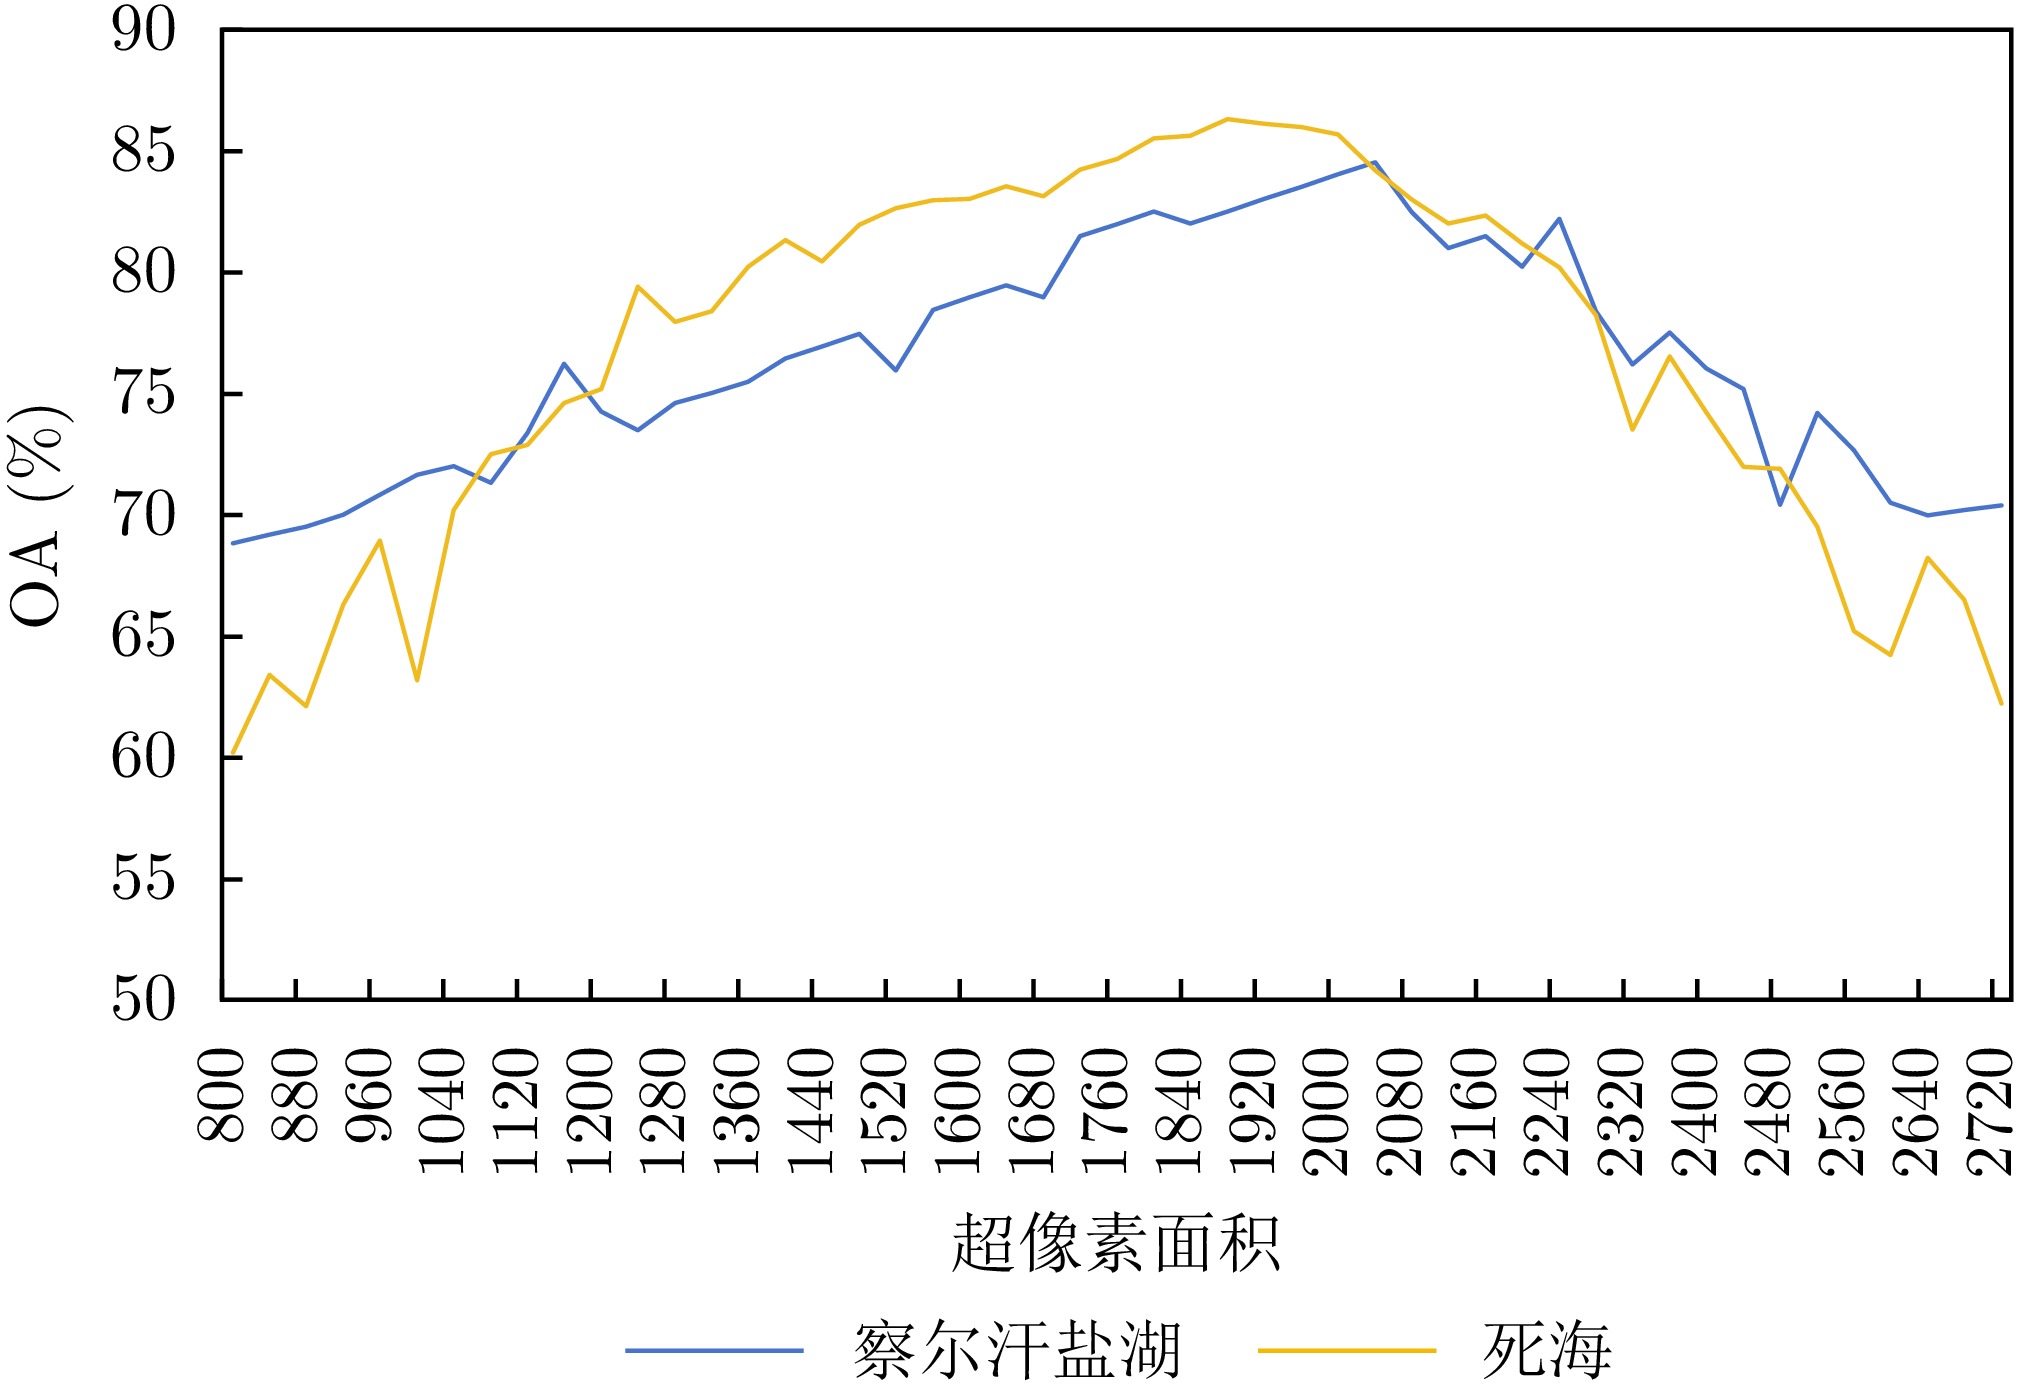
图 13 超像素面积与分类精度之间的关系
Figure 13. Relationship between superpixel area and classification accuracy
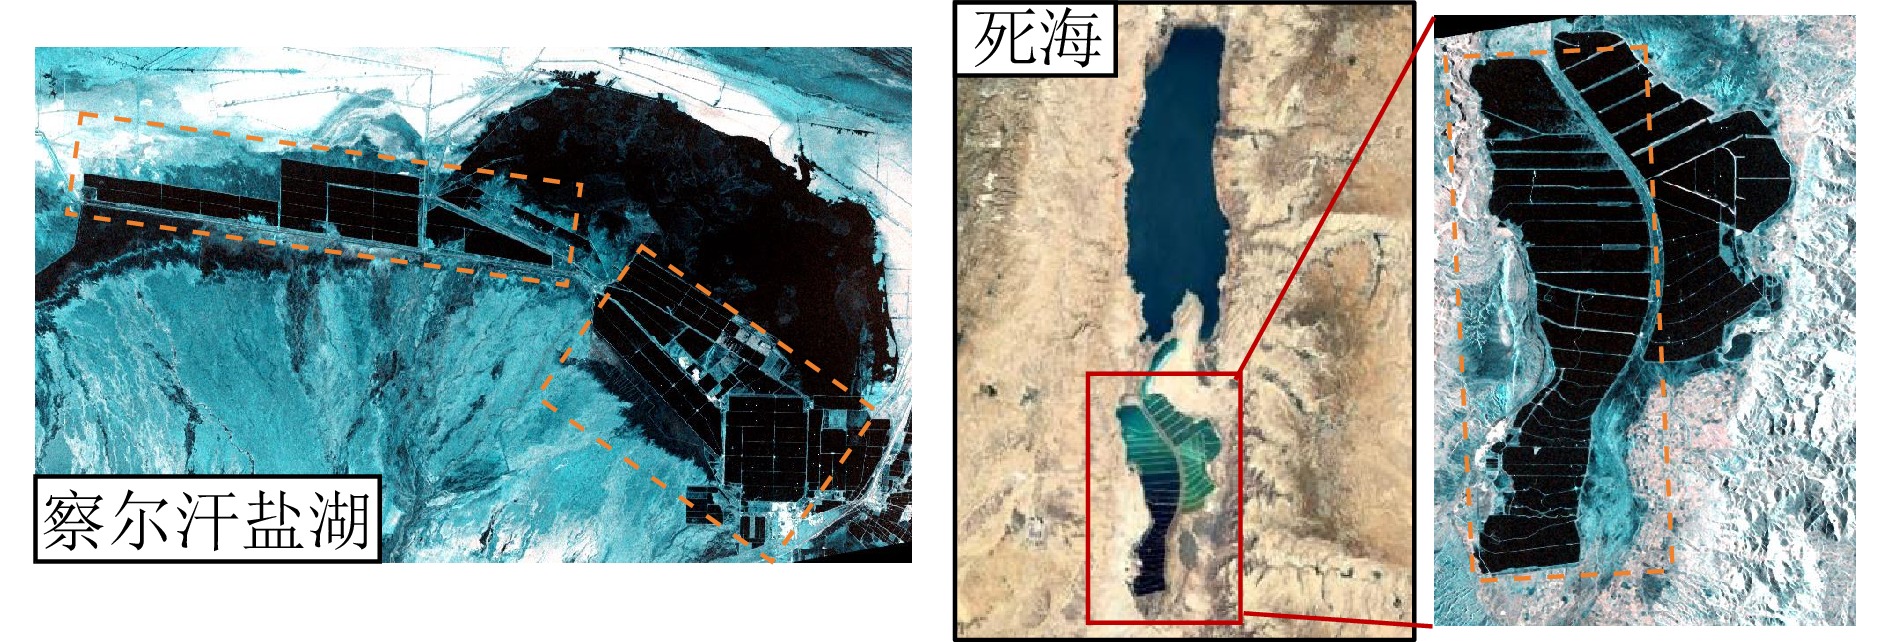
表 1 两个数据集的详细信息
Table 1. Detailed information on the two sets
参数 察尔汗盐湖数据集 死海数据集 卫星传感器 Sentinel-1A Sentinel-1A 成像频率 C-band 5.4 GHz C-band 5.4 GHz 成像模式 IW IW 中心入射角 33.54° 37.62° 极化方式 VV+VH VV+VH 图像大小 8000 ×5000 2000× 3000 时相数量 6 5 采集时间
(年/月/日)2022/01/20; 2022/02/13;
2022/03/21; 2022/04/14;
2022/05/08; 2022/06/132023/01/09; 2023/02/02;
2023/03/10; 2023/05/09;
2023/07/08 下载: 导出CSV
表 2 察尔汗盐湖数据集上定量评估结果
Table 2. Quantitative evaluation results on the Qarhan Salt Lake dataset
方法 $ P_c $ (%) R (%) $ F_1 $ (%) OA (%) Kappa (%) 钠盐田 钾盐田 钠盐田 钾盐田 钠盐田 钾盐田 Proposed 76.31 96.27 96.34 72.47 85.16 82.69 84.76 68.74 PolCNN 46.22 49.34 99.98 0.089 63.21 0.178 46.07 –0.004 PMWC 72.14 54.47 11.87 94.72 20.38 69.17 57.23 8.337 ODCM 61.73 73.04 76.96 56.21 68.51 63.53 66.15 33.14 SMSS 61.22 82.86 88.43 51.07 72.35 63.19 67.25 36.98 STMA 74.41 92.53 93.87 71.16 83.01 80.45 81.96 64.41 注:加粗数值表示每列数据中的最高值。
下载: 导出CSV
表 3 死海数据集上定量评估结果
Table 3. Quantitative evaluation results of methods on the Dead Sea dataset
方法 $ P_c $ (%) R (%) $ F_1 $ (%) OA (%) Kappa (%) 钠盐田 钾盐田 钠盐田 钾盐田 钠盐田 钾盐田 Proposed 87.69 81.69 93.15 70.05 90.33 75.42 86.13 65.84 PolCNN 69.61 50.00 99.98 0.056 82.07 0.111 69.60 0.044 PMWC 47.12 24.38 14.28 63.29 21.92 35.20 29.18 –15.47 ODCM 83.22 60.28 82.14 62.06 82.68 61.16 76.04 43.85 SMSS 82.99 67.97 87.92 58.72 85.38 63.01 79.05 48.50 STMA 82.16 92.93 98.31 50.99 89.52 65.86 83.96 56.51 注:加粗数值表示每列数据中的最高值。
下载: 导出CSV
表 4 不同分类器在察尔汗盐湖定量评价结果
Table 4. Performance evaluation of classification in Qarhan Salt Lake dataset
方法 $ P_c $ (%) R (%) $ F_1 $ (%) OA (%) Kappa (%) 钠盐田 钾盐田 钠盐田 钾盐田 钠盐田 钾盐田 Proposed 76.31 96.27 96.34 72.47 85.16 82.69 84.76 68.74 ML 62.47 81.98 87.12 52.78 72.76 64.22 68.89 39.11 MinD 61.76 80.14 84.88 51.24 71.50 62.51 67.78 36.87 BE 60.48 78.14 85.01 50.16 70.68 61.10 66.85 34.12 MahD 61.74 78.77 83.47 53.96 70.98 64.05 67.25 36.14 SVM 61.85 83.83 89.79 50.34 73.25 62.91 68.87 38.36 NB 62.17 83.22 88.74 51.69 73.12 63.77 69.74 39.21 RF 64.44 81.74 85.41 57.23 73.46 67.32 70.45 42.53 注:加粗数值表示每列数据中的最高值。
下载: 导出CSV
表 5 不同分类器在死海数据集上定量评价结果
Table 5. Performance evaluation of classification in Dead Sea dataset
方法 $ P_c $ (%) R (%) $ F_1 $ (%) OA (%) Kappa (%) 钠盐田 钾盐田 钠盐田 钾盐田 钠盐田 钾盐田 Proposed 87.69 81.69 93.15 70.05 90.33 75.42 86.13 65.84 ML 87.01 53.23 70.94 75.74 78.16 62.52 72.40 41.71 MinD 88.14 49.40 64.12 80.24 74.24 61.15 69.02 37.73 BE 86.11 53.71 72.44 73.24 78.68 61.97 72.68 41.44 MahD 87.25 51.88 68.83 76.97 76.96 61.99 71.31 40.31 SVM 83.57 69.70 88.59 60.10 86.01 64.54 79.93 50.66 NB 84.80 64.84 84.54 65.30 84.67 65.07 78.69 49.74 RF 88.71 66.09 83.01 75.81 85.77 70.61 80.82 56.48 注:加粗数值表示每列数据中的最高值。
下载: 导出CSV
表 6 不同方法在两个数据集上的运行时间
Table 6. Running time of different methods on two datasets
数据集 方法 数据大小
(像素数)运行时间(s) 特征提取 分类 总计 察尔汗盐湖 Proposed $ 6 \times 8000 \times 5000 $ 5658.38 181.91 5840.29 PolCNN $ 1 \times 8000 \times 5000 $ 3411.35 3411.35 PMWC 6443.15 6443.15 ODCM $ 2 \times 8000 \times 5000 $ 2555.14 1894.22 4449.36 SMSS $ 6 \times 8000 \times 5000 $ 43377.97 354.72 43732.69 STMA 6391.79 6391.79 死海 Proposed $ 5 \times 2000 \times 3000 $ 730.30 67.99 798.29 PolCNN $ 1 \times 2000 \times 3000 $ 704.48 704.48 PMWC 1024.19 1024.19 ODCM $ 2 \times 2000 \times 3000 $ 402.02 440.70 842.72 SMSS $ 5 \times 2000 \times 3000 $ 4750.32 102.77 4853.09 STMA 1847.05 1847.05
下载: 导出CSV
表 7 不同超像素面积对应的分类精度
Table 7. Classification accuracy corresponding to different superpixel areas
超像素面积 察尔汗盐湖OA (%) 死海OA (%) 1840 82.02 85.63 1880 82.52 86.32 1920 83.03 86.13 1960 83.54 86.002 2000 84.13 86.13 2040 84.55 84.21 2080 82.48 83.00 注:标红数值为每列数据中的最高值。
下载: 导出CSV
-
[1] 张苏江, 张琳, 姜爱玲, 等. 中国盐湖资源开发利用现状与发展建议[J]. 无机盐工业, 2022, 54(10): 13–21. doi: 10.19964/j.issn.1006-4990.2022-0425.ZHANG Sujiang, ZHANG Lin, JIANG Ailing, et al. Current situation and development suggestions of development and utilization of Salt Lake resources in China[J]. Inorganic Chemicals Industry, 2022, 54(10): 13–21. doi: 10.19964/j.issn.1006-4990.2022-0425. [2] 韩积斌, 许建新, 安朝, 等. 盐湖地下卤水的开采技术及其展望[J]. 盐湖研究, 2015, 23(1): 67–72. doi: 10.12119/j.yhyj.201501010.HAN Jibin, XU Jianxin, AN Zhao, et al. Research advance of the Salt Lake underground brine extraction technology[J]. Journal of Salt Lake Research, 2015, 23(1): 67–72. doi: 10.12119/j.yhyj.201501010. [3] 陈奥. 基于遥感技术的盐湖资源开发行为对柴达木盆地盐湖区景观变化的影响评估[D]. [硕士论文], 中国科学院大学(中国科学院青海盐湖研究所), 2018.CHEN Ao. Evaluation of resources exploitation to landscape variation of Salt Lake area in Qaidam Basin by remote sensing[D]. [Master dissertation], University of Chinese Academy of Sciences (Qinghai Institute of Salt Lakes, Chinese Academy of Sciences), 2018. [4] HAN Wentao, FU Haiqiang, ZHU Jianjun, et al. A polarimetric projection-based scattering characteristics extraction tool and its application to PolSAR image classification[J]. ISPRS Journal of Photogrammetry and Remote Sensing, 2023, 202: 314–333. doi: 10.1016/j.isprsjprs.2023.05.031. [5] GAO Li, LIN Zhiyuan, YIN Qiang, et al. Classification performance comparison of time-variant scattering features of multi-temporal polarimetric SAR data[C]. IEEE International Geoscience and Remote Sensing Symposium, Pasadena, USA, 2023: 8050–8053. doi: 10.1109/IGARSS52108.2023.10282315. [6] YU Xiaoping and YUE Xijuan. Similarity matrix entropy for multitemporal polarimetric SAR change detection[J]. IEEE Geoscience and Remote Sensing Letters, 2022, 19: 4003805. doi: 10.1109/LGRS.2020.3030674. [7] WEI Jujie, ZHANG Yonghong, YU Xiaoping, et al. A temporal difference matrix for historical cumulative change detection in time series PolSAR data[J]. International Journal of Applied Earth Observation and Geoinformation, 2024, 131: 103978. doi: 10.1016/j.jag.2024.103978. [8] WANG Guanya, LI Zhiwei, HU Jun, et al. A modified EVD-based phase linking method in decorrelated scenario with time series polarimetric scattering consistency[J]. IEEE Journal of Selected Topics in Applied Earth Observations and Remote Sensing, 2025, 18: 7694–7706. doi: 10.1109/JSTARS.2025.3547947. [9] BREIMAN L. Random forests[J]. Machine Learning, 2001, 45(1): 5–32. doi: 10.1023/A:1010933404324. [10] GEURTS P, ERNST D, and WEHENKEL L. Extremely randomized trees[J]. Machine Learning, 2006, 63(1): 3–42. doi: 10.1007/s10994-006-6226-1. [11] REIGBER A, JÄGER M, NEUMANN M, et al. Classifying polarimetric SAR data by combining expectation methods with spatial context[J]. International Journal of Remote Sensing, 2010, 31(3): 727–744. doi: 10.1080/01431160902897809. [12] BHATTACHARYA A and TOUZI R. Polarimetric SAR urban classification using the Touzi target scattering decomposition[J]. Canadian Journal of Remote Sensing, 2011, 37(4): 323–332. doi: 10.5589/m11-042. [13] IOANNIDOU M, KOUKOS A, SITOKONSTANTINOU V, et al. Assessing the added value of sentinel-1 PolSAR data for crop classification[J]. Remote Sensing, 2022, 14(22): 5739. doi: 10.3390/rs14225739. [14] MAUS V, CÂMARA G, CARTAXO R, et al. A time-weighted dynamic time warping method for land-use and land-cover mapping[J]. IEEE Journal of Selected Topics in Applied Earth Observations and Remote Sensing, 2016, 9(8): 3729–3739. doi: 10.1109/JSTARS.2016.2517118. [15] GAO Han, WANG Changcheng, WANG Guanya, et al. A novel crop classification method based on ppfSVM classifier with time-series alignment kernel from dual-polarization SAR datasets[J]. Remote Sensing of Environment, 2021, 264: 112628. doi: 10.1016/j.rse.2021.112628. [16] BARGIEL D. A new method for crop classification combining time series of radar images and crop phenology information[J]. Remote Sensing of Environment, 2017, 198: 369–383. doi: 10.1016/j.rse.2017.06.022. [17] KENDUIYWO B K, BARGIEL D, and SOERGEL U. Higher order dynamic conditional random fields ensemble for crop type classification in radar images[J]. IEEE Transactions on Geoscience and Remote Sensing, 2017, 55(8): 4638–4654. doi: 10.1109/TGRS.2017.2695326. [18] LEITE P B C, FEITOSA R Q, FORMAGGIO A R, et al. Hidden Markov models for crop recognition in remote sensing image sequences[J]. Pattern Recognition Letters, 2011, 32(1): 19–26. doi: 10.1016/j.patrec.2010.02.008. [19] LI Mengmeng and BIJKER W. Potential of multi-temporal sentinel-1A dual polarization SAR images for vegetable classification in Indonesia[C]. 2018 IEEE International Geoscience and Remote Sensing Symposium, Valencia, Spain, 2018: 3820–3823. doi: 10.1109/IGARSS.2018.8517325. [20] NI Jun, LÓPEZ-MARTÍNEZ C, HU Zhongbo, et al. Multitemporal SAR and polarimetric SAR optimization and classification: Reinterpreting temporal coherence[J]. IEEE Transactions on Geoscience and Remote Sensing, 2022, 60: 5236617. doi: 10.1109/TGRS.2022.3214097. [21] HAN Zhu, ZHANG Ce, GAO Lianru, et al. Spatio-temporal multi-level attention crop mapping method using time-series SAR imagery[J]. ISPRS Journal of Photogrammetry and Remote Sensing, 2023, 206: 293–310. doi: 10.1016/j.isprsjprs.2023.11.016. [22] LEVY Y and GVIRTZMAN H. Industry-driven versus natural groundwater flow regime at the dead sea coastal aquifer[J]. Water, 2021, 13(4): 498. doi: 10.3390/w13040498. [23] YIN Qiang, HONG Wen, ZHANG Fan, et al. Optimal combination of polarimetric features for vegetation classification in PolSAR image[J]. IEEE Journal of Selected Topics in Applied Earth Observations and Remote Sensing, 2019, 12(10): 3919–3931. doi: 10.1109/JSTARS.2019.2940973. [24] KERSTEN P R, LEE J S, and AINSWORTH T L. Unsupervised classification of polarimetric synthetic aperture radar images using fuzzy clustering and EM clustering[J]. IEEE Transactions on Geoscience and Remote Sensing, 2005, 43(3): 519–527. doi: 10.1109/TGRS.2004.842108. [25] ZHANG Fan, MENG Fanle, MA Fei, et al. Time correlation entropy: A novel multitemporal PolSAR feature and its application in Salt Lake classification[J]. IEEE Transactions on Geoscience and Remote Sensing, 2024, 62: 4506814. doi: 10.1109/TGRS.2024.3404598. [26] DABBOOR M and SHOKR M. A new likelihood ratio for supervised classification of fully polarimetric SAR data: An application for sea ice type mapping[J]. ISPRS Journal of Photogrammetry and Remote Sensing, 2013, 84: 1–11. doi: 10.1016/j.isprsjprs.2013.06.010. [27] DUDA R O, HART P E, and STORK D G. Pattern Classification[M]. 2nd ed. Hoboken: Wiley-Interscience, 2000. [28] HE Yuting, WANG Shigang, and GAO Xueshan. Analysis and research of spinal CT image segmentation based on improved watershed algorithm[C]. IEEE 3rd International Conference on Electronic Communications, Internet of Things and Big Data, Taichung, China, 2023: 119–123. doi: 10.1109/ICEIB57887.2023.10170668. [29] TANG Yincai and WEI Xiaoling. Existence of maximum likelihood estimation for three-parameter log-normal distribution[C]. The 8th International Conference on Reliability, Maintainability and Safety, Chengdu, China, 2009: 305–307. doi: 10.1109/ICRMS.2009.5270184. [30] AHN S, LEE J, YOON D, et al. Enhanced modulation classification algorithm based on Kolmogorov-Smirnov test[C]. 2017 International Conference on Information and Communication Technology Convergence, Jeju, Korea (South), 2017: 232–234. doi: 10.1109/ICTC.2017.8190976. [31] MARINO A and ALONSO-GONZÁLEZ A. An optimization of the difference of covariance matrices for PolSAR change detection[C]. 2017 IEEE International Geoscience and Remote Sensing Symposium, Fort Worth, USA, 2017: 5315–5318. doi: 10.1109/IGARSS.2017.8128204. [32] ALONSO-GONZÁLEZ A, LÓPEZ-MARTÍNEZ C, PAPATHANASSIOU K P, et al. Polarimetric SAR time series change analysis over agricultural areas[J]. IEEE Transactions on Geoscience and Remote Sensing, 2020, 58(10): 7317–7330. doi: 10.1109/TGRS.2020.2981929. [33] PREETHI S, PRAKASH A A, RAMYEA R, et al. CNN based automated land use classification from remotely sensed image[C]. 2021 Innovations in Power and Advanced Computing Technologies, Kuala Lumpur, Malaysia, 2021: 1–4. doi: 10.1109/i-PACT52855.2021.9696772. [34] WANG Yuxing and JIANG Yulian. A weighted minimum distance classifier based on relative offset[C]. IEEE 4th International Conference on Cloud Computing and Big Data Analysis, Chengdu, China, 2019: 1–6. doi: 10.1109/ICCCBDA.2019.8725734. [35] PAL S, ALAM S, and MITRA M. Binary coding of Arrhythmic beats for generation of simplified classification rule[C]. 2011 International Conference on Communication and Industrial Application, Kolkata, India, 2011: 1–5. doi: 10.1109/ICCIndA.2011.6146674. [36] JITKONGCHUEN D and SUKPONGTHAI W. Handling imbalanced data classification problem using artificial immune system with mahalanobis distance[C]. The 20th IEEE/ACIS International Conference on Software Engineering, Artificial Intelligence, Networking and Parallel/Distributed Computing, Toyama, Japan, 2019: 67–71. doi: 10.1109/SNPD.2019.8935760. [37] WITTENBERG L J. Salt-gradient Solar Ponds: Design, Construction and Power Production[M]. JANZEN A F and SWARTMAN R K. Solar Energy Conversion II. Toronto: Pergamon, 1981: 411–429. doi: 10.1016/B978-0-08-025388-6.50057-X. -

计量
- 文章访问数:
- HTML全文浏览量:
- PDF下载量:
- 被引次数: 0

