
 作者中心
作者中心 专家审稿
专家审稿 责编办公
责编办公 编辑办公
编辑办公
-
摘要: 星载混合极化合成孔径雷达(HP-SAR)作为一种兼顾丰富极化信息获取与高性能成像的体制,具有系统复杂度低、数据获取成本小等优势,已成为多维度微波成像遥感的热点方向。陆地探测一号(LT-1)是中国首颗具备星载混合极化成像能力的雷达卫星,同时也是国际上首颗实现多通道混合极化成像雷达体制的卫星。该研究基于LT-1卫星混合极化图像,构建并系统阐释了星载HP-SAR评估与分析数据集(HEAD-1.0),填补了高质量开源HP数据集的空白,旨在为混合极化图像质量的定量评估、HP-SAR技术的发展及下一代卫星任务设计提供数据保障,尤其支持陆地、海洋与深空等领域的新观测技术发展。该数据集涵盖3部分:(1)LT-1 SAR图像,包含30景混合极化与16景全极化图像,覆盖面积约
64000 km2;(2)辅助数据,包括6幅光学遥感图像,以及与SAR图像覆盖区域一致的数字高程模型数据;(3)标注数据,包括28个有源/无源定标器、约17 km2地物分类与23个多边形/线形类行星场景的标注。基于HEAD-1.0,该文初步开展了混合极化SAR定标、混合极化/全极化地物分类能力对比及类行星地貌混合极化特征分析等相关工作的定性与定量研究。后续将通过协同多平台、融合多波段、多角度和多时相的成像数据,进一步构建国际先进的极化SAR遥感基准数据库,重点支撑行星表面与次表层探测、多源遥感数据智能融合、SAR图像智能解译算法等关键技术的创新研究。-
关键词:
- 混合极化合成孔径雷达 /
- 公开数据集 /
- 极化定标 /
- 地物分类 /
- 类行星场景
Abstract: The spaceborne Hybrid-Polarimetric Synthetic Aperture Radar (HP-SAR) balances the acquisition of rich polarimetric information with high-performance imaging. It offers advantages such as low system complexity and reduced data acquisition costs, and has emerged as a prominent direction in multidimensional microwave remote sensing. LT-1 is China’s first radar satellite equipped with spaceborne HP imaging capability, and it is also the world’s first satellite to implement a multi-channel HP radar system. This study utilizes HP imagery from the LT-1 satellite to construct and systematically elaborate the HP-SAR Evaluation and Analytical Dataset (HEAD-1.0), thereby addressing the lack of high-quality open-source HP datasets. HEAD-1.0 aims to provide data support for the quantitative assessment of HP-SAR image quality, the development of HP-SAR technology, and the design of new satellite missions, with particular emphasis on supporting novel observational technologies for terrestrial, oceanic, and deep-space applications. It comprises three components: (1) LT-1 SAR imagery, including 30 HP-SAR images and 16 Quad-Polarimetric SAR (QP-SAR) images, covering an area of approximately 64000 km2; (2) Auxiliary data, including six optical images and Digital Elevation Model (DEM) data in the same area as SAR images; and (3) Annotation data, including 28 active/passive calibrators, approximately 17 km2 of land cover classification, and 23 polygonal/linear annotated planetary analog scenes. Based on HEAD-1.0, a preliminary qualitative and quantitative study was conducted, involving HP-SAR calibration, a comparison of terrain classification between HP-SAR and QP-SAR, and an analysis of HP characterizations of planetary analog scenes. In the future, an internationally advanced polarimetric SAR benchmark database will be constructed by integrating multi-platform, multi-band, multi-angle, and multi-temporal imaging data. In particular, the future study will focus on supporting innovative research on key technologies, including planetary surface and subsurface exploration, intelligent fusion of multisource remote sensing data, and advanced interpretation algorithms for SAR imagery. -
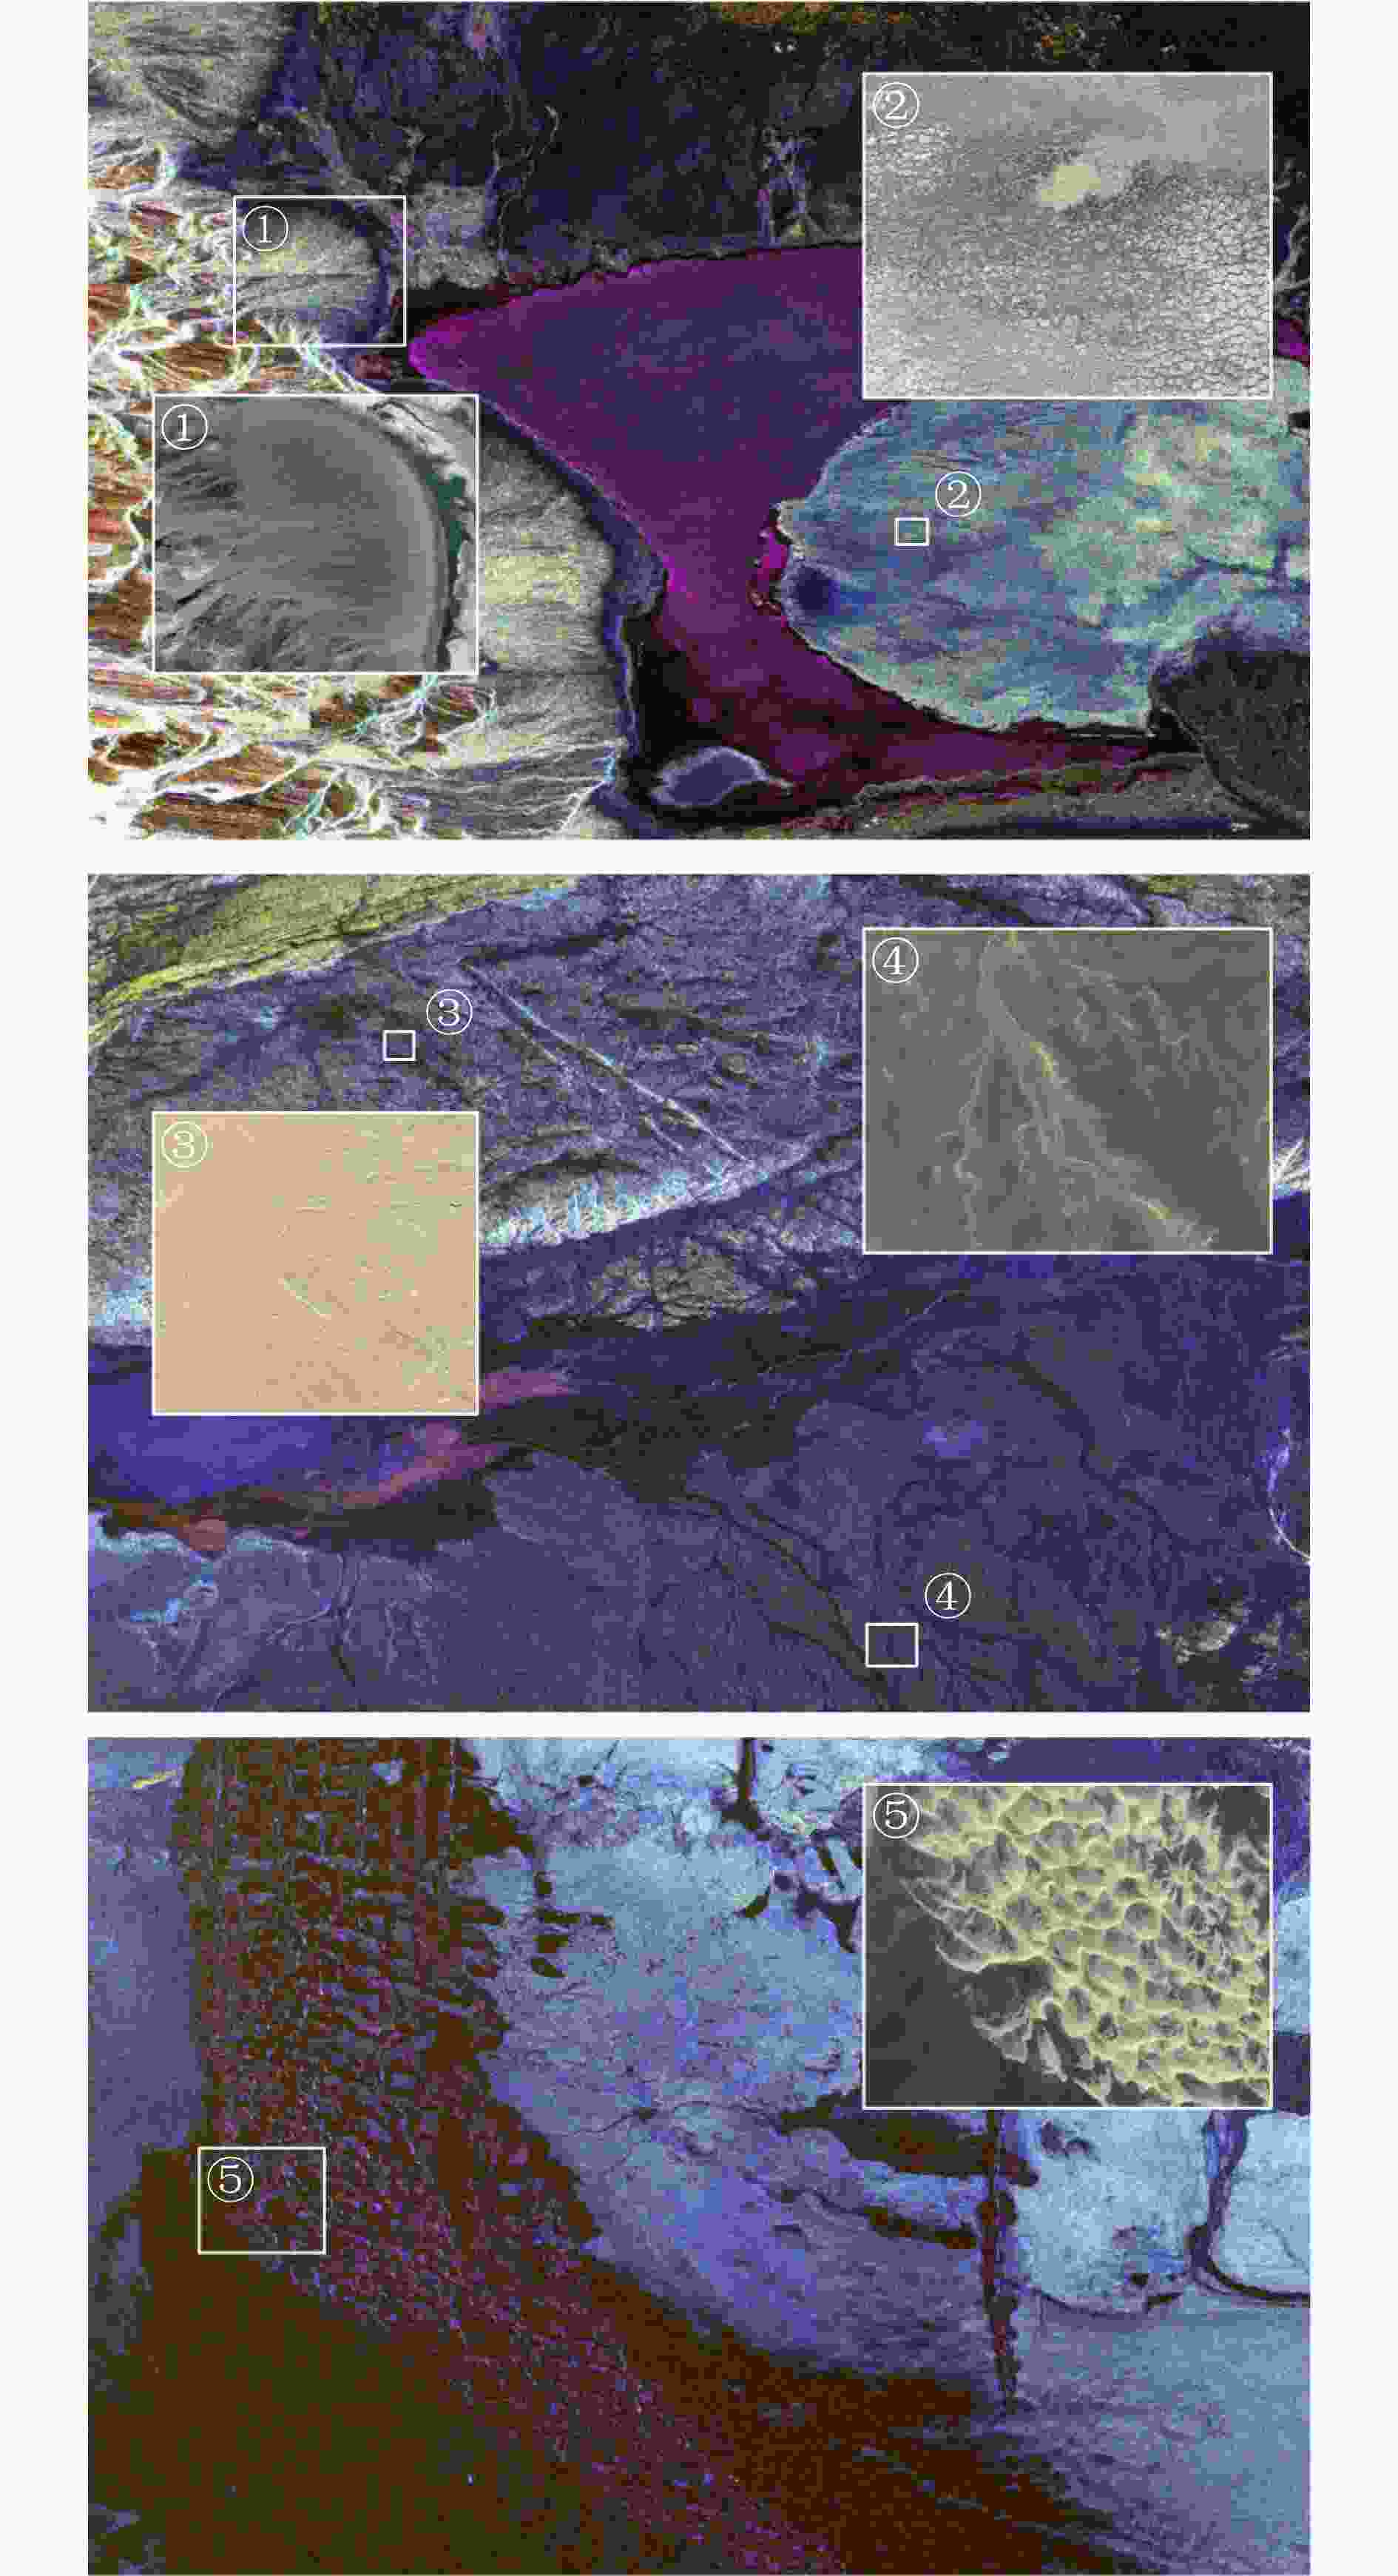
图 14 代表性类行星地貌场景 ①冲积扇(94.41°E, 45.16°N),②多边形表面结构(94.45°E, 45.14°N),③横向风成脊(93.44°E, 42.14°N),④谷网(93.49°E, 42.08°N),⑤新月形沙丘链(93.09°E, 41.30°N)
Figure 14. Representative terrestrial analogue sites of Martan landforms ① Alluvial fans (94.41°E, 45.16°N), ② Polygonal surface structure (94.45°E, 45.14°N), ③ Transverse aeolian ridges (93.44°E, 42.14°N), ④ Valley networks (93.49°E, 42.08°N), ⑤ Barchan dune chains (93.09°E, 41.30°N)
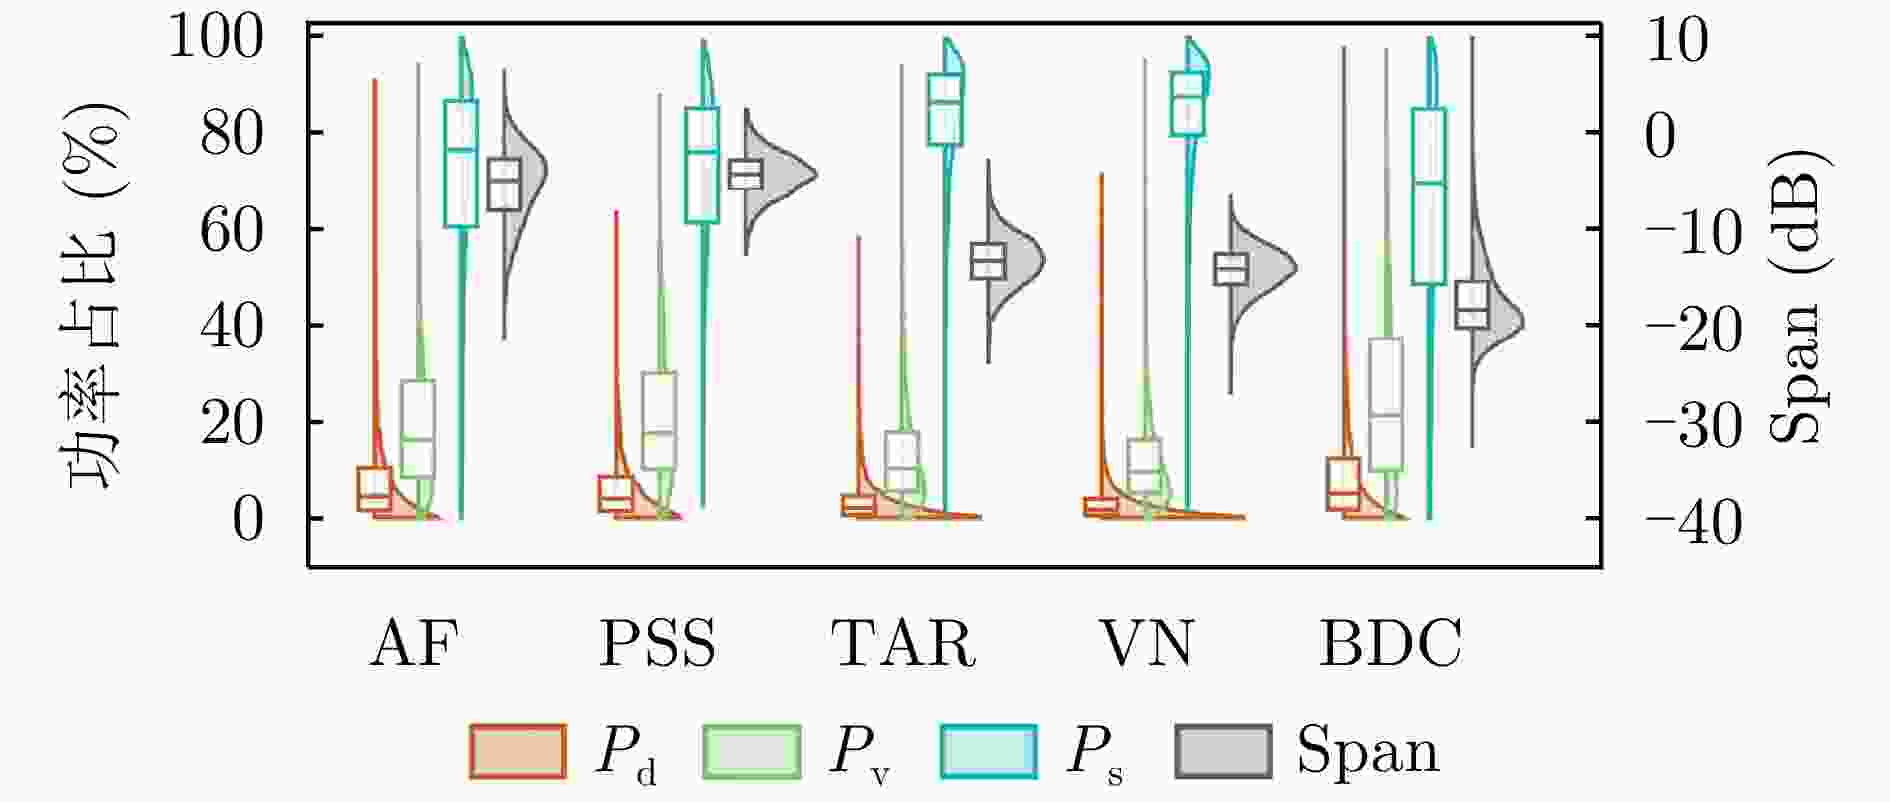
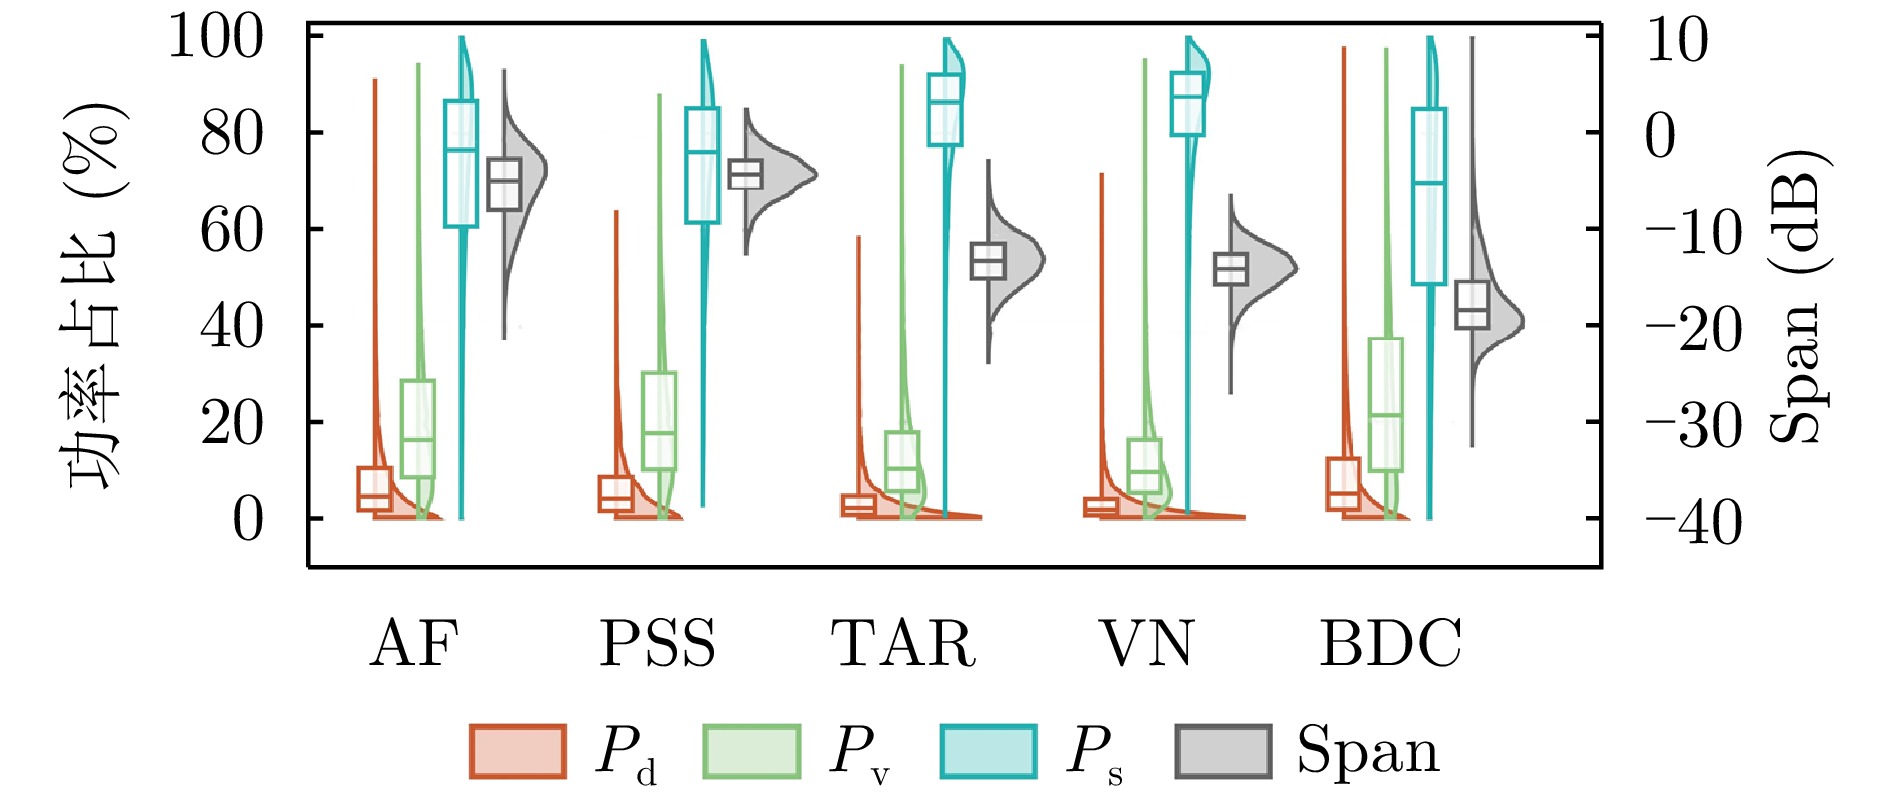
图 15 不同地貌的m-χ分解功率占比(Pd, Pv, Ps,对应左轴)及总功率(Span)分布(对应右轴)
Figure 15. Power contributions from m-χ decomposition (Pd, Pv, Ps, left axis) and span distributions (right axis) for different landforms
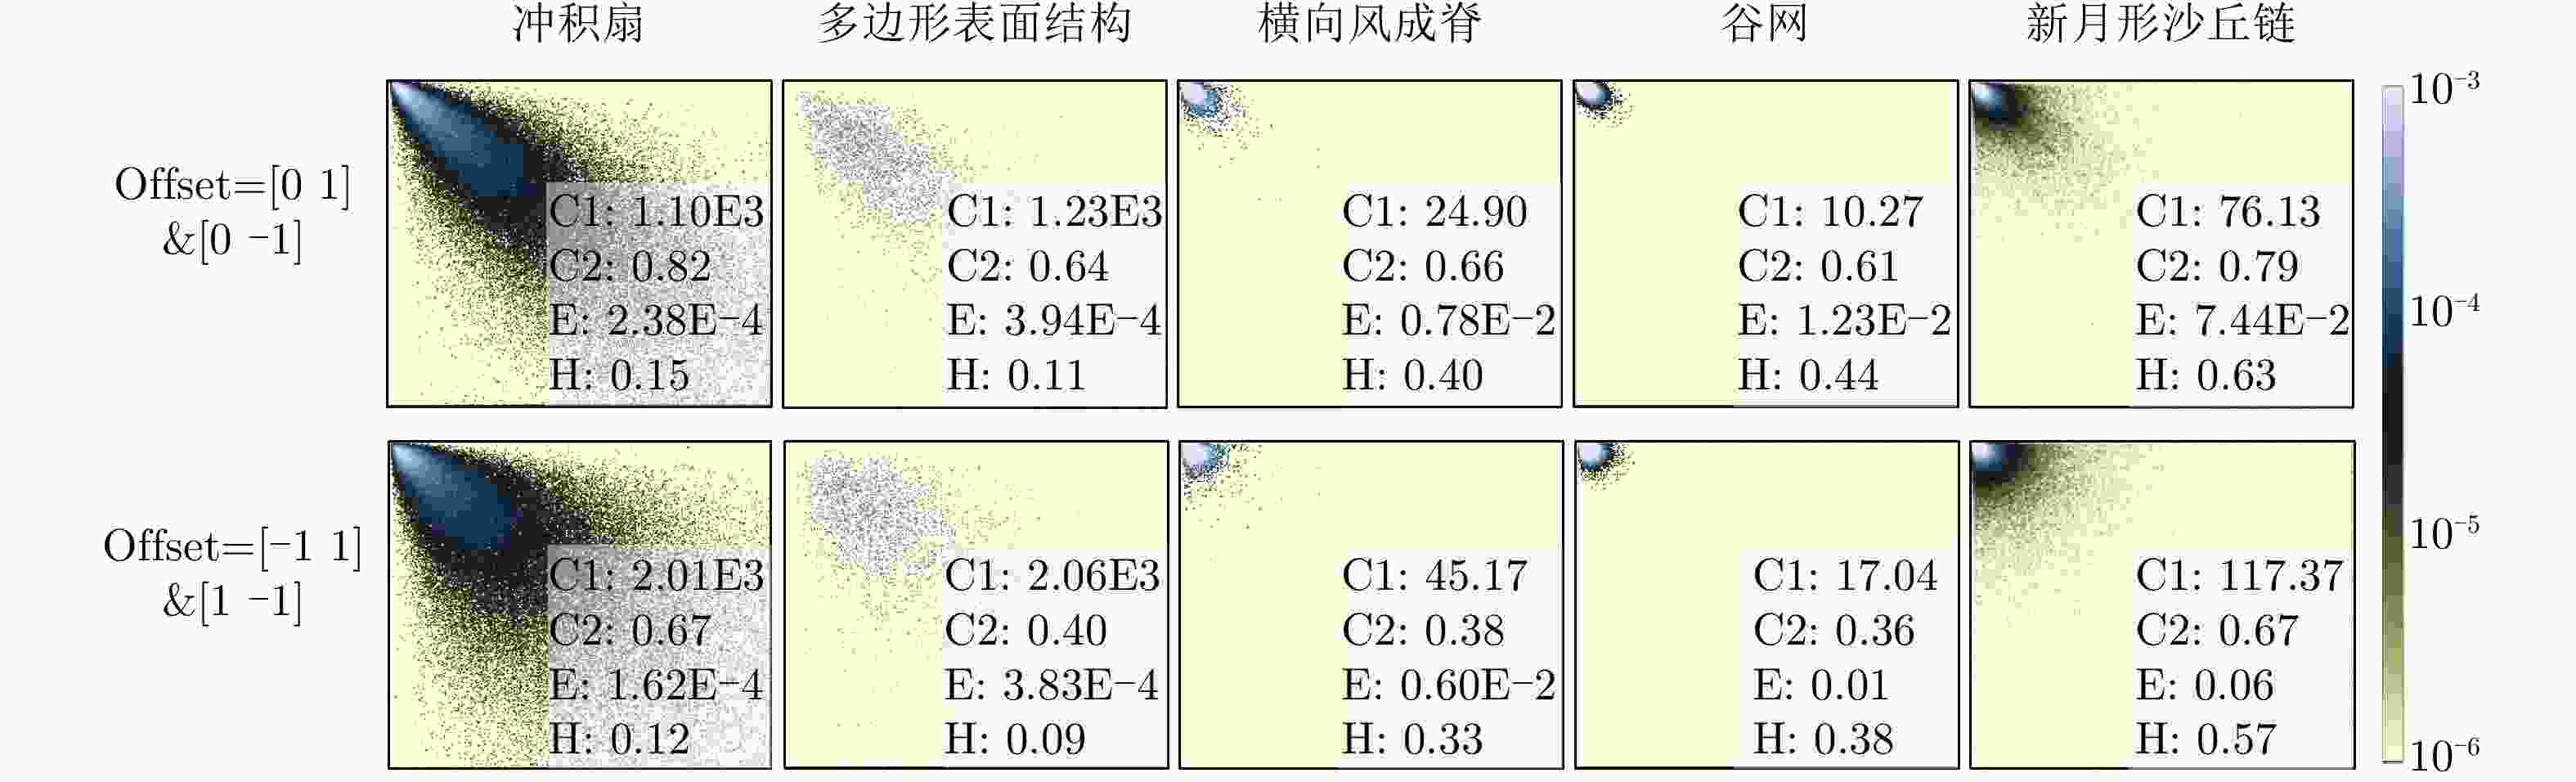
图 16 不同地貌的灰度共生矩阵(其中C1表示Contrast,C2表示Correlation,E表示Energy,H表示Homogeneity)
Figure 16. Gray-Level Co-occurrence Matrices of different landforms (C1 denotes Contrast, C2 denotes Correlation, E denotes Energy, and H denotes Homogeneity)

图 17 HEAD-1.0:星载混合极化成像雷达评估与分析数据集
Figure 17. HEAD-1.0: Spaceborne hybrid-polarimetric SAR evaluation and analysis dataset
表 1 HEAD-1.0总览
Table 1. Overview of the HEAD-1.0
数据类型 数据来源 数据量 数据用途 备注 SAR
图像混合极化(HP) LT-1 30景,覆盖面积
约6.4×10⁴ km2主数据源,用于HP成像、地物分类、
极化定标、类行星模拟核心数据,覆盖范围最广 全极化(QP) LT-1 16景,覆盖面积
约2.1×10⁴ km2极化对比数据,用于极化信息
评估与极化定标覆盖范围小于HP数据 辅助
数据光学数据 资源一号、
高分二号6景 辅助目视解译、提供光谱信息、
配准基准资源一号全色图像分辨率2.5 m、
多光谱图像分辨率10 m;
高分二号全色图像分辨率1 m、
多光谱图像分辨率4 mDEM数据 SRTM 与SAR图像匹配 地形校正、坡度坡向分析、辅助分类 空间分辨率1弧秒(约30 m) 标注
数据定标器数据 地面测量 28个点位 SAR极化定标与验证 包含有源定标器和无源三面角
反射器的位置、散射矩阵等信息地物分类
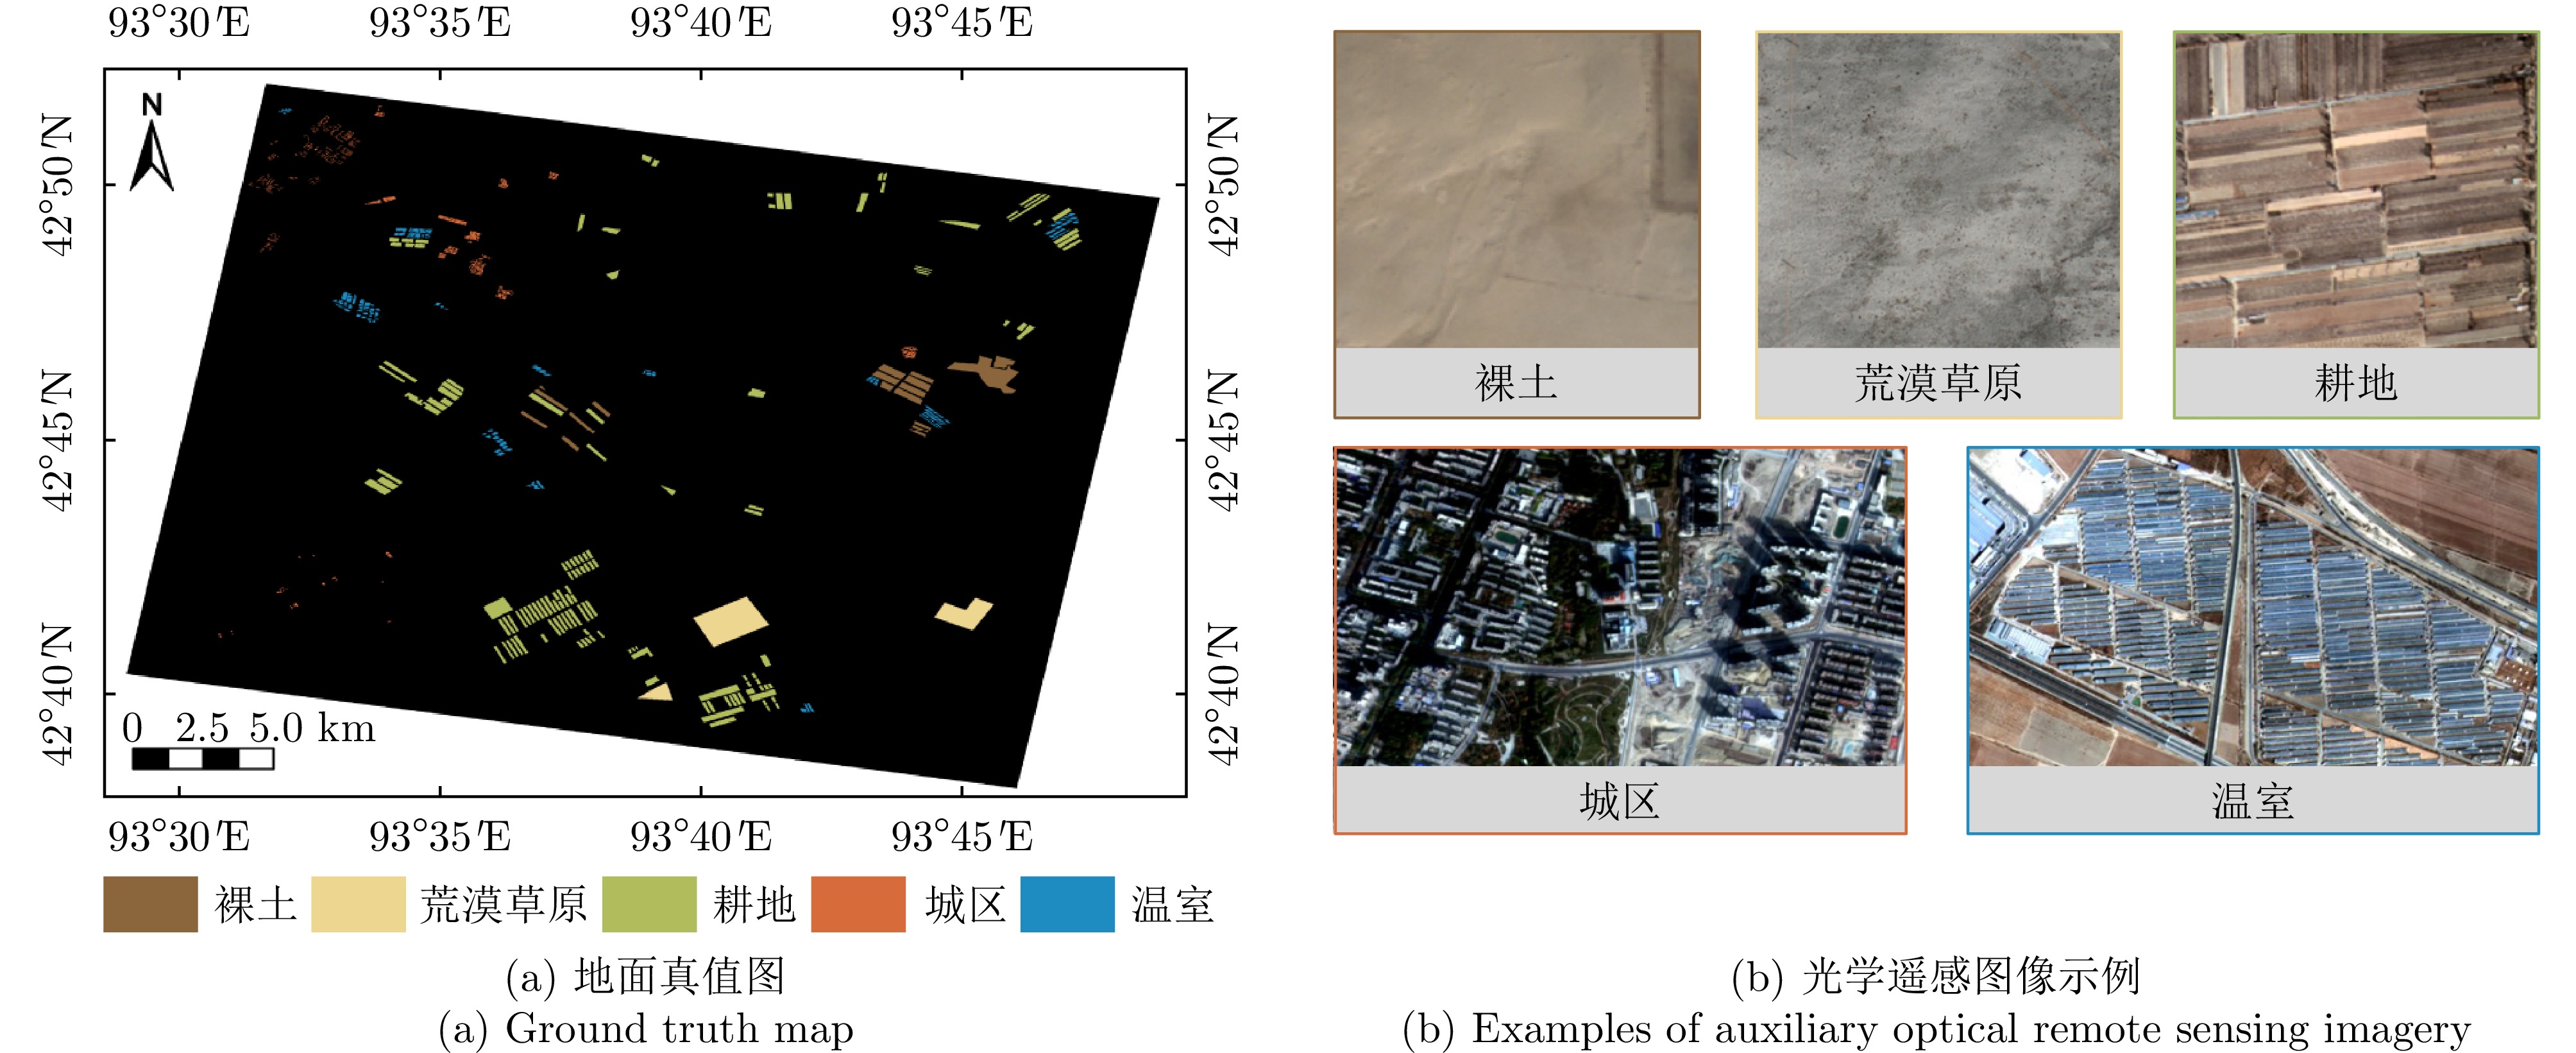
标注数据专家解译 约17 km2 监督分类、精度验证 包括荒漠草原、裸土、耕地、城区、
温室等典型地貌类行星地貌
标注数据专家解译 23个多边形/
线形标注类行星地貌识别与提取 包括冲积扇、冲沟、谷网等类火星地貌,
以及皱脊、岩石地表等类月地貌 下载: 导出CSV
表 2 陆探一号工作模式与参数
Table 2. The operational mode and parameters of LT-1
工作模式 名称 极化方式 通道 幅宽 分辨率 入射角 标称模式 Strip 1 HH/VV 双 50 km 3 m × 3 m 20°~46° (干涉)
20°~53° (成像)
10°~60° (拓展)Strip 2 HH/VV 单 100 km 12 m × 12 m 20°~46° (干涉)
20°~53° (成像)Strip 3 HH+HV/VV+VH 双 50 km 3 m × 3 m 10°~60° Strip 4 HH+HV+VV+VH 单 30 km 6 m × 6 m 13°~21° Strip 5 HH/VV 单 160 km 24 m × 24 m 15.7°~30.0° SCAN HH/VV 双 400 km 30 m × 30 m 20°~49° 实验模式 Exp. 1 RH+RV/LH+LV 双 50 km 3 m × 3 m 9°~60° Exp. 2 HH+HV+VV+VH 单 30 km 6 m × 6 m 13°~38° Exp. 3 HH+HV+VV+VH 双 30 km 3 m × 3 m 13°~53° Exp. 4 RH+RV+LH+LV 双 30 km 3 m × 3 m 13°~53° 注:H表示水平极化;V表示垂直极化;R 表示水平极化分量相位超前垂直极化分量 90°的混合极化;L 表示垂直极化分量相位超前水平极化分量 90°的混合极化。
下载: 导出CSV
表 3 SAR图像参数
Table 3. Parameters of SAR imagery
区域 工作模式 数据获取时间 轨道号 数据量 景中心入射角 区域1 Exp. 1 2023年04月08日 006040 14景 35.9° Strip 4 2023年03月04日 005983 2景 36.4° 区域2 Exp. 1 2024年01月11日 010651 1景 33.0° 区域3 Exp. 1 2024年01月10日 010636 15景 33.1° Strip 4 2023年12月18日 010279 14景 32.9°
下载: 导出CSV
表 4 光学遥感图像参数
Table 4. Parameters of optical remote sensing imagery
卫星 数据获取时间 轨道号 太阳方位角 太阳天顶角 ZY1E 2023年03月01日 18164 160.0° 52.2° ZY1E 2023年03月27日 18541 158.6° 42.2° ZY1E 2023年04月25日 18953 156.2° 31.5° GF-2 2023年03月09日 46229 142.7° 54.4° GF-2 2023年03月19日 46376 141.2° 50.6° GF-2 2023年03月19日 46376 141.3° 50.7°
下载: 导出CSV
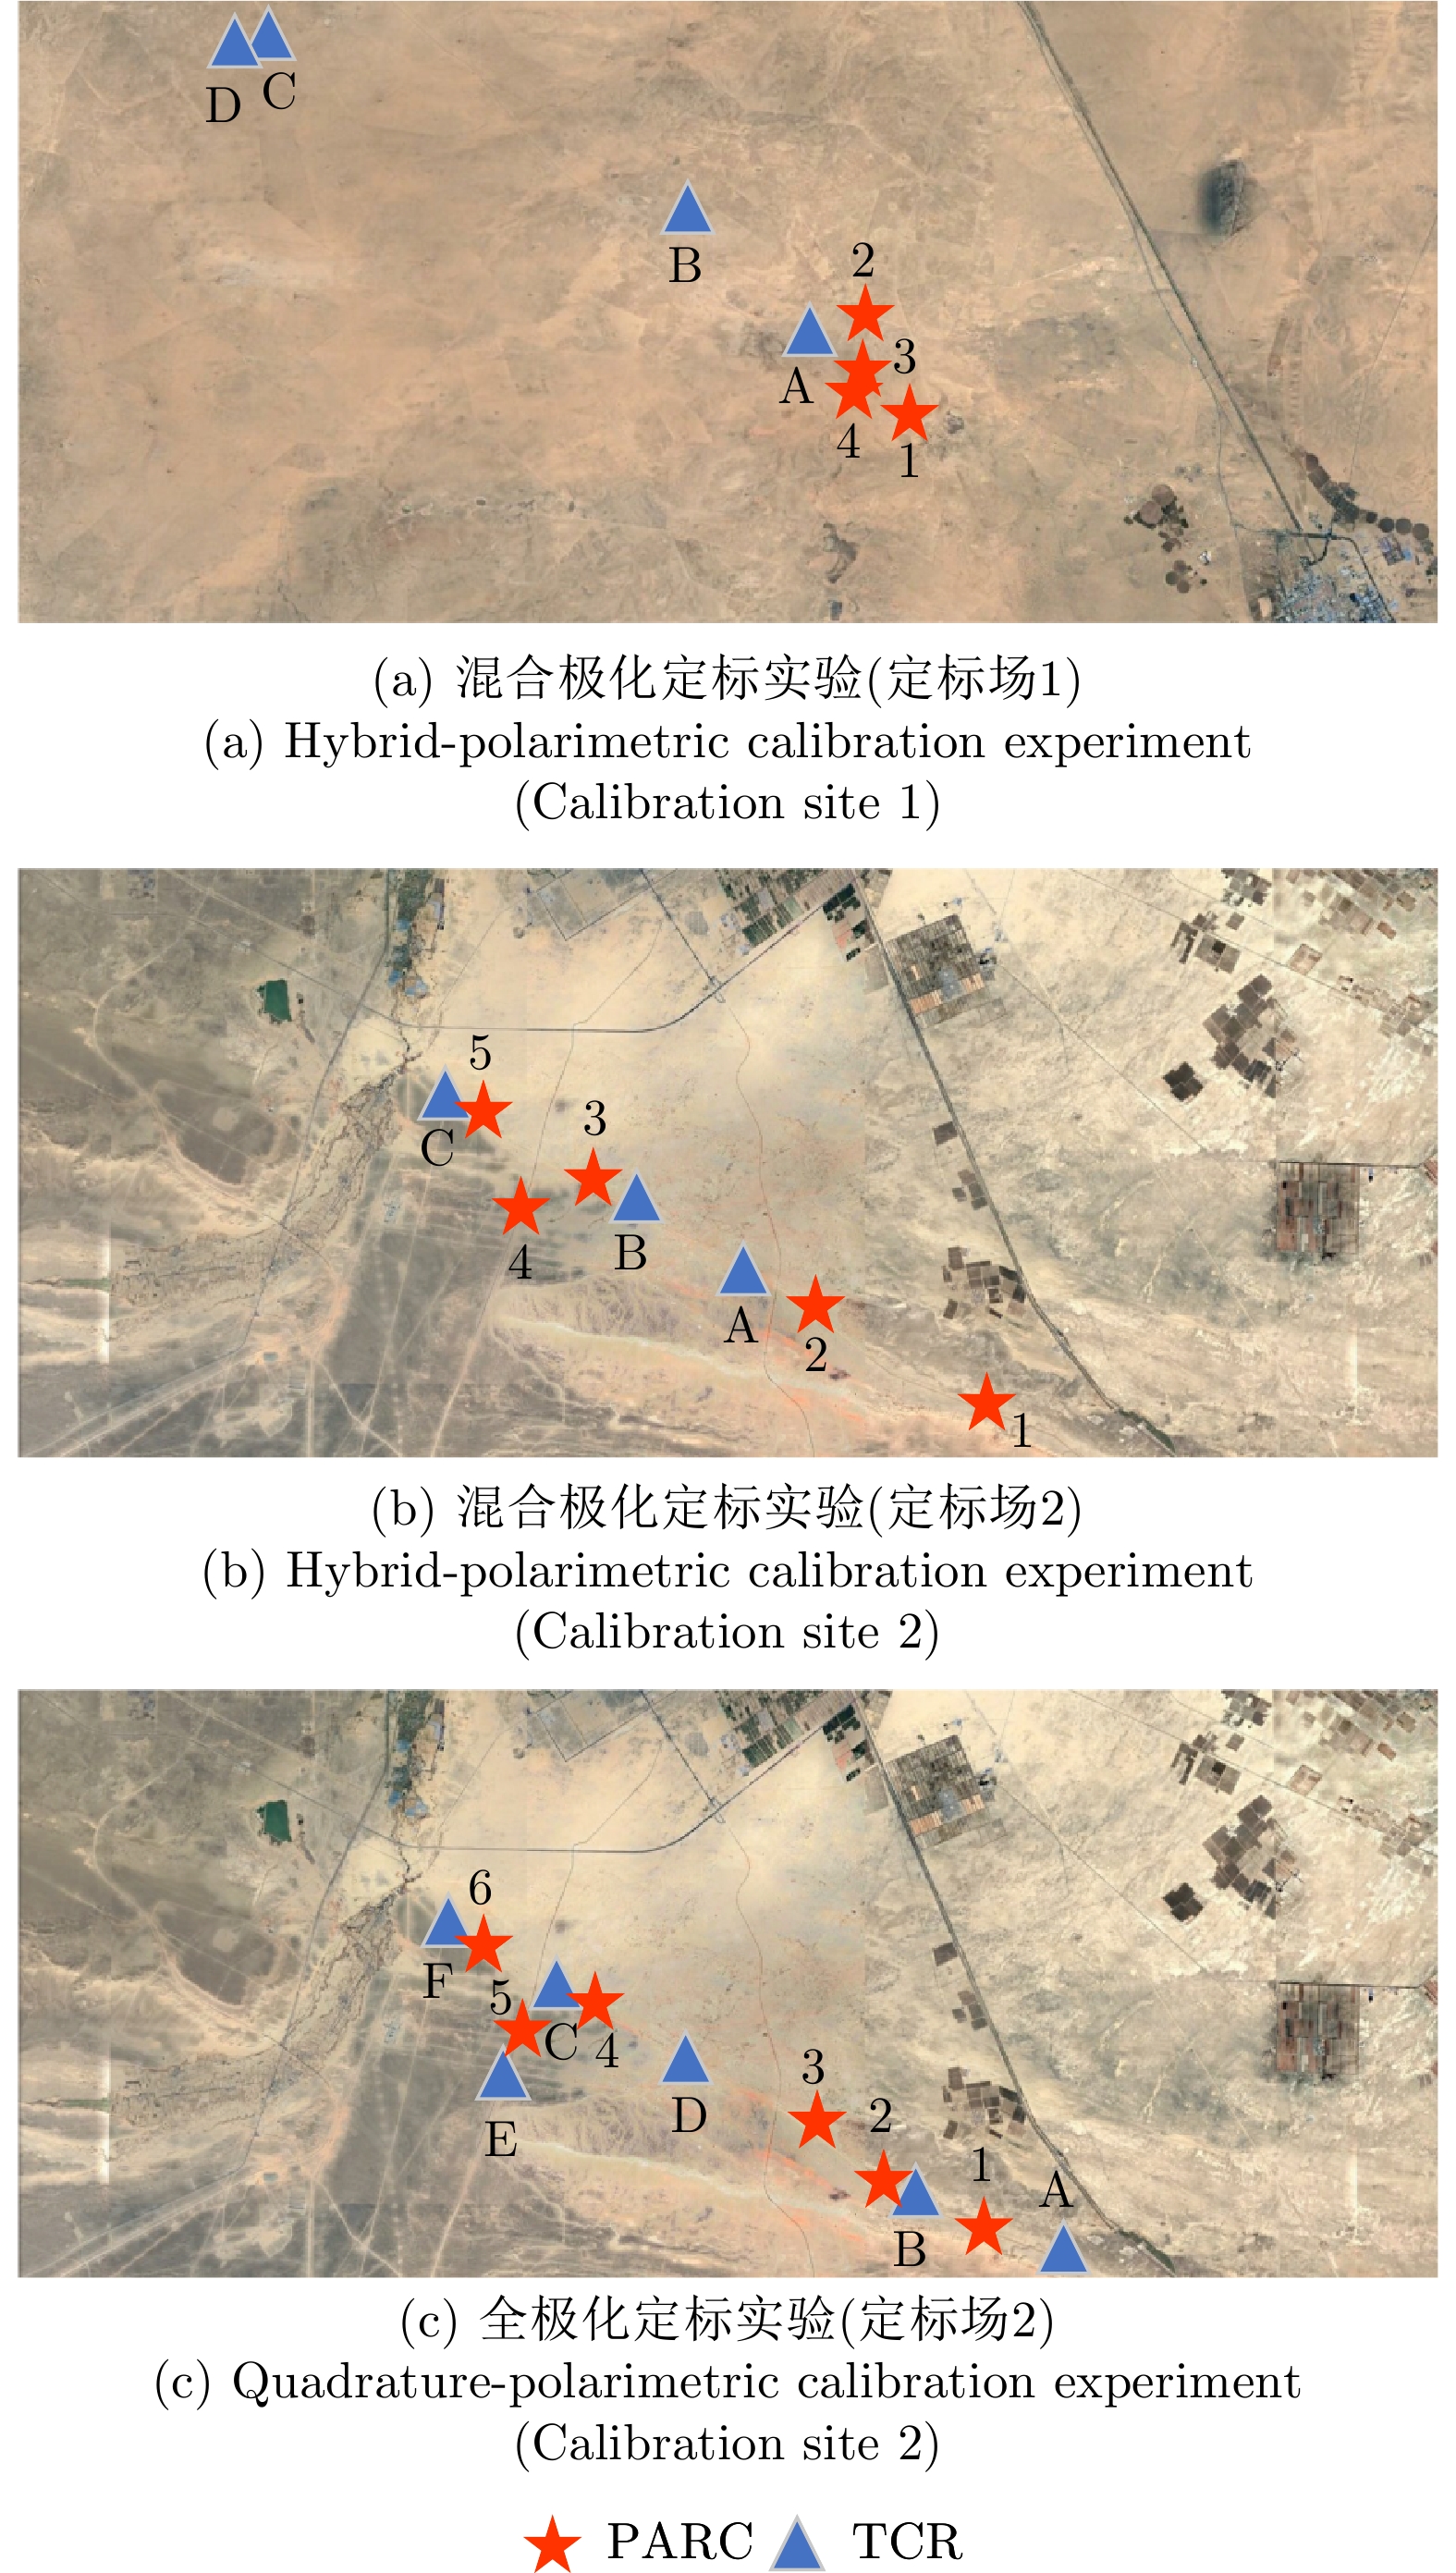
表 5 定标场布设定标器位置
Table 5. Deployment locations of calibrators at calibration sites
定标场 极化 定标器类型 定标器编号 经度(°) 纬度(°) 高程(m) 定标场1 混合极化 PARC 1 112.4448 42.8177 1049.84 2 112.4322 42.8390 1037.40 3 112.4291 42.8274 1037.40 4 112.4268 42.8228 1040.14 TCR A 112.425079 42.8372029 1037.029 B 112.318830 42.8940020 1056.571 C 112.124712 42.9637972 1094.185 D 112.111615 42.9620900 1097.009 定标场2 混合极化 PARC 1 93.6995 42.5322 599.65 2 93.6307 42.5599 577.55 3 93.5513 42.5934 551.78 4 93.5135 42.5893 531.64 5 93.4980 42.6146 547.43 TCR A 93.606651 42.571443 563.718 B 93.558919 42.590167 553.300 C 93.485667 42.619367 547.176 全极化 PARC 1 93.6995 42.5322 599.65 2 93.6603 42.5431 591.49 3 93.6307 42.5599 577.55 4 93.5513 42.5934 551.78 5 93.5135 42.5893 531.64 6 93.4980 42.6146 547.43 TCR A 93.722534 42.526064 602.463 B 93.666109 42.541277 591.797 C 93.581795 42.581258 545.655 D 93.533604 42.600272 551.900 E 93.507202 42.575653 522.567 F 93.485667 42.619367 547.176
下载: 导出CSV
表 6 PARC散射矩阵
Table 6. The scattering matrix of PARC
定标场 极化模式 1 2 3 4 5 6 定标场1 混合极化 $\left[ {\begin{array}{*{20}{c}} 1&{ - 1} \\ { - 1}&1 \end{array}} \right]$ $\left[ {\begin{array}{*{20}{c}} 0&0 \\ 1&0 \end{array}} \right]$ $\left[ {\begin{array}{*{20}{c}} 1&1 \\ { - 1}&{ - 1} \end{array}} \right]$ $\left[ {\begin{array}{*{20}{c}} 0&1 \\ 0&0 \end{array}} \right]$ - - 定标场2 混合极化 $\left[ {\begin{array}{*{20}{c}} 0&1 \\ 0&0 \end{array}} \right]$ $\left[ {\begin{array}{*{20}{c}} 0&0 \\ 1&0 \end{array}} \right]$ $\left[ {\begin{array}{*{20}{c}} 0&0 \\ 0&1 \end{array}} \right]$ $\left[ {\begin{array}{*{20}{c}} 1&{ - 1} \\ 1&{ - 1} \end{array}} \right]$ $\left[ {\begin{array}{*{20}{c}} 1&0 \\ 0&0 \end{array}} \right]$ - 全极化 $\left[ {\begin{array}{*{20}{c}} 0&0 \\ 1&0 \end{array}} \right]$ $\left[ {\begin{array}{*{20}{c}} 1&{ - 1} \\ 1&{ - 1} \end{array}} \right]$ $\left[ {\begin{array}{*{20}{c}} 0&1 \\ 0&0 \end{array}} \right]$ $\left[ {\begin{array}{*{20}{c}} 0&1 \\ 0&0 \end{array}} \right]$ $\left[ {\begin{array}{*{20}{c}} 1&1 \\ 1&1 \end{array}} \right]$ $\left[ {\begin{array}{*{20}{c}} 0&0 \\ 1&0 \end{array}} \right]$
下载: 导出CSV
表 7 解耦的极化系统失真参数
Table 7. Decoupled polarimetric system distortion parameters
极化失真参数 LT-1A HP模式 LT-1B HP模式 $ {f_{\text{r}}} $ 1.071E0 ∠−1.168E−2 rad 9.605E−1 ∠2.785E−2 rad $ {\delta _1} $ 2.544E−2 ∠−3.005E0 rad 8.259E−2 ∠−3.097E0 rad $ {\delta _2} $ 3.145E−2 ∠−1.237E−1 rad 9.007E−2 ∠−3.005E−2 rad $ {\delta _c} $ 6.593E−3 ∠2.914E−1 rad 3.153E−3 ∠2.833E0 rad
下载: 导出CSV
表 8 数据集分类精度对比(%)
Table 8. Classification accuracy comparison of the dataset (%)
数据类型 荒漠草原 裸土 耕地 城区 温室 OA PA UA PA UA PA UA PA UA PA UA QP 100.00 99.96 99.40 99.86 97.63 94.60 88.41 92.83 91.91 90.11 95.47 HP 99.94 99.53 99.19 99.70 96.88 88.01 77.90 84.20 76.66 78.61 90.11
下载: 导出CSV
-
[1] RANEY R K, FREEMAN A, and JORDAN R L. Improved range ambiguity performance in quad-pol SAR[J]. IEEE Transactions on Geoscience and Remote Sensing, 2012, 50(2): 349–356. doi: 10.1109/TGRS.2011.2121075. [2] ZHANG Linlin, GAO Gui, CHEN Chao, et al. Compact polarimetric synthetic aperture radar for target detection: A review[J]. IEEE Geoscience and Remote Sensing Magazine, 2022, 10(3): 115–152. doi: 10.1109/MGRS.2022.3186904. [3] DASARI K and LOKAM A. Exploring the capability of compact polarimetry (hybrid pol) C band RISAT-1 data for land cover classification[J]. IEEE Access, 2018, 6: 57981–57993. doi: 10.1109/ACCESS.2018.2873348. [4] SINGHA S and RESSEL R. Arctic sea ice characterization using RISAT-1 compact-pol SAR imagery and feature evaluation: A case study over northeast greenland[J]. IEEE Journal of Selected Topics in Applied Earth Observations and Remote Sensing, 2017, 10(8): 3504–3514. doi: 10.1109/JSTARS.2017.2691258. [5] KROUPNIK G, DE LISLE D, CÔTÉ S, et al. RADARSAT constellation mission overview and status[C]. 2021 IEEE Radar Conference (RadarConf21), Atlanta, USA, 2021: 1–5. doi: 10.1109/RadarConf2147009.2021.9455298. [6] JAFARZADEH H, MAHDIANPARI M, VERMA A, et al. Crop discrimination and mapping using multi-temporal RCM compact polarimetry SAR data[C]. 2023 IEEE International Geoscience and Remote Sensing Symposium, Pasadena, USA, 2023: 8046–8049. doi: 10.1109/IGARSS52108.2023.10282545. [7] BRISCO B, MAHDIANPARI M, and MOHAMMADIMANESH F. Hybrid compact polarimetric SAR for environmental monitoring with the RADARSAT constellation mission[J]. Remote Sensing, 2020, 12(20): 3283. doi: 10.3390/rs12203283. [8] MOTOHKA T, KANKAKU Y, MIURA S, et al. Overview of ALOS-2 and ALOS-4 L-band SAR[C]. 2021 IEEE Radar Conference (RadarConf21), Atlanta, USA, 2021: 1–4. doi: 10.1109/RadarConf2147009.2021.9454977. [9] RANEY R K, SPUDIS P D, BUSSEY B, et al. The lunar mini-RF radars: Hybrid polarimetric architecture and initial results[J]. Proceedings of the IEEE, 2011, 99(5): 808–823. doi: 10.1109/JPROC.2010.2084970. [10] BHIRAVARASU S S, CHAKRABORTY T, PUTREVU D, et al. Chandrayaan-2 dual-frequency synthetic aperture radar (DFSAR): Performance characterization and initial results[J]. The Planetary Science Journal, 2021, 2(4): 134. doi: 10.3847/PSJ/abfdbf. [11] National Aeronautics and Space Administration. SIR-C Education Program Pre-Launch CD-ROM[M/CD]. Pasadena: JPL, 1994. [12] WEST R D, HENRIKSEN A, STEINBACH E, et al. High-resolution fully-polarimetric synthetic aperture radar dataset[J]. Discover Geoscience, 2024, 2(1): 83. doi: 10.1007/s44288-024-00090-6. [13] ALKHATIB M Q. PolSAR image classification using complex-valued multiscale attention vision transformer (CV-MsAtViT)[J]. International Journal of Applied Earth Observation and Geoinformation, 2025, 137: 104412. doi: 10.1016/j.jag.2025.104412. [14] HOCHSTUHL S, PFEFFER N, THIELE A, et al. Pol-InSAR-Island - A benchmark dataset for multi-frequency Pol-InSAR data land cover classification[J]. ISPRS Open Journal of Photogrammetry and Remote Sensing, 2023, 10: 100047. doi: 10.1016/j.ophoto.2023.100047. [15] LIU Xu, JIAO Licheng, LIU Fang, et al. PolSF: PolSAR image datasets on San Francisco[C]. The 5th IFIP TC 12 International Conference on Intelligence Science IV, Xi’an, China, 2022: 214–219. doi: 10.1007/978-3-031-14903-0_23. [16] 王智睿, 赵良瑾, 汪越雷, 等. AIR-PolSAR-Seg-2.0: 大规模复杂场景极化SAR地物分类数据集[J]. 雷达学报(中英文), 2025, 14(2): 353–365. doi: 10.12000/JR24237.WANG Zhirui, ZHAO Liangjin, WANG Yuelei, et al. AIR-PolSAR-Seg-2.0: Polarimetric SAR ground terrain classification dataset for large-scale complex scenes[J]. Journal of Radars, 2025, 14(2): 353–365. doi: 10.12000/JR24237. [17] WANG Zhirui, ZENG Xuan, YAN Zhiyuan, et al. AIR-PolSAR-Seg: A large-scale data set for terrain segmentation in complex-scene PolSAR images[J]. IEEE Journal of Selected Topics in Applied Earth Observations and Remote Sensing, 2022, 15: 3830–3841. doi: 10.1109/JSTARS.2022.3170326. [18] 金燕, 仇晓兰, 潘洁, 等. MPOLSAR-1.0: 多维度SAR多波段全极化精细分类数据集[J]. 雷达学报(中英文), 2024, 13(3): 525–538. doi: 10.12000/JR24002.JIN Yan, QIU Xiaolan, PAN Jie, et al. MPOLSAR-1.0: Multidimensional SAR multiband fully polarized fine classification dataset[J]. Journal of Radars, 2024, 13(3): 525–538. doi: 10.12000/JR24002. [19] VAN WYCHEN W, BAYER C, COPLAND L, et al. Radarsat constellation mission derived winter glacier velocities for the St. Elias Icefield, Yukon/Alaska: 2022 and 2023[J]. Canadian Journal of Remote Sensing, 2023, 49(1): 2264395. doi: 10.1080/07038992.2023.2264395. [20] KUMAR V, RAO Y S, BHATTACHARYA A, et al. Classification assessment of real versus simulated compact and quad-pol modes of ALOS-2[J]. IEEE Geoscience and Remote Sensing Letters, 2019, 16(9): 1497–1501. doi: 10.1109/LGRS.2019.2899268. [21] ZHAO Yu and BAN Yifang. RADARSAT constellation mission compact polarisation SAR data for burned area mapping with deep learning[J]. International Journal of Applied Earth Observation and Geoinformation, 2025, 141: 104615. doi: 10.1016/j.jag.2025.104615. [22] TRUONG-LOÏ M L, DUBOIS-FERNANDEZ P, POTTIER E, et al. Potentials of a compact polarimetric SAR system[C]. 2010 IEEE International Geoscience and Remote Sensing Symposium, Honolulu, USA, 2010: 742–745. doi: 10.1109/IGARSS.2010.5649036. [23] CHEN Jie and QUEGAN S. Calibration of spaceborne CTLR compact polarimetric low-frequency SAR using mixed radar calibrators[J]. IEEE Transactions on Geoscience and Remote Sensing, 2011, 49(7): 2712–2723. doi: 10.1109/TGRS.2011.2109065. [24] HOU Wentao, ZHAO Fengjun, LIU Xiuqing, et al. Hybrid compact polarimetric SAR calibration considering the amplitude and phase coefficients inconsistency[J]. Remote Sensing, 2022, 14(2): 416. doi: 10.3390/rs14020416. [25] TAN Hong and HONG Jun. Calibration of compact polarimetric SAR images using distributed targets and one corner reflector[J]. IEEE Transactions on Geoscience and Remote Sensing, 2016, 54(8): 4433–4444. doi: 10.1109/TGRS.2016.2541666. [26] OLTHOF I and RAINVILLE T. Evaluating simulated RADARSAT Constellation Mission (RCM) compact polarimetry for open-water and flooded-vegetation wetland mapping[J]. Remote Sensing, 2020, 12(9): 1476. doi: 10.3390/rs12091476. [27] DEY S, BHATTACHARYA A, RATHA D, et al. Novel clustering schemes for full and compact polarimetric SAR data: An application for rice phenology characterization[J]. ISPRS Journal of Photogrammetry and Remote Sensing, 2020, 169: 135–151. doi: 10.1016/j.isprsjprs.2020.09.010. [28] GAO Gui, GAO Sheng, HE Juan, et al. Adaptive ship detection in hybrid-polarimetric SAR images based on the power-entropy decomposition[J]. IEEE Transactions on Geoscience and Remote Sensing, 2018, 56(9): 5394–5407. doi: 10.1109/TGRS.2018.2815592. [29] BUONO A, NUNZIATA F, MIGLIACCIO M, et al. Polarimetric analysis of compact-polarimetry SAR architectures for sea oil slick observation[J]. IEEE Transactions on Geoscience and Remote Sensing, 2016, 54(10): 5862–5874. doi: 10.1109/TGRS.2016.2574561. [30] SPUDIS P D, BUSSEY D B J, BALOGA S M, et al. Evidence for water ice on the Moon: Results for anomalous polar craters from the LRO Mini-RF imaging radar[J]. Journal of Geophysical Research: Planets, 2013, 118(10): 2016–2029. doi: 10.1002/jgre.20156. [31] 洪文. 基于混合极化架构的极化SAR: 原理与应用(中英文)[J]. 雷达学报, 2016, 5(6): 559–595. doi: 10.12000/JR16074.HONG Wen. Hybrid-polarity architecture based polarimetric SAR: Principles and applications[J]. Journal of Radars, 2016, 5(6): 559–595. doi: 10.12000/JR16074. [32] WANG R, LIU Kaiyu, LIU Dacheng, et al. LuTan-1: An innovative L-band spaceborne bistatic interferometric synthetic aperture radar mission[J]. IEEE Geoscience and Remote Sensing Magazine, 2025, 13(2): 58–78. doi: 10.1109/MGRS.2024.3478761. [33] 史磊, 孙维东, 杨乐, 等. LT-1A卫星全极化SAR辐射与极化系统误差稳定性分析: 以热带雨林场景为例[J]. 雷达学报(中英文), 2025, 14(2): 405–423. doi: 10.12000/JR24102.SHI Lei, SUN Weidong, YANG Le, et al. Evaluation of radiometric and polarimetric errors in the LT-1A satellite data based on tropical forests in the amazon[J]. Journal of Radars, 2025, 14(2): 405–423. doi: 10.12000/JR24102. [34] XIAO Long, WANG Jiang, DANG Yanan, et al. A new terrestrial analogue site for Mars research: The Qaidam Basin, Tibetan Plateau (NW China)[J]. Earth-Science Reviews, 2017, 164: 84–101. doi: 10.1016/j.earscirev.2016.11.003. [35] BICKEL S H and BATES R H T. Effects of magneto-ionic propagation on the polarization scattering matrix[J]. Proceedings of the IEEE, 1965, 53(8): 1089–1091. doi: 10.1109/PROC.1965.4097. [36] FREEMAN A. A new system model for radar polarimeters[J]. IEEE Transactions on Geoscience and Remote Sensing, 1991, 29(5): 761–767. doi: 10.1109/36.83991. [37] LIU Lizhi, HUANG Lijie, WANG Yidi, et al. An advanced decoupled polarimetric calibration method for the LuTan-1 hybrid- and quadrature-polarimetric modes[J]. ISPRS Journal of Photogrammetry and Remote Sensing, 2026, 233: 310–327. doi: 10.1016/j.isprsjprs.2026.01.035. [38] RANEY R K. Hybrid dual-polarization synthetic aperture radar[J]. Remote Sensing, 2019, 11(13): 1521. doi: 10.3390/rs11131521. [39] LI Yu, LIN Hui, ZHANG Yuanzhi, et al. Comparisons of circular transmit and linear receive compact polarimetric SAR features for oil slicks discrimination[J]. Journal of Sensors, 2015, 2015: 631561. doi: 10.1155/2015/631561. [40] DABBOOR M and GELDSETZER T. Towards sea ice classification using simulated RADARSAT Constellation Mission compact polarimetric SAR imagery[J]. Remote Sensing of Environment, 2014, 140: 189–195. doi: 10.1016/j.rse.2013.08.035. [41] LIU Lizhi, LU Pingping, XING Cheng, et al. LuTan-1: First demonstration of hybrid-polarimetric synthetic aperture radar-assessing application potentials and performance constraints[J]. Journal of Remote Sensing, 2026, 6: 1025. doi: 10.34133/remotesensing.1025. [42] TEN KATE I L, ARMSTRONG R, BERNHARDT B, et al. Mauna Kea, Hawaii, as an analog site for future planetary resource exploration: Results from the 2010 ILSO-ISRU field-testing campaign[J]. Journal of Aerospace Engineering, 2013, 26(1): 183–196. doi: 10.1061/(ASCE)AS.1943-5525.0000200. [43] DANG Yanan, XIAO Long, XU Yi, et al. The polygonal surface structures in the Dalangtan Playa, Qaidam Basin, NW China: Controlling factors for their formation and implications for analogous martian landforms[J]. Journal of Geophysical Research: Planets, 2018, 123(7): 1910–1933. doi: 10.1029/2018JE005525. [44] LASSER J, NIELD J M, ERNST M, et al. Salt polygons and porous media convection[J]. Physical Review X, 2023, 13(1): 011025. doi: 10.1103/PhysRevX.13.011025. -


计量
- 文章访问数:
- HTML全文浏览量:
- PDF下载量:
- 被引次数: 0

