
 Submit Manuscript
 Peer Review
 Editor Work
- Home
- Articles & Issues
-
Data
- Dataset of Radar Detecting Sea
- SAR Dataset
- SARGroundObjectsTypes
- SARMV3D
- AIRSAT Constellation SAR Land Cover Classification Dataset
- 3DRIED
- UWB-HA4D
- LLS-LFMCWR
- FAIR-CSAR
- MSAR
- SDD-SAR
- FUSAR
- SpaceborneSAR3Dimaging
- Sea-land Segmentation
- SAR Multi-domain Ship Detection Dataset
- SAR-Airport
- Hilly and mountainous farmland time-series SAR and ground quadrat dataset
- SAR images for interference detection and suppression
- HP-SAR Evaluation & Analytical Dataset
- GDHuiYan-ATRNet
- Multi-System Maritime Low Observable Target Dataset
- DatasetinthePaper
- DatasetintheCompetition
- Report
- Course
- About
- Publish
- Editorial Board
- Chinese
| Citation: | ZHENG Xuezhao, DING Wen, HUANG Yuan, et al. A review of UWB radar detection of respiration and heartbeat signals in different scenarios[J]. Journal of Radars, 2025, 14(1): 204–228. doi: 10.12000/JR24154

|
A Review of UWB Radar Detection of Respiration and Heartbeat Signals in Different Scenarios
DOI: 10.12000/JR24154 CSTR: 32380.14.JR24154
More Information-
Abstract
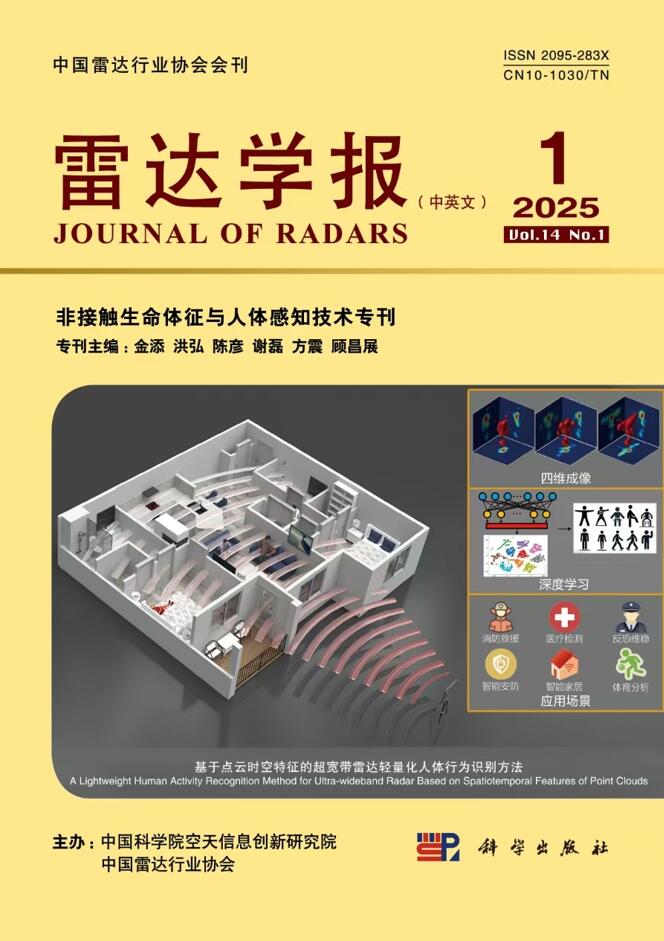
Due to their many advantages, such as simple structure, low transmission power, strong penetration capability, high resolution, and high transmission speed, UWB (Ultra-WideBand) radars have been widely used for detecting life information in various scenarios. To effectively detect life information, the key is to use radar echo information-processing technology to extract the breathing and heartbeat signals of the involved person from UWB radar echoes. This technology is crucial for determining life information in different scenarios, such as obtaining location information, monitoring and preventing diseases, and ensuring personnel safety. Therefore, this paper introduces a UWB radar and its classification, electromagnetic scattering mechanisms, and detection principles. It also analyzes the current state of radar echo model construction for breathing and heartbeat signals. The paper then reviews existing methods for extracting breathing and heartbeat signals, including time domain, frequency domain, and time-frequency domain analysis methods. Finally, it summarizes research progress in breathing and heartbeat signal extraction in various scenarios, such as mine rescue, earthquake rescue, medical health, and through-wall detection, as well as the main problems in current research and focus areas for future research. -

-
References
[1] 刘新, 阎焜, 杨光耀, 等. UWB-MIMO穿墙雷达三维成像与运动补偿算法研究[J]. 电子与信息学报, 2020, 42(9): 2253–2260. doi: 10.11999/JEIT190356.LIU Xin, YAN Kun, YANG Guangyao, et al. Study on 3D imaging and motion compensation algorithm for UWB-MIMO through-wall radar[J]. Journal of Electronics & Information Technology, 2020, 42(9): 2253–2260. doi: 10.11999/JEIT190356.[2] 罗朋, 胡振峰, 田世伟, 等. UWB雷达芯片的研究现状与发展[J]. 电子与信息学报, 2022, 44(4): 1176–1192. doi: 10.11999/JEIT211082.LUO Peng, HU Zhenfeng, TIAN Shiwei, et al. The status and trends of UWB radar integrated circuit[J]. Journal of Electronics & Information Technology, 2022, 44(4): 1176–1192. doi: 10.11999/JEIT211082.[3] 郑学召, 丁文, 蔡国斌, 等. 面向钻孔救援的UWB雷达回波信息处理关键问题研究进展[J]. 煤矿安全, 2023, 54(10): 219–225. doi: 10.13347/j.cnki.mkaq.2023.10.030.ZHENG Xuezhao, DING Wen, CAI Guobin, et al. Research progress on key issues of UWB radar echo information processing for borehole rescue[J]. Safety in Coal Mines, 2023, 54(10): 219–225. doi: 10.13347/j.cnki.mkaq.2023.10.030.[4] 肖明国, 张彪, 康玉国, 等. 面向钻孔救援的UWB雷达探测技术研究进展[J]. 煤炭技术, 2024, 43(6): 174–177. doi: 10.13301/j.cnki.ct.2024.06.036.XIAO Mingguo, ZHANG Biao, KANG Yuguo, et al. Research progress of UWB radar detection technology for drilling rescue[J]. Coal Technology, 2024, 43(6): 174–177. doi: 10.13301/j.cnki.ct.2024.06.036.[5] 文虎, 刘盛铠, 郑学召, 等. 基于钻孔救援的UWB雷达波传输衰减研究及展望[J]. 工矿自动化, 2023, 49(4): 42–49. doi: 10.13272/j.issn.1671-251x.18053.WEN Hu, LIU Shengkai, ZHENG Xuezhao, et al. Research and prospect of UWB radar wave transmission attenuation based on borehole rescue[J]. Journal of Mine Automation, 2023, 49(4): 42–49. doi: 10.13272/j.issn.1671-251x.18053.[6] 敬芳菲. 基于超宽带雷达的生命体征提取技术研究[D]. [硕士论文], 电子科技大学, 2022. doi: 10.27005/d.cnki.gdzku.2022.002229.JING Fangfei. Vital signs extraction technology based on UWB radar[D]. [Master dissertation], University of Electronic Science and Technology of China, 2022. doi: 10.27005/d.cnki.gdzku.2022.002229.[7] QU Xiaodong, GAO Weicheng, MENG Haoyu, et al. Indoor human behavior recognition method based on wavelet scattering network and conditional random field model[J]. IEEE Transactions on Geoscience and Remote Sensing, 2023, 61: 5104815. doi: 10.1109/tgrs.2023.3276023.[8] 屈乐乐, 刘淑杰, 杨天虹, 等. 基于多通道的调频连续波雷达生命信号提取[J]. 电子与信息学报, 2022, 44(4): 1318–1326. doi: 10.11999/JEIT211073.QU Lele, LIU Shujie, YANG Tianhong, et al. Life signal extraction based on multi-channel frequency modulated continuous wave radar[J]. Journal of Electronics & Information Technology, 2022, 44(4): 1318–1326. doi: 10.11999/JEIT211073.[9] 马铖. 面向低信噪杂比环境的随机信号雷达生命探测方法研究[D]. [硕士论文], 太原理工大学, 2022. doi: 10.27352/d.cnki.gylgu.2022.000168.MA Cheng. Research on life detection method of random signal radar in low signal to noise and clutter ratio environment[D]. [Master dissertation], Taiyuan University of Technology, 2022. doi: 10.27352/d.cnki.gylgu.2022.000168.[10] CHUNG S W, SHIH C C, and HUANG C C. Freehand three-dimensional ultrasound imaging of carotid artery using motion tracking technology[J]. Ultrasonics, 2017, 74: 11–20. doi: 10.1016/j.ultras.2016.09.020.[11] TSANG T K K and EL-GAMAL M N. Ultra-wideband (UWB) communications systems: An overview[C]. The 3rd International IEEE-NEWCAS Conference, Quebec, Canada, 2005: 381–386. doi: 10.1109/NEWCAS.2005.1496688.[12] 赵尤信, 姚海飞, 李佳慧, 等. 超宽带雷达生命探测技术研究[J]. 工矿自动化, 2023, 49(9): 178–186. doi: 10.13272/j.issn.1671-251x.18111.ZHAO Youxin, YAO Haifei, LI Jiahui, et al. Research on ultra wideband radar life detection technology[J]. Journal of Mine Automation, 2023, 49(9): 178–186. doi: 10.13272/j.issn.1671-251x.18111.[13] CHEN Xiaomin and KIAEI S. Monocycle shapes for ultra wideband system[C]. 2002 IEEE International Symposium on Circuits and Systems, Phoenix-Scottsdale, USA, 2002: 1. doi: 10.1109/ISCAS.2002.1009911.[14] LOPES A, OSÓRIO D F N, SILVA H, et al. Equivalent pipeline processing for IR-UWB and FMCW radar comparison in vital signs monitoring applications[J]. IEEE Sensors Journal, 2022, 22(12): 12028–12035. doi: 10.1109/jsen.2022.3173218.[15] 邢孟道, 谢意远, 高悦欣, 等. 电磁散射特征提取与成像识别算法综述[J]. 雷达学报, 2022, 11(6): 921–942. doi: 10.12000/JR22232.XING Mengdao, XIE Yiyuan, GAO Yuexin, et al. Electromagnetic scattering characteristic extraction and imaging recognition algorithm: A review[J]. Journal of Radars, 2022, 11(6): 921–942. doi: 10.12000/JR22232.[16] HUANG Peng, HAI Yu, LI Zhongyu, et al. UWB-radar target scattering characteristic estimation method using joint Low-Rank and sparse characteristic[C]. IGARSS 2023–2023 IEEE International Geoscience and Remote Sensing Symposium, Pasadena, USA, 2023: 6037–6040. doi: 10.1109/IGARSS52108.2023.10282414.[17] RICHARDS M A. Fundamentals of Radar Signal Processing[M]. 2nd ed. Chicago: McGraw-Hill Education, 2014: 71–75.[18] GAO Xiaomeng, JIANG Xiaonan, BI Songjie, et al. Measurement of the complex human Atrial-Ventricular motions using Contact-Based Doppler radar[C]. 2019 IEEE 20th Wireless and Microwave Technology Conference (WAMICON), Cocoa Beach, USA, 2019: 1–5. doi: 10.1109/WAMICON.2019.8765441.[19] 丁鹭飞, 耿富录. 雷达原理[M]. 3版. 西安: 西安电子科技大学出版社, 2019: 235–239.DING Lufei and GENG Fulu. Principle of Radar[M]. 3rd ed. Xi’an: Xidian University Press, 2019: 235–239.[20] 漆晶, 汪正东, 谢广智. 基于胸腔信号样本的FMCW雷达身份验证[J]. 雷达科学与技术, 2023, 21(5): 539–546, 554. doi: 10.3969/j.issn.1672-2337.2023.05.010.QI Jing, WANG Zhengdong, and XIE Guangzhi. FMCW radar authentication based on chest cavity signal samples[J]. Radar Science and Technology, 2023, 21(5): 539–546, 554. doi: 10.3969/j.issn.1672-2337.2023.05.010.[21] LI Zhi, JIN Tian, DAI Yongpeng, et al. Through-wall multi-subject localization and vital signs monitoring using UWB MIMO imaging radar[J]. Remote Sensing, 2021, 13(15): 2905. doi: 10.3390/rs13152905.[22] LIU Fan, ZHANG Tingting, and CAO Pan. Asynchronous integration of communication and localization systems using IR-UWB signals[C]. 2021 IEEE Military Communications Conference, San Diego, USA, 2021: 521–527. doi: 10.1109/MILCOM52596.2021.9652951.[23] 张崇超, 张长春, 张群英. EEMD在超宽带雷达生命信号提取中的应用[J]. 电子测量技术, 2012, 35(4): 76–80, 101. doi: 10.19651/j.cnki.emt.2012.04.019.ZHANG Chongchao, ZHANG Changchun, and ZHANG Qunying. Applications of EEMD in vital signal detection for UWB radar[J]. Electronic Measurement Technology, 2012, 35(4): 76–80, 101. doi: 10.19651/j.cnki.emt.2012.04.019.[24] WANG Jun, ZHU He, LEI Peng, et al. CNN based classification of rigid targets in space using radar micro-Doppler signatures[J]. Chinese Journal of Electronics, 2019, 28(4): 856–862. doi: 10.1049/cje.2018.08.003.[25] 刘翼群. 生命探测雷达信号处理算法研究[D]. [硕士论文], 西安电子科技大学, 2019.LIU Yiqun. Research on signal processing algorithm of life detection radar[D]. [Master dissertation], Xidian University, 2019.[26] PATERNIANI G, SGRECCIA D, DAVOLI A, et al. Radar-based monitoring of vital signs: A tutorial overview[J]. Proceedings of the IEEE, 2023, 111(3): 277–317. doi: 10.1109/jproc.2023.3244362.[27] LI Zongwei, PEI Yanbin, WANG Yuqi, et al. An enhanced respiratory mechanics model based on double-exponential and fractional calculus[J]. Frontiers in Physiology, 2023, 14: 1273645. doi: 10.3389/fphys.2023.1273645.[28] 高晓阳. 生命探测雷达目标辨识算法研究[D]. [硕士论文], 西安电子科技大学, 2021.GAO Xiaoyang. Research on target recognition algorithm of life detection radar[D]. [Master dissertation], Xidian University, 2021.[29] LAZARO A, GIRBAU D, and VILLARINO R. Analysis of vital signs monitoring using an IR-UWB radar[J]. Progress in Electromagnetics Research, 2010, 100: 265–284. doi: 10.2528/pier09120302.[30] SHYU K K, CHIU L J, LEE P L, et al. Detection of breathing and heart rates in UWB radar sensor data using FVPIEF-based two-layer EEMD[J]. IEEE Sensors Journal, 2019, 19(2): 774–784. doi: 10.1109/jsen.2018.2878607.[31] 吴佳茜, 梁步阁, 杨德贵, 等. 引入时距信息的IR-UWB雷达多域特征融合呼吸模式识别方法[J]. 信号处理, 2024, 40(2): 236–249. doi: 10.16798/j.issn.1003-0530.2024.02.002.WU Jiaxi, LIANG Buge, YANG Degui, et al. IR-UWB radar multi-domain feature fusion respiratory pattern recognition method with time-distance information[J]. Journal of Signal Processing, 2024, 40(2): 236–249. doi: 10.16798/j.issn.1003-0530.2024.02.002.[32] 郭继坤, 王保生, 郝维来, 等. 基于超宽带信号的矿井塌方体下生命特征的检测方法[J]. 黑龙江科技大学学报, 2017, 27(1): 73–76, 96. doi: 10.3969/j.issn.2095-7262.2017.01.016.GUO Jikun, WANG Baosheng, HAO Weilai, et al. Research on detection method of life under mine based on ultra-wideband signal[J]. Journal of Heilongjiang University of Science & Technology, 2017, 27(1): 73–76, 96. doi: 10.3969/j.issn.2095-7262.2017.01.016.[33] HUO Ze, ZHANG Zhaoxia, YIN Yonggen, et al. Research on multitarget vital sign detection using IR-UWB radar in occlusion scenarios[J]. IEEE Sensors Journal, 2024, 24(9): 15327–15336. doi: 10.1109/jsen.2024.3380831.[34] HUANG Ling, WANG Zhao, TIAN Ming, et al. Influence of Parameters on Radar Localization of Human Target under Complex Shielding Environment[M]. KIM K J and KIM H Y. Information Science and Applications. Singapore: Springer, 2020: 3–9. doi: 10.1007/978-981-15-1465-4_1.[35] YANG Degui, ZHU Zhengliang, ZHANG Junchao, et al. The overview of human localization and vital sign signal measurement using handheld IR-UWB through-wall radar[J]. Sensors, 2021, 21(2): 402. doi: 10.3390/s21020402.[36] SHYU K K, CHIU L J, LEE P L, et al. UWB simultaneous breathing and heart rate detections in driving scenario using multi-feature alignment two-layer EEMD method[J]. IEEE Sensors Journal, 2020, 20(17): 10251–10266. doi: 10.1109/jsen.2020.2992687.[37] 杨国成, 余慧敏. 基于N次峰值捕捉的超宽带雷达生命体征检测[J]. 电子测量与仪器学报, 2020, 34(11): 204–210. doi: 10.13382/j.jemi.B2003126.YANG Guocheng and YU Huimin. Vital sign detection of ultra-wideband radar based on N peaks capture[J]. Journal of Electronic Measurement and Instrumentation, 2020, 34(11): 204–210. doi: 10.13382/j.jemi.B2003126.[38] JING Fangfei, LIANG Jing, WANG Yizhu, et al. Harmonics and intermodulation products-based fuzzy logic (HIPBFL) algorithm for vital sign frequency estimation using a UWB radar[J]. Expert Systems with Applications, 2023, 228: 120294. doi: 10.1016/j.eswa.2023.120294.[39] YAN Meihui, LUO Zhongtao, HE Zishu, et al. The five-domain-six-map method for signal analysis in over-the-horizon radar[C]. 2021 IEEE Radar Conference (RadarConf21), Atlanta, USA, 2021: 1–6. doi: 10.1109/RadarConf2147009.2021.9455249.[40] PAN Tianze, GUO Yuanyue, GUO Weiwei, et al. Detection of vital sign based on UWB radar by a time domain coherent accumulation method[J]. IEEE Sensors Journal, 2023, 23(15): 17054–17063. doi: 10.1109/jsen.2023.3283552.[41] ZHAO Dawei, WANG Jun, CHEN Gang, et al. Clutter cancellation based on frequency domain analysis in passive bistatic radar[J]. IEEE Access, 2020, 8: 43956–43964. doi: 10.1109/access.2020.2977961.[42] 薛帅康, 王小月, 许致火, 等. 面向人体呼吸心跳同时监测的雷达信号处理方法综述[J]. 电讯技术, 2023, 63(12): 1995–2002. doi: 10.20079/j.issn.1001-893x.220904002.XUE Shuaikang, WANG Xiaoyue, XU Zhihuo, et al. A review of radar signal processing for simultaneous monitoring of human vital signs[J]. Telecommunication Engineering, 2023, 63(12): 1995–2002. doi: 10.20079/j.issn.1001-893x.220904002.[43] TURLEY M. Impulsive noise rejection in HF radar using a linear prediction technique[C]. The International Conference on Radar (IEEE Cat. No.03EX695), Adelaide, Australia, 2003: 358–362. doi: 10.1109/RADAR.2003.1278767.[44] LU Lian, REN Weixin, and WANG Shidong. Fractional Fourier transform: Time-frequency representation and structural instantaneous frequency identification[J]. Mechanical Systems and Signal Processing, 2022, 178: 109305. doi: 10.1016/j.ymssp.2022.109305.[45] LI Tingpeng, WANG Zelong, and LIU Jiying. Evaluating effect of blanket jamming on radar via robust time-frequency analysis and peak to average power ratio[J]. IEEE Access, 2020, 8: 214504–214519. doi: 10.1109/access.2020.3040514.[46] SUN Kewen, JIN Tian, and YANG Dongkai. An improved time-frequency analysis method in interference detection for GNSS receivers[J]. Sensors, 2015, 15(4): 9404–9426. doi: 10.3390/s150409404.[47] LAO Guochao, YIN Canbin, YE Wei, et al. A frequency domain extraction based adaptive joint time frequency decomposition method of the maneuvering target radar echo[J]. Remote Sensing, 2018, 10(2): 266. doi: 10.3390/rs10020266.[48] LIU Meiru, XIA Hong, SUN Lin, et al. Vibration signal analysis of main coolant pump flywheel based on Hilbert-Huang transform[J]. Nuclear Engineering and Technology, 2015, 47(2): 219–225. doi: 10.1016/j.net.2014.12.010.[49] 朱少民, 夏虹, 尹文哲, 等. 基于变分模态分解和希尔伯特变换的转子非平稳信号故障特征识别[J]. 哈尔滨工程大学学报, 2024, 45(5): 825–832. doi: 10.11990/jheu.202205050.ZHU Shaomin, XIA Hong, YIN Wenzhe, et al. Fault feature identification for rotor non-stationary signals based on VMD-HT[J]. Journal of Harbin Engineering University, 2024, 45(5): 825–832. doi: 10.11990/jheu.202205050.[50] TOMA R N, KIM C H, and KIM J M. Bearing fault classification using ensemble empirical mode decomposition and convolutional neural network[J]. Electronics, 2021, 10(11): 1248. doi: 10.3390/electronics10111248.[51] CHENG Yao, WANG Zhiwei, CHEN Bingyan, et al. An improved complementary ensemble empirical mode decomposition with adaptive noise and its application to rolling element bearing fault diagnosis[J]. ISA Transactions, 2019, 91: 218–234. doi: 10.1016/j.isatra.2019.01.038.[52] PENG Kecheng, CAO Xiaoqun, LIU Bainian, et al. Ensemble empirical mode decomposition with adaptive noise with convolution based gated recurrent neural network: A new deep learning model for South Asian high intensity forecasting[J]. Symmetry, 2021, 13(6): 931. doi: 10.3390/sym13060931.[53] CHUI K T, GUPTA B B, LIU R W, et al. Handling data heterogeneity in electricity load disaggregation via optimized complete ensemble empirical mode decomposition and wavelet packet transform[J]. Sensors, 2021, 21(9): 3133. doi: 10.3390/s21093133.[54] WU Shiyou, TAN Kai, XIA Zhenghuan, et al. Improved human respiration detection method via ultra-wideband radar in through-wall or other similar conditions[J]. IET Radar, Sonar & Navigation, 2016, 10(3): 468–476. doi: 10.1049/iet-rsn.2015.0159.[55] LIANG Xiaolin, ZHANG Hao, YE Shengbo, et al. Improved denoising method for through-wall vital sign detection using UWB impulse radar[J]. Digital Signal Processing, 2018, 74: 72–93. doi: 10.1016/j.dsp.2017.12.004.[56] 高磊. 非接触人体体征信号提取及分离方法研究[D]. [硕士论文], 南京理工大学, 2017.GAO Lei. Research on non-contact human body signal extraction and separation methods[D]. [Master dissertation], Nanjing University of science and Technology, 2017.[57] SUN Li, HUANG Shuaiming, LI Yusheng, et al. Remote measurement of human vital signs based on joint-range adaptive EEMD[J]. IEEE Access, 2020, 8: 68514–68524. doi: 10.1109/access.2020.2985286.[58] 弭晴, 马永涛, 黄祉同. 基于多序列WOA-VMD算法的超宽带雷达心率检测[J]. 传感技术学报, 2024, 37(7): 1144–1153. doi: 10.3969/j.issn.1004-1699.2024.07.006.MI Qing, MA Yongtao, and HUANG Zhitong. Heart rate detection based on multi-sequence WOA-VMD algorithm using UWB radar[J]. Chinese Journal of Sensors and Actuators, 2024, 37(7): 1144–1153. doi: 10.3969/j.issn.1004-1699.2024.07.006.[59] NAISHADHAM K, PIOU J E, REN Lingyun, et al. Estimation of cardiopulmonary parameters from ultra wideband radar measurements using the state space method[J]. IEEE Transactions on Biomedical Circuits and Systems, 2016, 10(6): 1037–1046. doi: 10.1109/tbcas.2015.2510652.[60] REN Lingyun, WANG Haofei, NAISHADHAM K, et al. Phase-based methods for heart rate detection using UWB impulse Doppler radar[J]. IEEE Transactions on Microwave Theory and Techniques, 2016, 64(10): 3319–3331. doi: 10.1109/tmtt.2016.2597824.[61] LI Meiyu and LIN J. Wavelet-transform-based data-length-variation technique for fast heart rate detection using 5.8-GHz CW Doppler radar[J]. IEEE Transactions on Microwave Theory and Techniques, 2018, 66(1): 568–576. doi: 10.1109/tmtt.2017.2730182.[62] YANG Guocheng and YU Huimin. Vital signs detection based on UWB radar using trajectory capture and peak capture[C]. 2020 3rd International Conference on Electron Device and Mechanical Engineering (ICEDME), Suzhou, China, 2020: 657–661. doi: 10.1109/ICEDME50972.2020.00155.[63] WANG Yong, WANG Wen, ZHOU Mu, et al. Remote monitoring of human vital signs based on 77-GHz mm-wave FMCW radar[J]. Sensors, 2020, 20(10): 2999. doi: 10.3390/s20102999.[64] QIAO Lihong, LI Xin, XIAO Bin, et al. Learning-refined integral null space pursuit algorithm for noncontact multisubjects vital signs measurements using SFCW-UWB and IR-UWB radar[J]. IEEE Transactions on Instrumentation and Measurement, 2022, 71: 8506013. doi: 10.1109/tim.2022.3218031.[65] 何密, 平钦文, 戴然. 深度学习融合超宽带雷达图谱的跌倒检测研究[J]. 雷达学报, 2023, 12(2): 343–355. doi: 10.12000/JR22169.HE Mi, PING Qinwen, and DAI Ran. Fall detection based on deep learning fusing ultrawideband radar spectrograms[J]. Journal of Radars, 2023, 12(2): 343–355. doi: 10.12000/JR22169.[66] MALEŠEVIĆ N, PETROVIĆ V, BELIĆ M, et al. Contactless real-time heartbeat detection via 24 GHz continuous-wave Doppler radar using artificial neural networks[J]. Sensors, 2020, 20(8): 2351. doi: 10.3390/s20082351.[67] 周金海, 吴耿俊, 雷雯, 等. 基于呼吸样本空间的超宽带雷达身份识别[J]. 电子测量与仪器学报, 2022, 36(1): 118–125. doi: 10.13382/j.jemi.B2104217.ZHOU Jinhai, WU Gengjun, LEI Wen, et al. UWB radar identification based on breathing sample space[J]. Journal of Electronic Measurement and Instrumentation, 2022, 36(1): 118–125. doi: 10.13382/j.jemi.B2104217.[68] HE Mi, NIAN Yongjian, XU Luping, et al. Adaptive separation of respiratory and heartbeat signals among multiple people based on empirical wavelet transform using UWB radar[J]. Sensors, 2020, 20(17): 4913. doi: 10.3390/s20174913.[69] ZHAO Heng, HONG Hong, MIAO Dongyu, et al. A noncontact breathing disorder recognition system using 2.4-GHz digital-IF Doppler radar[J]. IEEE Journal of Biomedical and Health Informatics, 2019, 23(1): 208–217. doi: 10.1109/jbhi.2018.2817258.[70] 侯敏. 基于深度学习的人体微动特性分析与步态识别[D]. [硕士论文], 西安电子科技大学, 2021. doi: 10.27389/d.cnki.gxadu.2021.001623.HOU Min. Analysis of human micro-motion characteristics and gait recognition based on deep learning[D]. [Master dissertation], Xidian University, 2021. doi: 10.27389/d.cnki.gxadu.2021.001623.[71] 郑学召, 孙梓峪, 郭军, 等. 矿山钻孔救援多源信息探测技术研究与应用[J]. 煤田地质与勘探, 2022, 50(11): 94–102. doi: 10.12363/issn.1001-1986.22.05.0421.ZHENG Xuezhao, SUN Zhiyu, GUO Jun, et al. Research and application of multi-source information detection technology for drilling rescue of mine[J]. Coal Geology & Exploration, 2022, 50(11): 94–102. doi: 10.12363/issn.1001-1986.22.05.0421.[72] 王保生. 超宽带信号穿透塌方体衰减特性及生命特征检测方法研究[D]. [硕士论文], 黑龙江科技大学, 2017.WANG Baosheng. Study on attenuation characteristics and life characteristics detection method of ultra wide band signal through landslide[D]. [Master dissertation], Heilongjiang University of Science and Technology, 2017.[73] 李欣欣. 遮蔽环境下基于超宽带雷达的生命探测技术研究[D]. [硕士论文], 兰州理工大学, 2023. doi: 10.27206/d.cnki.ggsgu.2023.000714.LI Xinxin. Research on life detection technology based on Ultra-Wide-Band radar in sheltered environment[D]. [Master dissertation], Lanzhou University of Technology, 2023. doi: 10.27206/d.cnki.ggsgu.2023.000714.[74] 潘俊, 叶盛波, 史城, 等. 基于先验信噪比估计的超宽带穿墙雷达呼吸信号检测算法研究[J]. 电子与信息学报, 2022, 44(4): 1241–1248. doi: 10.11999/JEIT211042.PAN Jun, YE Shengbo, SHI Cheng, et al. Study on respiration signal detection algorithm of Ultra-WideBand through-wall radar based on a priori signal-to-noise ratio estimation[J]. Journal of Electronics & Information Technology, 2022, 44(4): 1241–1248. doi: 10.11999/JEIT211042.[75] LI Jing, LIU Lanbo, ZENG Zhaofa, et al. Advanced signal processing for vital sign extraction with applications in UWB radar detection of trapped victims in complex environments[J]. IEEE Journal of Selected Topics in Applied Earth Observations and Remote Sensing, 2014, 7(3): 783–791. doi: 10.1109/jstars.2013.2259801.[76] MAO Kai, ZHU Qiuming, YE Xijuan, et al. UWB channel modeling and simulation with continuous frequency response[J]. China Communications, 2022, 19(11): 88–98. doi: 10.23919/jcc.2022.11.007.[77] CAI Jiajia, ZHOU Hao, HUANG Weimin, et al. Ship detection and direction finding based on time-frequency analysis for compact HF radar[J]. IEEE Geoscience and Remote Sensing Letters, 2021, 18(1): 72–76. doi: 10.1109/lgrs.2020.2967387.[78] 瑞泽, 熊明耀, 梁步阁. 穿墙雷达呼吸信号提取算法研究[J]. 电子技术, 2021, 50(7): 106–108.RUI Ze, XIONG Mingyao, and LIANG Buge. Study on algorithm of breathing signal extraction for through wall radar[J]. Electronic Technology, 2021, 50(7): 106–108.[79] WANG Kun, ZENG Zhaofa, and SUN Jiguang. Through-wall detection of the moving paths and vital signs of human beings[J]. IEEE Geoscience and Remote Sensing Letters, 2019, 16(5): 717–721. doi: 10.1109/lgrs.2018.2881311.[80] NEZIROVIC A, YAROVOY A G, and LIGTHART L P. Signal processing for improved detection of trapped victims using UWB radar[J]. IEEE Transactions on Geoscience and Remote Sensing, 2010, 48(4): 2005–2014. doi: 10.1109/tgrs.2009.2036840.[81] ALAM M J, O’SHAUGHNESSY D D, and SELOUANI S A. Speech enhancement based on novel two-step a priori SNR estimators[C]. 9th Annual Conference of the International Speech Communication Association, Brisbane, Australia, 2008: 565–568.[82] ZHANG Jingwen, QI Qingjie, CHENG Huifeng, et al. A multi-target localization and vital sign detection method using ultra-wide band radar[J]. Sensors, 2023, 23(13): 5779. doi: 10.3390/s23135779.[83] 樊哲宁, 朱嘉健, 王立新, 等. 基于超宽带雷达及支持向量机的灾后人体呼吸信号识别方法与试验研究[J]. 震灾防御技术, 2021, 16(3): 597–604. doi: 10.11899/zzfy20210320.FAN Zhening, ZHU Jiajian, WANG Lixin, et al. An approach and experiments for human respiratory signal recognition based on UWB radar and support vector machine[J]. Technology for Earthquake Disaster Prevention, 2021, 16(3): 597–604. doi: 10.11899/zzfy20210320.[84] PAN Jun, YE Shengbo, NI Zhikang, et al. Enhancement of vital signals based on low-rank, sparse representation for UWB through-wall radar[J]. Remote Sensing Letters, 2022, 13(1): 98–106. doi: 10.1080/2150704x.2021.1995069.[85] LIANG Xiao, PAN Jun, ZHENG Zhijie, et al. Enhancement of vital signals for UWB through-wall radar using nonconvex regularization[J]. Remote Sensing Letters, 2023, 14(4): 392–401. doi: 10.1080/2150704x.2023.2204197.[86] LIANG Xiao, YE Shengbo, SONG Chenyang, et al. Enhancement of vital signals for UWB through-wall radar using low-rank and block-sparse matrix decomposition[J]. Remote Sensing, 2024, 16(4): 620. doi: 10.3390/rs16040620.[87] ISLAM S M M, BORIĆ-LUBECKE O, and LUBECKE V M. Identity authentication in two-subject environments using microwave Doppler radar and machine learning classifiers[J]. IEEE Transactions on Microwave Theory and Techniques, 2022, 70(11): 5063–5076. doi: 10.1109/tmtt.2022.3197413.[88] PURNOMO A T, LIN Dingbing, ADIPRABOWO T, et al. Non-contact monitoring and classification of breathing pattern for the supervision of people infected by COVID-19[J]. Sensors, 2021, 21(9): 3172. doi: 10.3390/s21093172.[89] 胡锡坤, 金添. 基于自适应小波尺度选择的生物雷达呼吸与心跳分离方法[J]. 雷达学报, 2016, 5(5): 462–469. doi: 10.12000/JR16103.HU Xikun and JIN Tian. Adaptive wavelet scale selection-based method for separating respiration and heartbeat in bio-radars[J]. Journal of Radars, 2016, 5(5): 462–469. doi: 10.12000/JR16103.[90] YE Chen, GUI Guan, and OHTSUKI T. Deep clustering with LSTM for vital signs separation in contact-free heart rate estimation[C]. ICC 2020–2020 IEEE International Conference on Communications (ICC), Dublin, Ireland, 2020: 1–6. doi: 10.1109/ICC40277.2020.9149328.[91] QIAO Lihong, WANG Zehua, XIAO Bin, et al. Spectral unmixing successive variational mode decomposition for robust vital signs detection using UWB radar[J]. IEEE Transactions on Instrumentation and Measurement, 2023, 72: 8502813. doi: 10.1109/tim.2023.3274171.[92] KANG Sun, KIM D K, LEE Y, et al. Non-contact diagnosis of obstructive sleep apnea using impulse-radio ultra-wideband radar[J]. Scientific Reports, 2020, 10(1): 5261. doi: 10.1038/s41598-020-62061-4.[93] ZHENG Tianyue, CHEN Zhe, ZHANG Shujie, et al. MoRe-Fi: Motion-robust and fine-grained respiration monitoring via deep-learning UWB radar[C]. The 19th ACM Conference on Embedded Networked Sensor Systems, Coimbra, Portugal, 2021: 111–124. doi: 10.1145/3485730.3485932.[94] 徐向阳. 基于UWB生物雷达的心跳呼吸提取技术实现[D]. [硕士论文], 西安电子科技大学, 2018.XU Xiangyang. Realization on extracting technology of heartbeat and respiration based on UWB bioradar[D]. [Master dissertation], Xidian University, 2018.[95] 陶启明. 基于超宽带雷达的生命特征信息提取技术研究[D]. [硕士论文], 西安电子科技大学, 2022. doi: 10.27389/d.cnki.gxadu.2022.003124.TAO Qiming. Vital sign monitoring using ultra wide band radar[D]. [Master dissertation], Xidian University, 2022. doi: 10.27389/d.cnki.gxadu.2022.003124.[96] YUAN Zhonghang, LU Shuaibing, HE Yi, et al. Nmr-VSM: Non-touch motion-robust vital sign monitoring via UWB radar based on deep learning[J]. Micromachines, 2023, 14(7): 1479. doi: 10.3390/mi14071479.[97] AHMED S, LEE Y, LIM Y H, et al. Noncontact assessment for fatigue based on heart rate variability using IR-UWB radar[J]. Scientific Reports, 2022, 12(1): 14211. doi: 10.1038/s41598-022-18498-w.[98] 乔嘉豪. 基于生物雷达的心跳分离与特征提取方法研究[D]. [硕士论文], 西安工业大学, 2023. doi: 10.27391/d.cnki.gxagu.2023.000594.QIAO Jiahao. Research on the method of heartbeat separation and feature extraction based on bio-radar[D]. [Master dissertation], Xi’an Technological University, 2023. doi: 10.27391/d.cnki.gxagu.2023.000594.[99] LIANG Xiaolin and JIANG Yongling. Detection of breathing rates in through-wall UWB radar utilizing JTFA[J]. KSII Transactions on Internet and Information Systems (TIIS), 2019, 13(11): 5527–5545. doi: 10.3837/tiis.2019.11.014.[100] JIN Yanghao, CHEN Jianlai, LIANG Buge, et al. First demonstration of using signal processing approach to suppress signal ringing in impulse UWB through-wall radar[J]. IEEE Geoscience and Remote Sensing Letters, 2022, 19: 3505505. doi: 10.1109/lgrs.2021.3070407.[101] ZHENG Tianyue, CHEN Zhe, CAI Chao, et al. V2iFi: In-vehicle vital sign monitoring via compact RF sensing[J]. Proceedings of the ACM on Interactive, Mobile, Wearable and Ubiquitous Technologies, 2020, 4(2): 70. doi: 10.1145/3397321.[102] SCHIRES E, GEORGIOU P, and LANDE T S. Vital sign monitoring through the back using an UWB impulse radar with body coupled antennas[J]. IEEE Transactions on Biomedical Circuits and Systems, 2018, 12(2): 292–302. doi: 10.1109/TBCAS.2018.2799322. -
Proportional views

- Publishing Ethics
- Journal Insights
- Abstracting & Indexing
- Peer Review Policies
- Guide for Authors
- Conference
- ISSN 2095-283X (Print)ISSN 2097-339X (Online)
- CN 10-1030/TN
- CODEN LXEUAO
About Journal
- Sponsor: China Radio Detection and Ranging Industry Association (CRIA)
- Phone: 010-58887062
- Email:radars@aircas.ac.cn
- Publisher: Leida Xuebao Bianjibu (Editorial office of the Journal of Radars)
Contacts Us

京ICP备20021838号-14
Supported by: Beijing Renhe Information Technology Co. Ltd

Export File
Citation
Format
Content
 DownLoad:


- Figure 1. UWB radar advantages and application areas
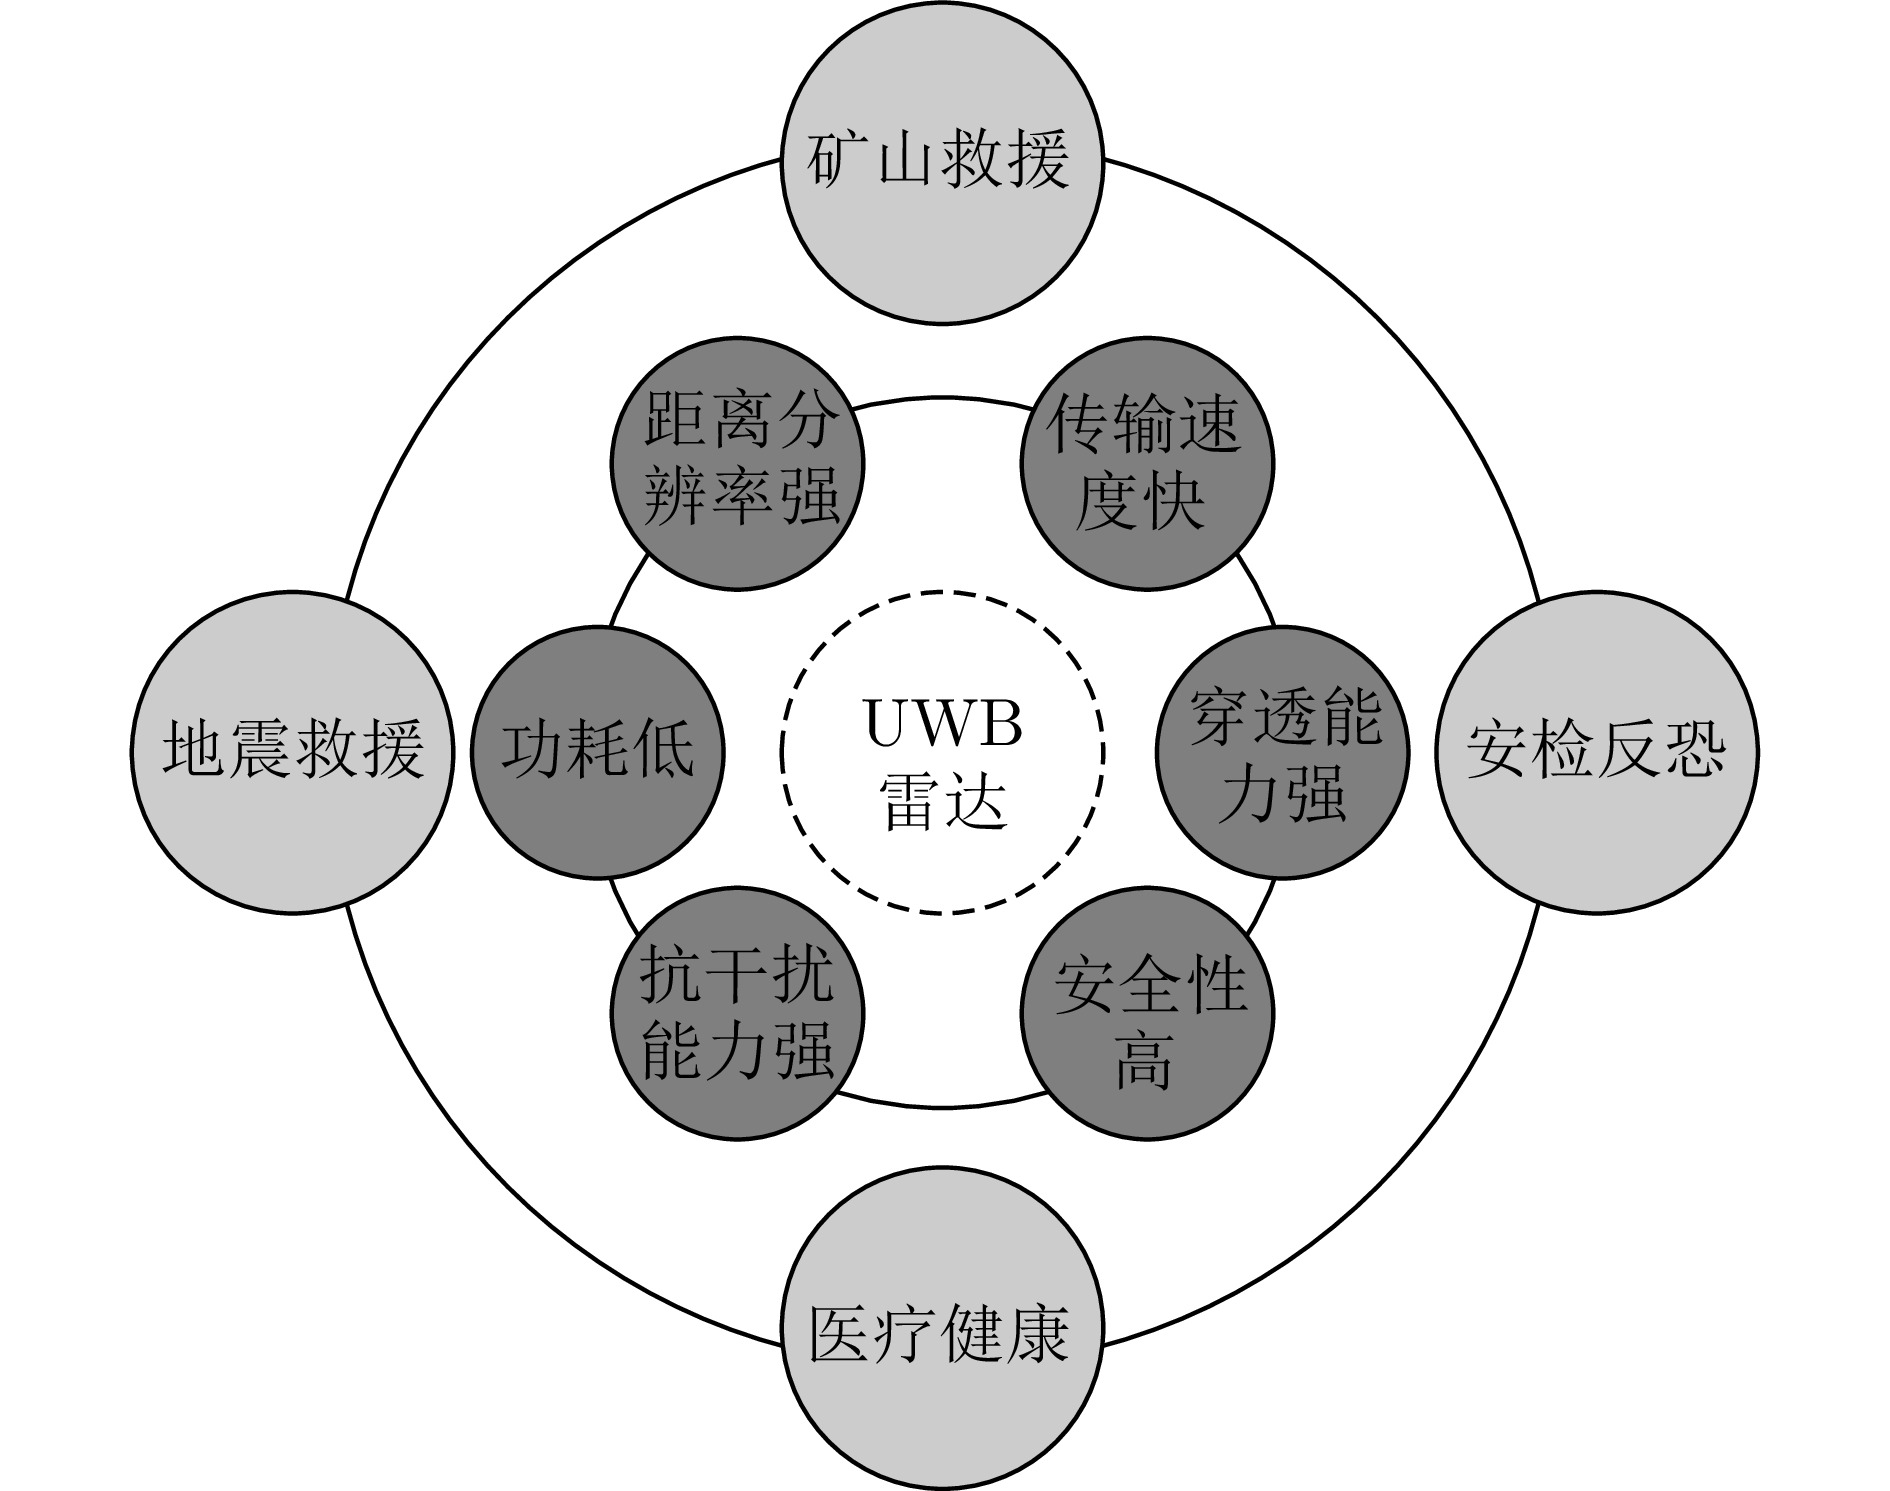
- Figure 2. Pulsed-wave UWB radar echo time delay
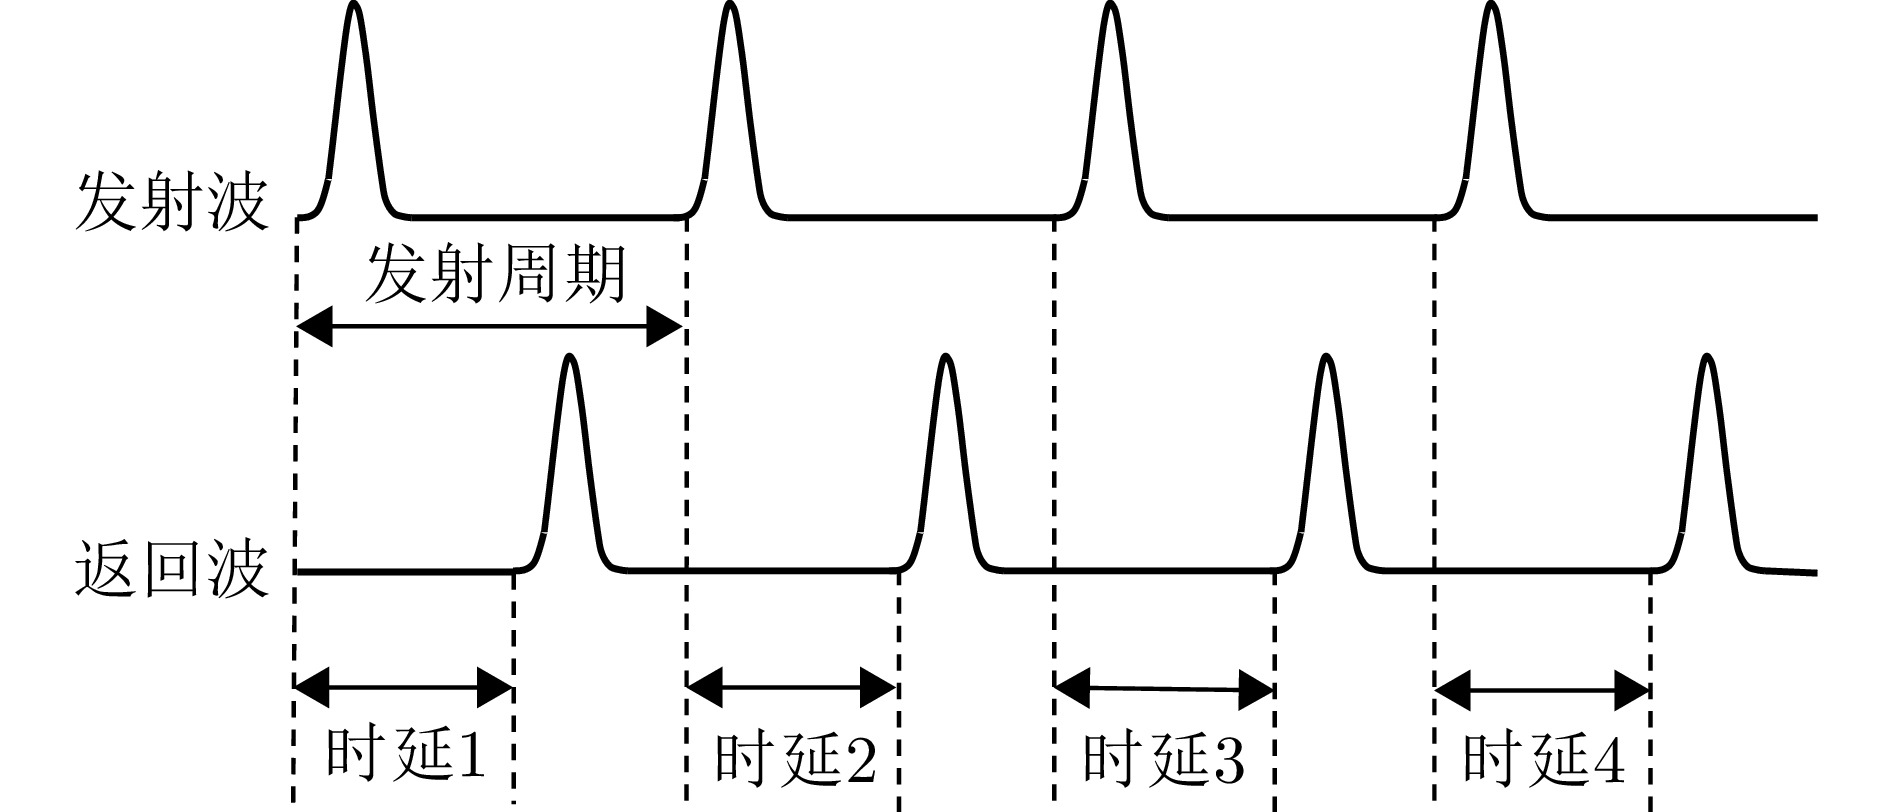
- Figure 3. Schematic of UWB radar detection principle
- Figure 4. Principle of Doppler detection of respiratory heartbeat
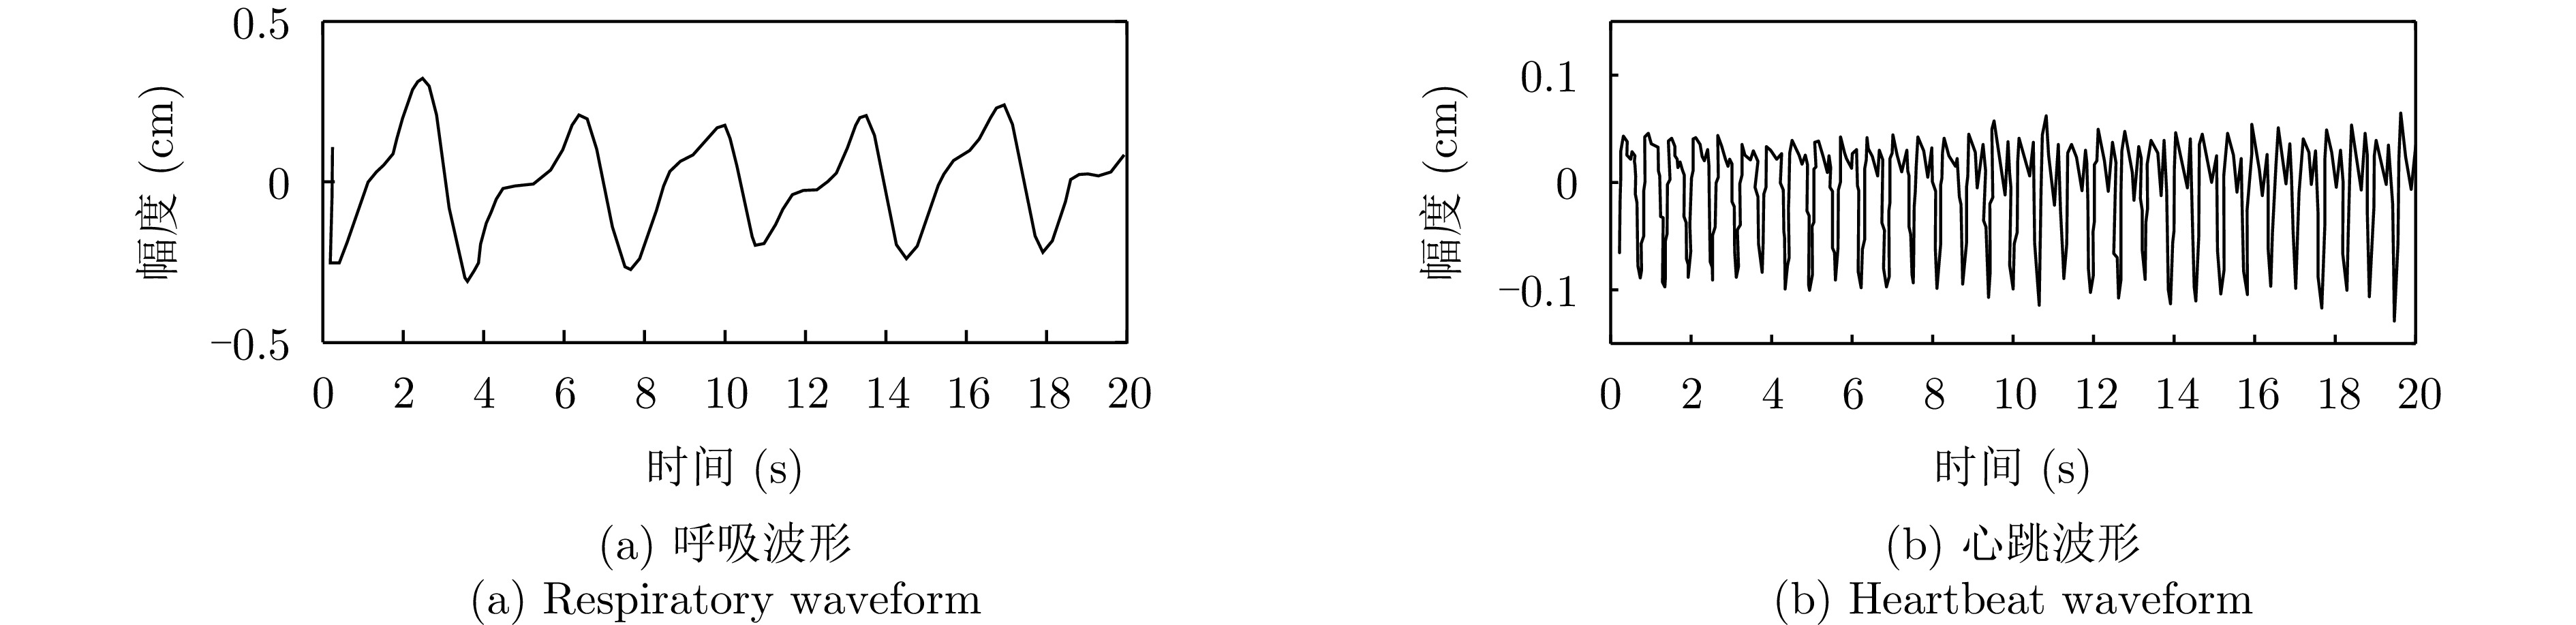
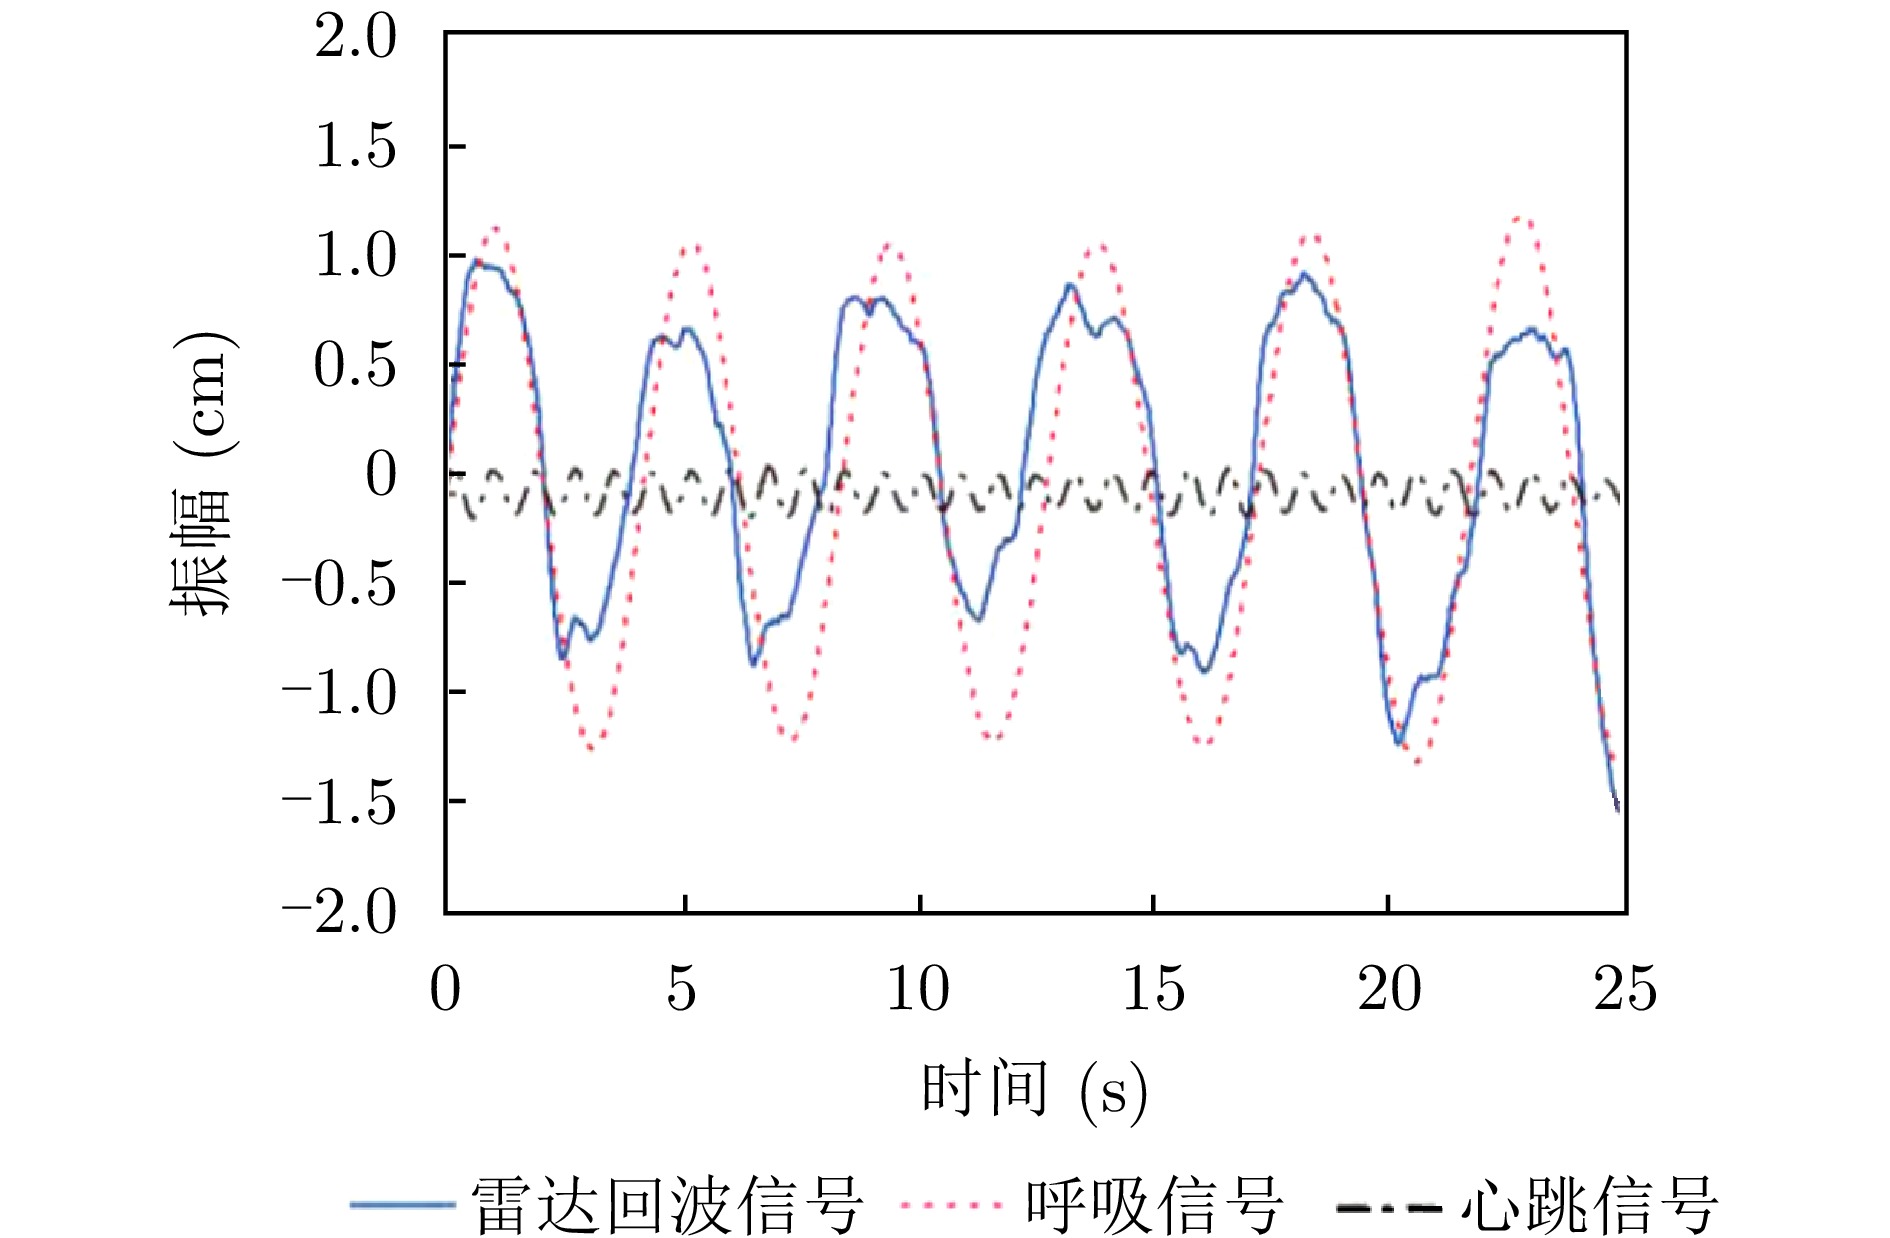
- Figure 5. Actual respiratory heartbeat waveform detected by radar
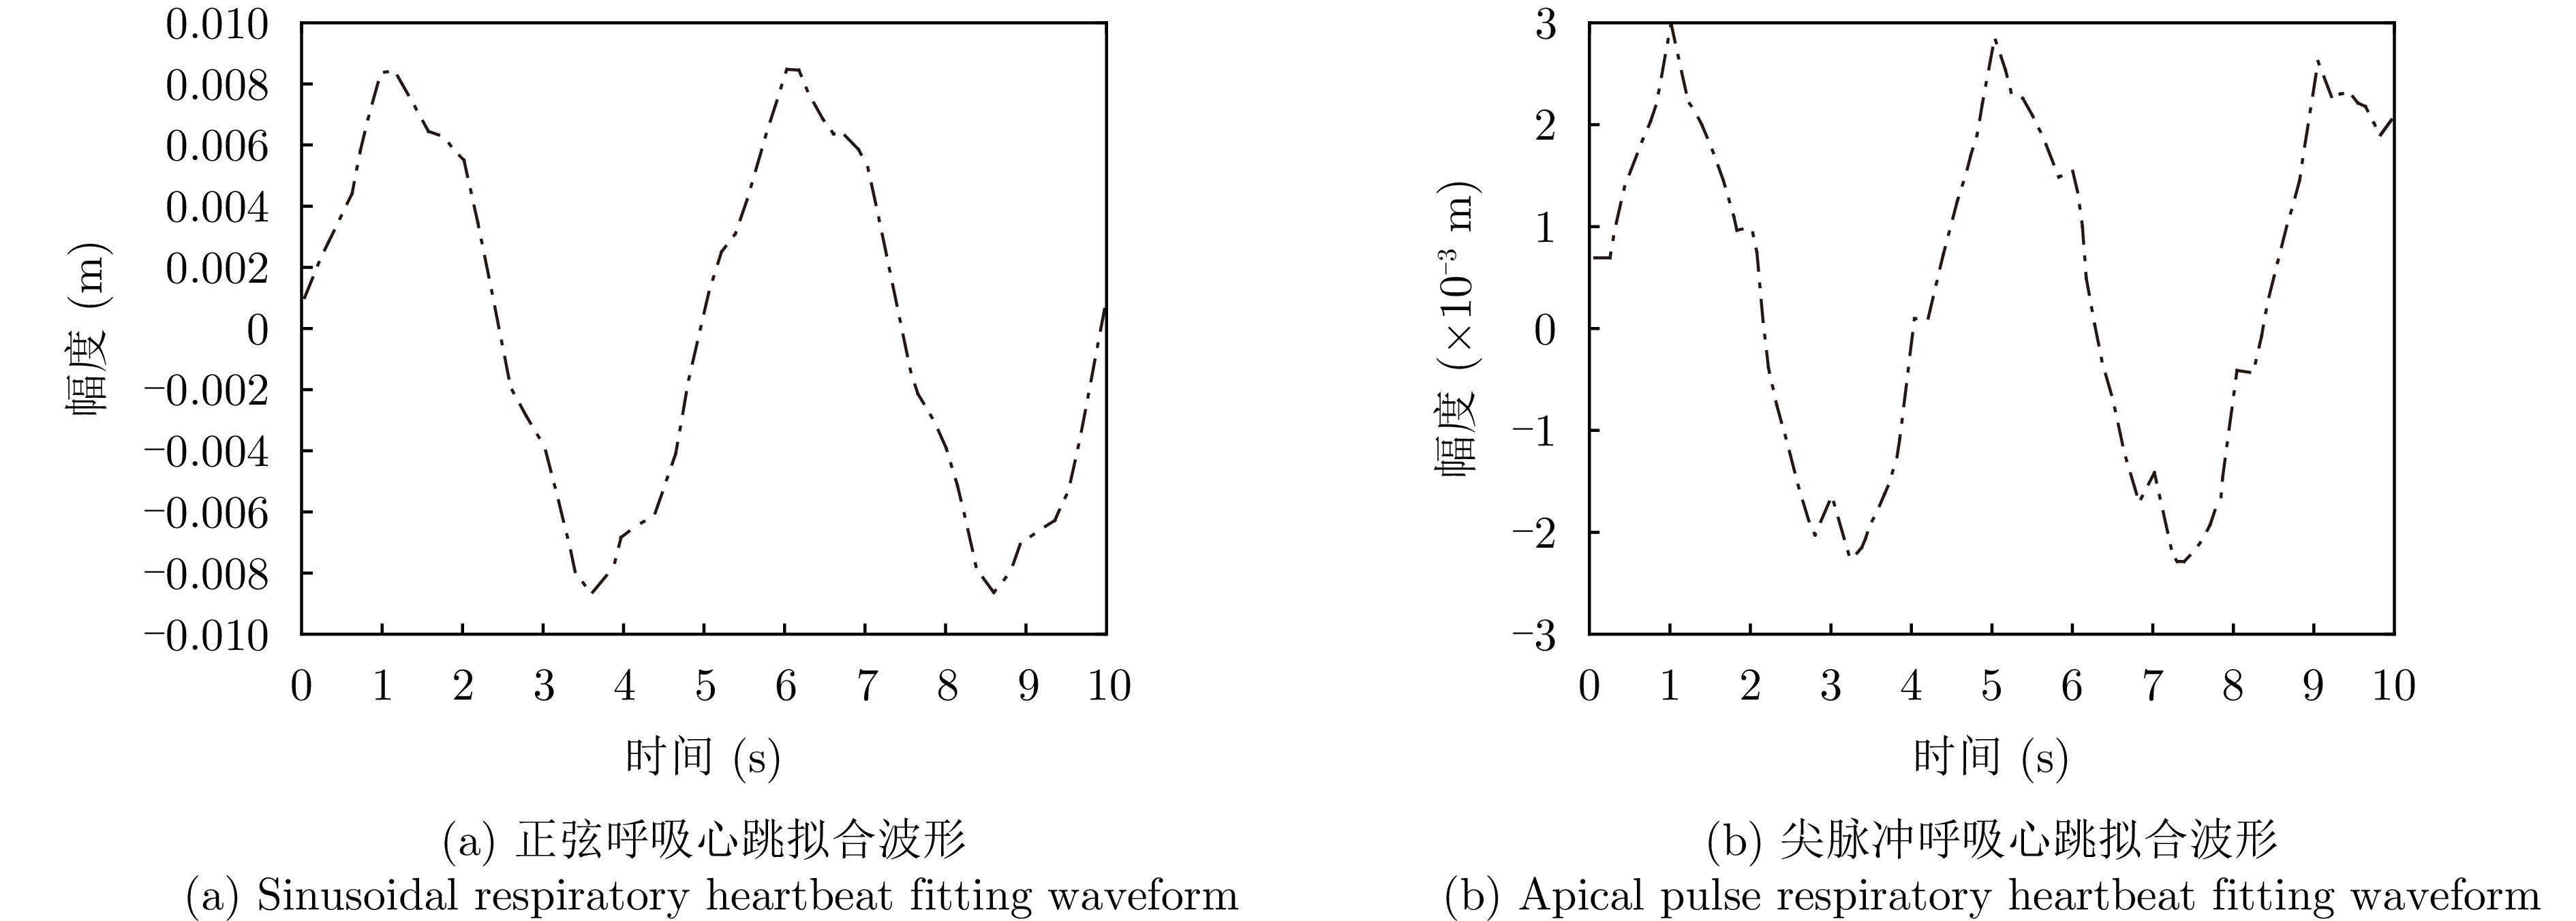
- Figure 6. Comparison of fitted waveforms for sinusoidal and apical pulse respiratory heartbeats[25]
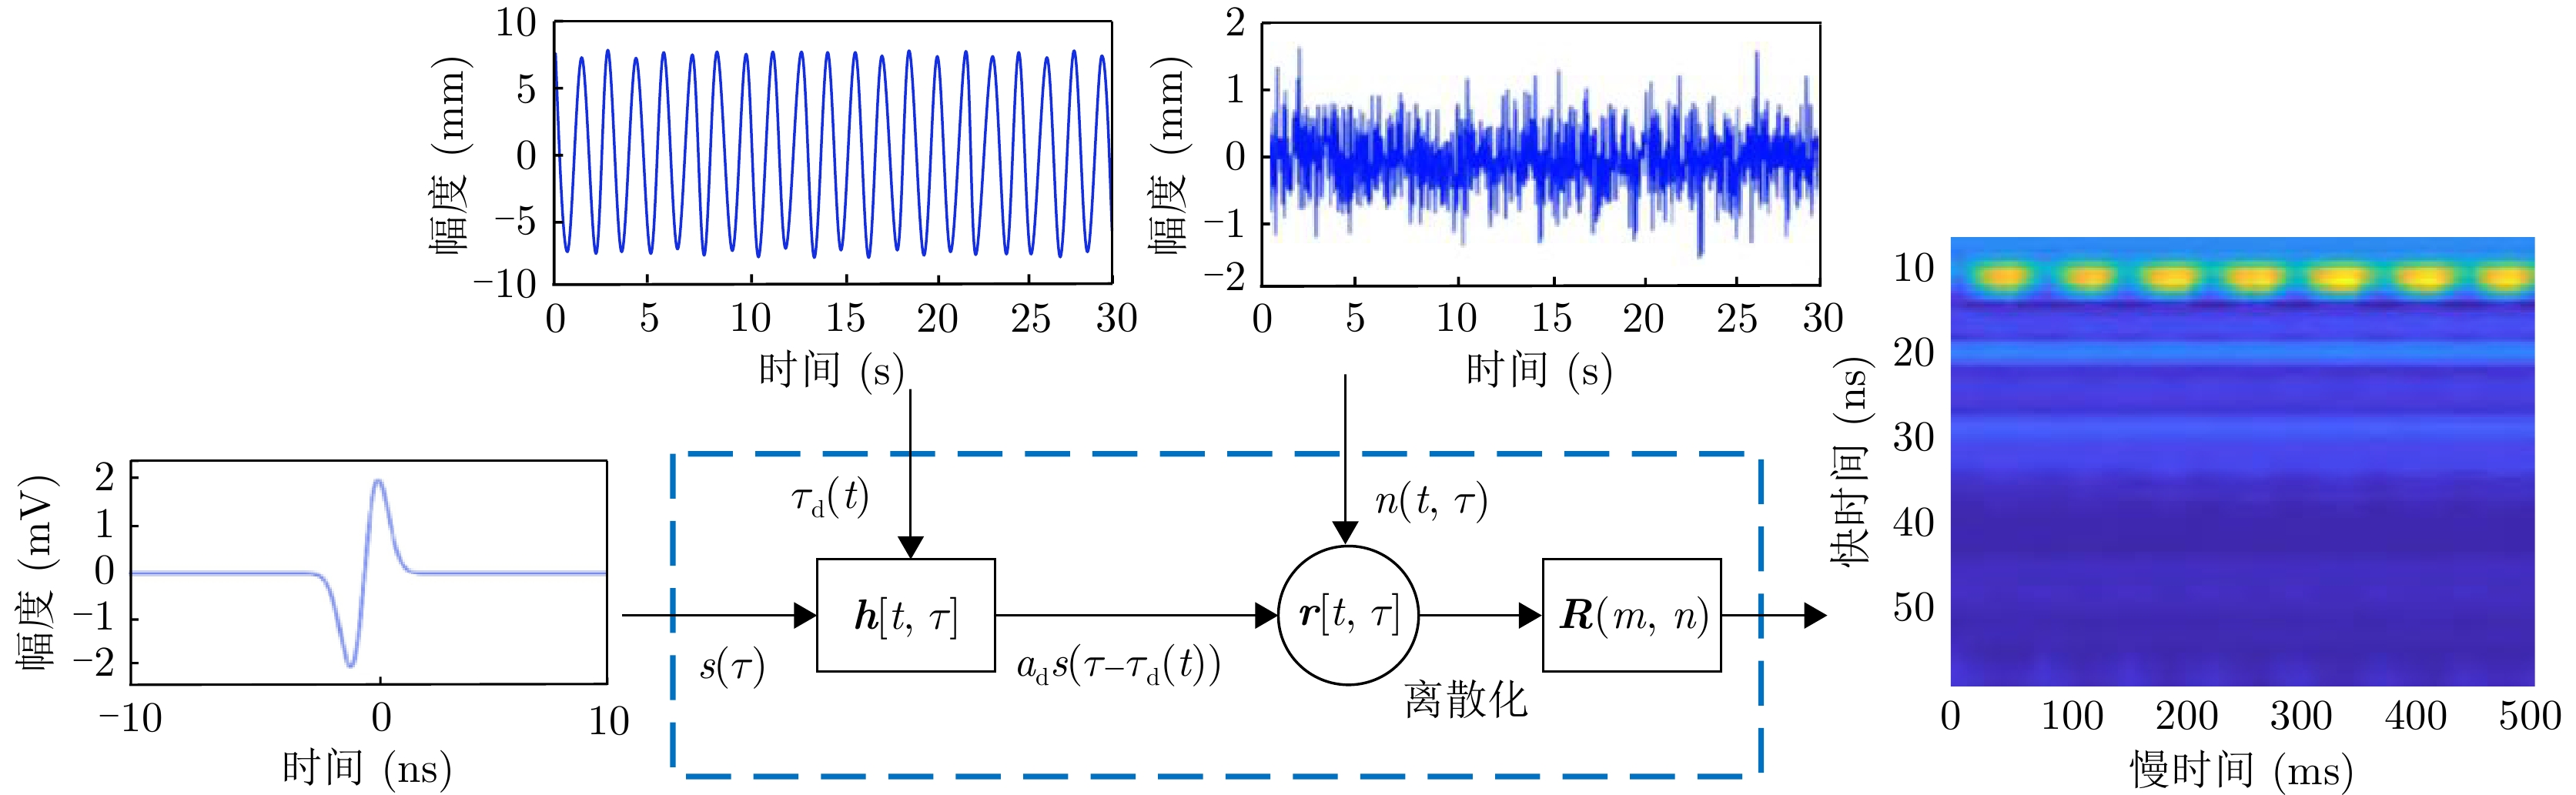
- Figure 7. Schematic diagram of the radar echo model construction process
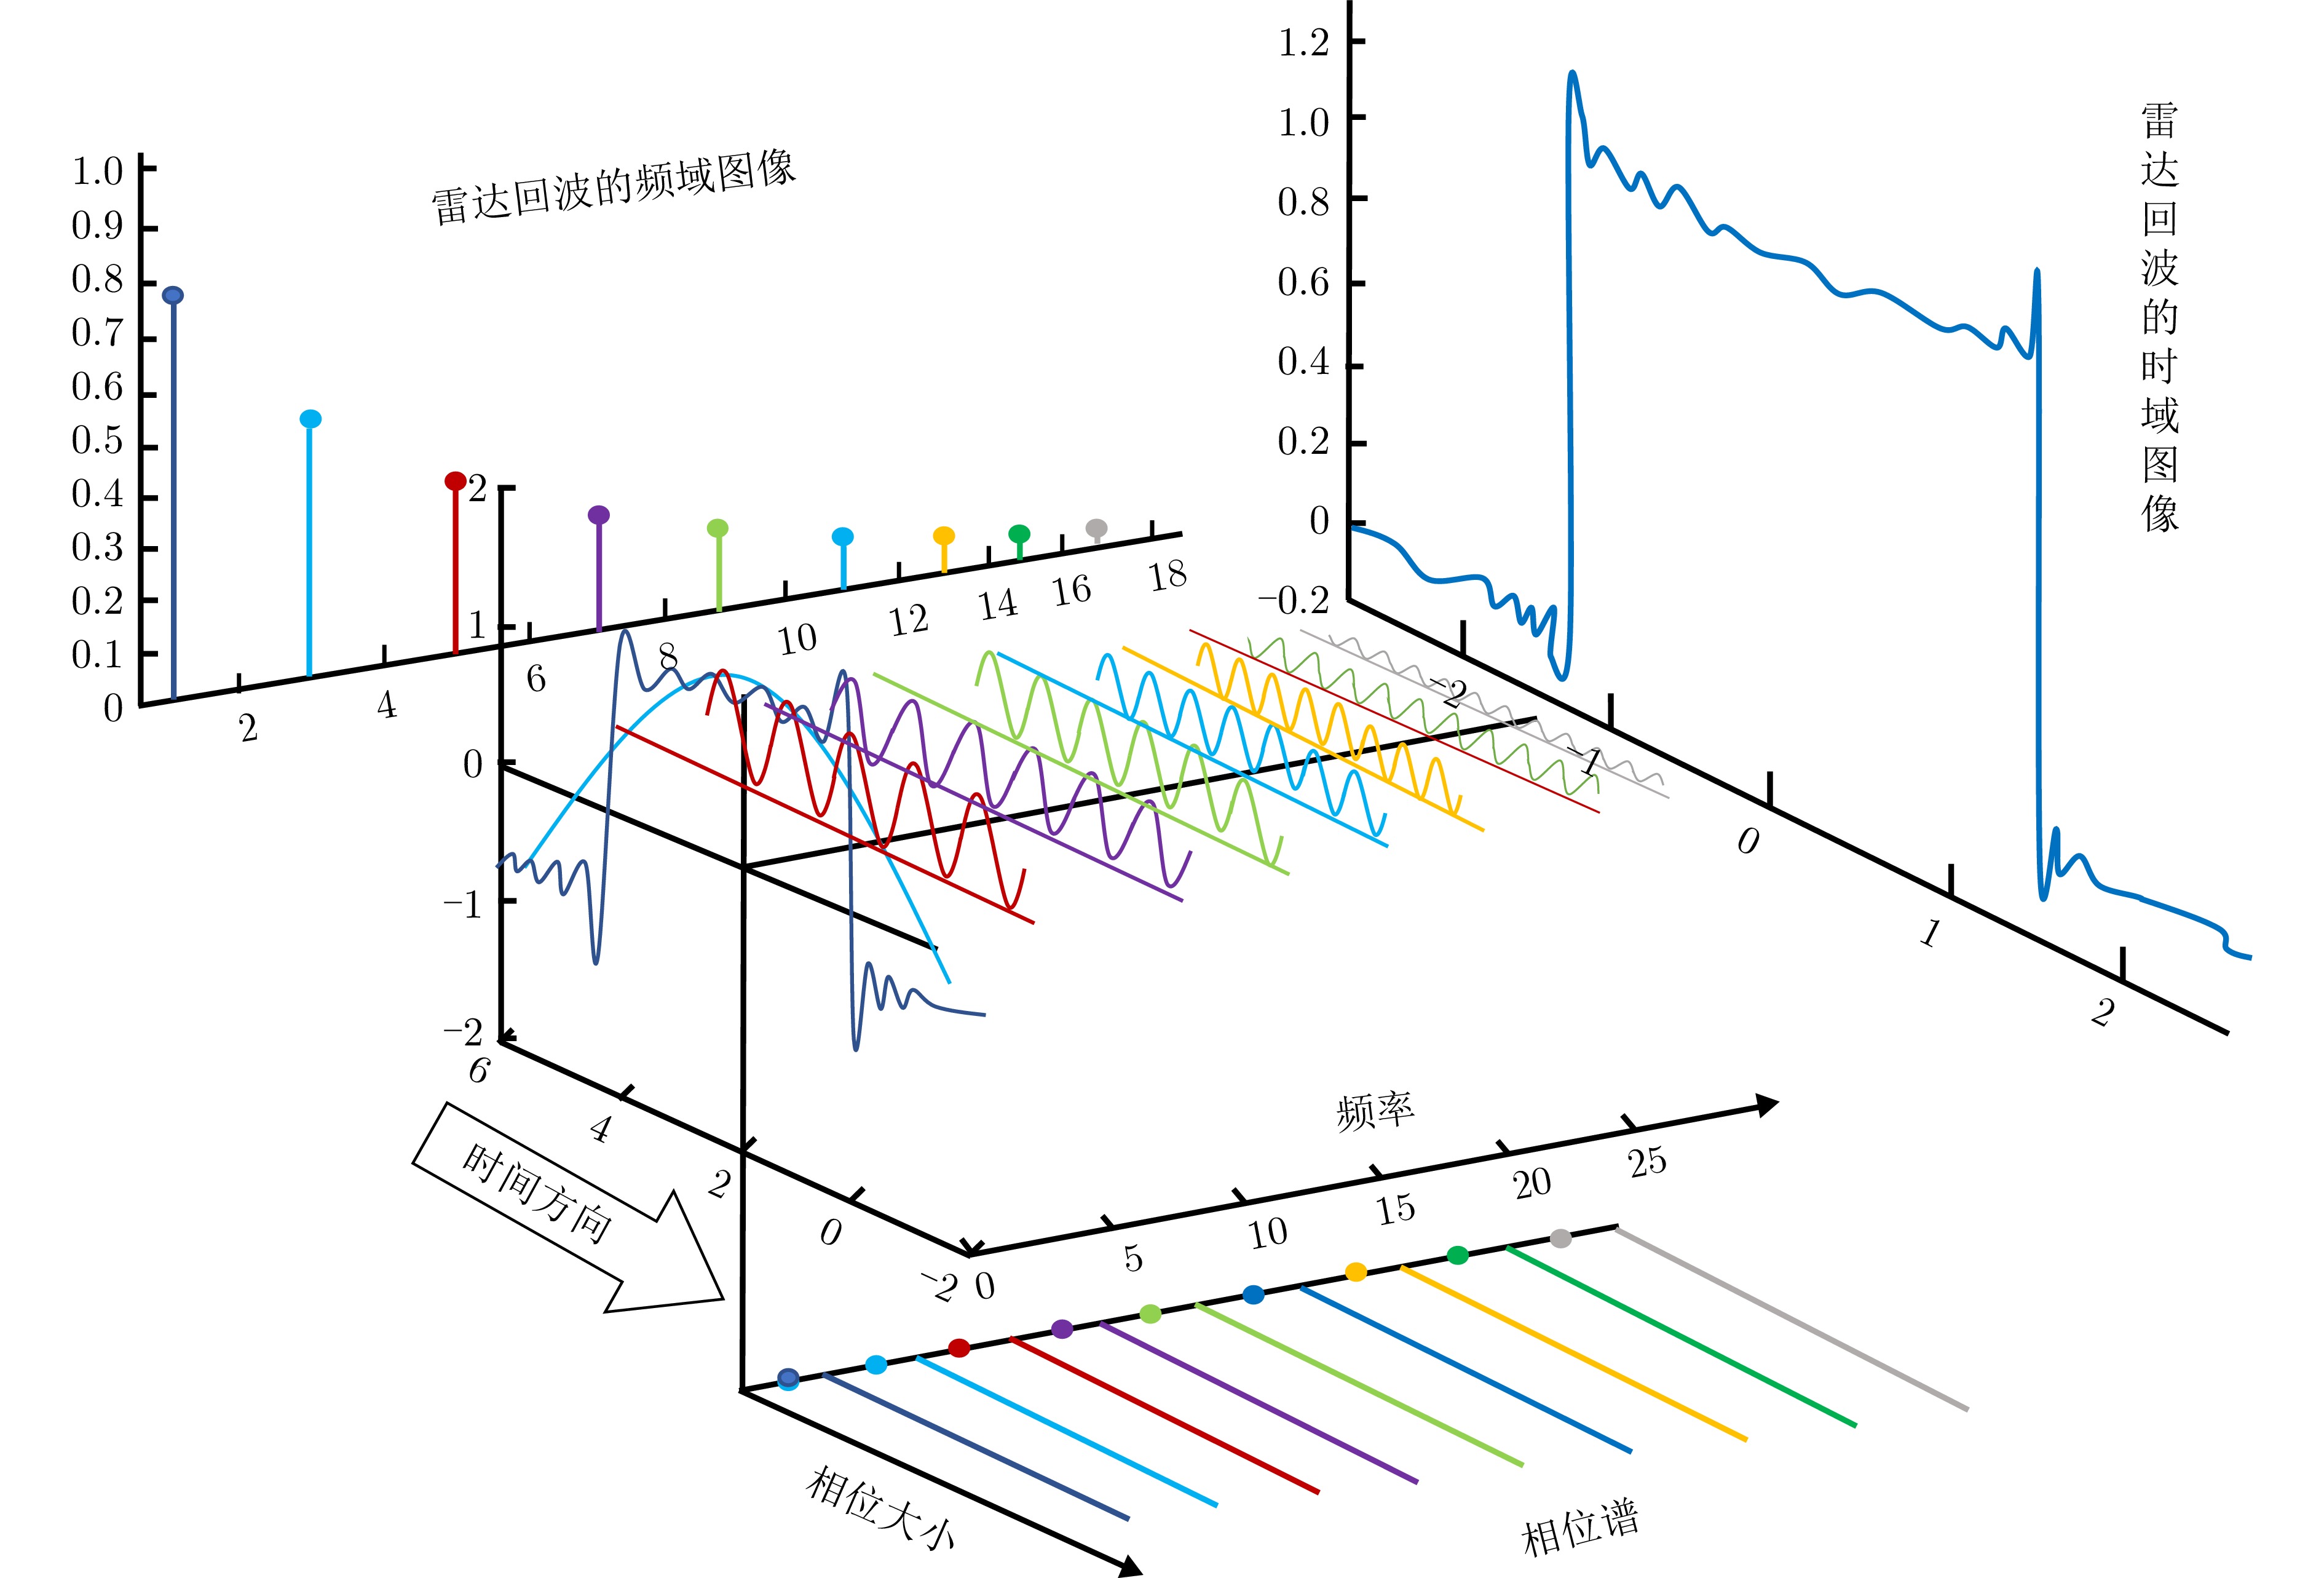
- Figure 8. Schematic of the relationship between radar echo in time and frequency domains
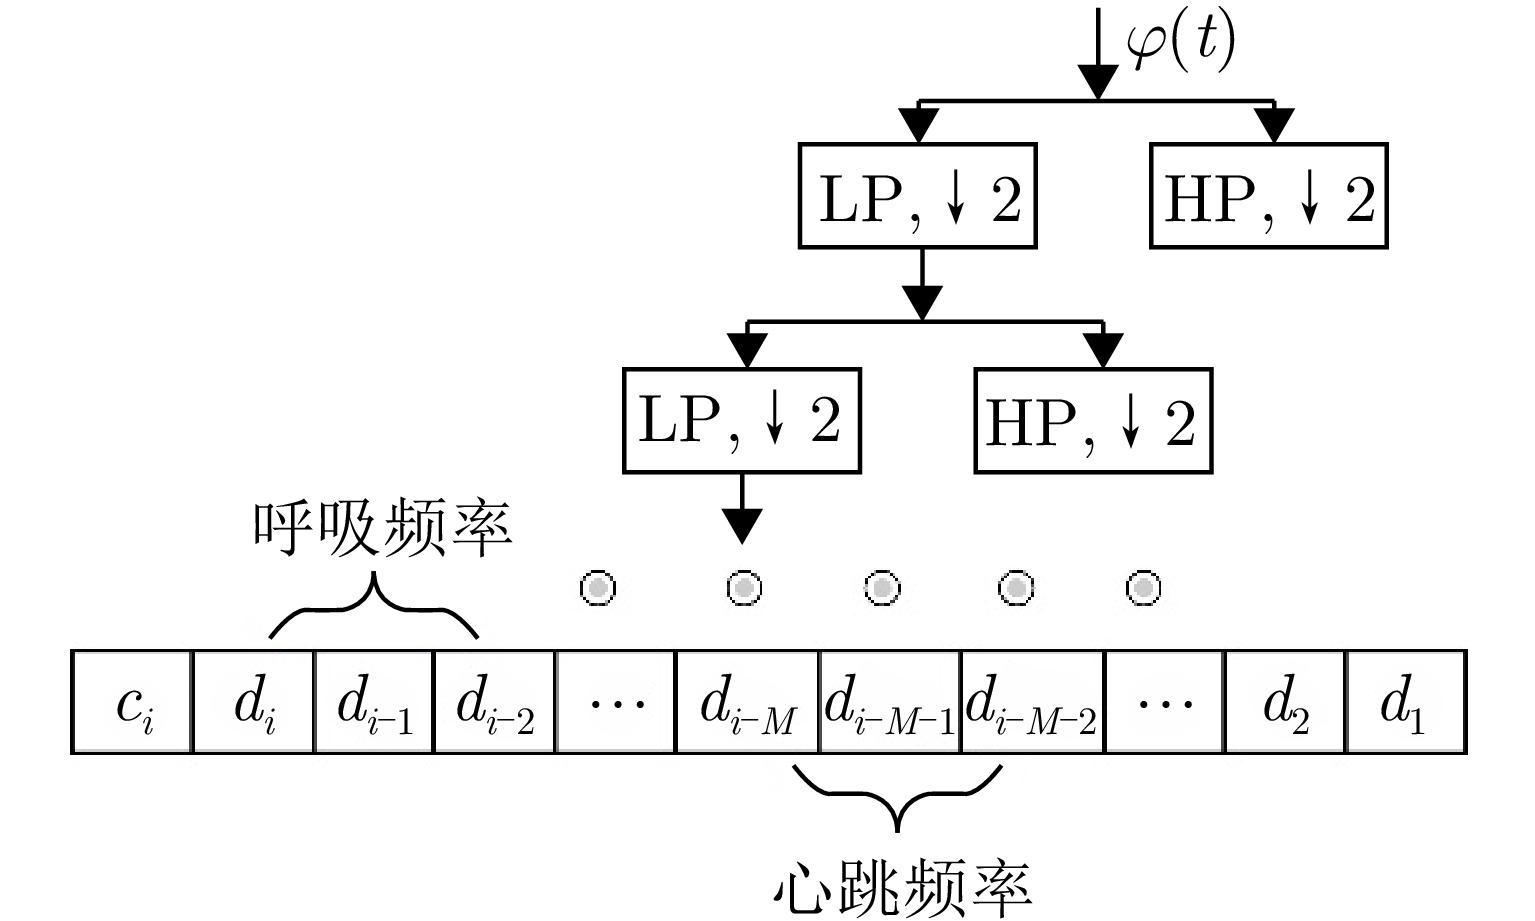
- Figure 9. Principle of wavelet transform decomposition and reconstruction[42]
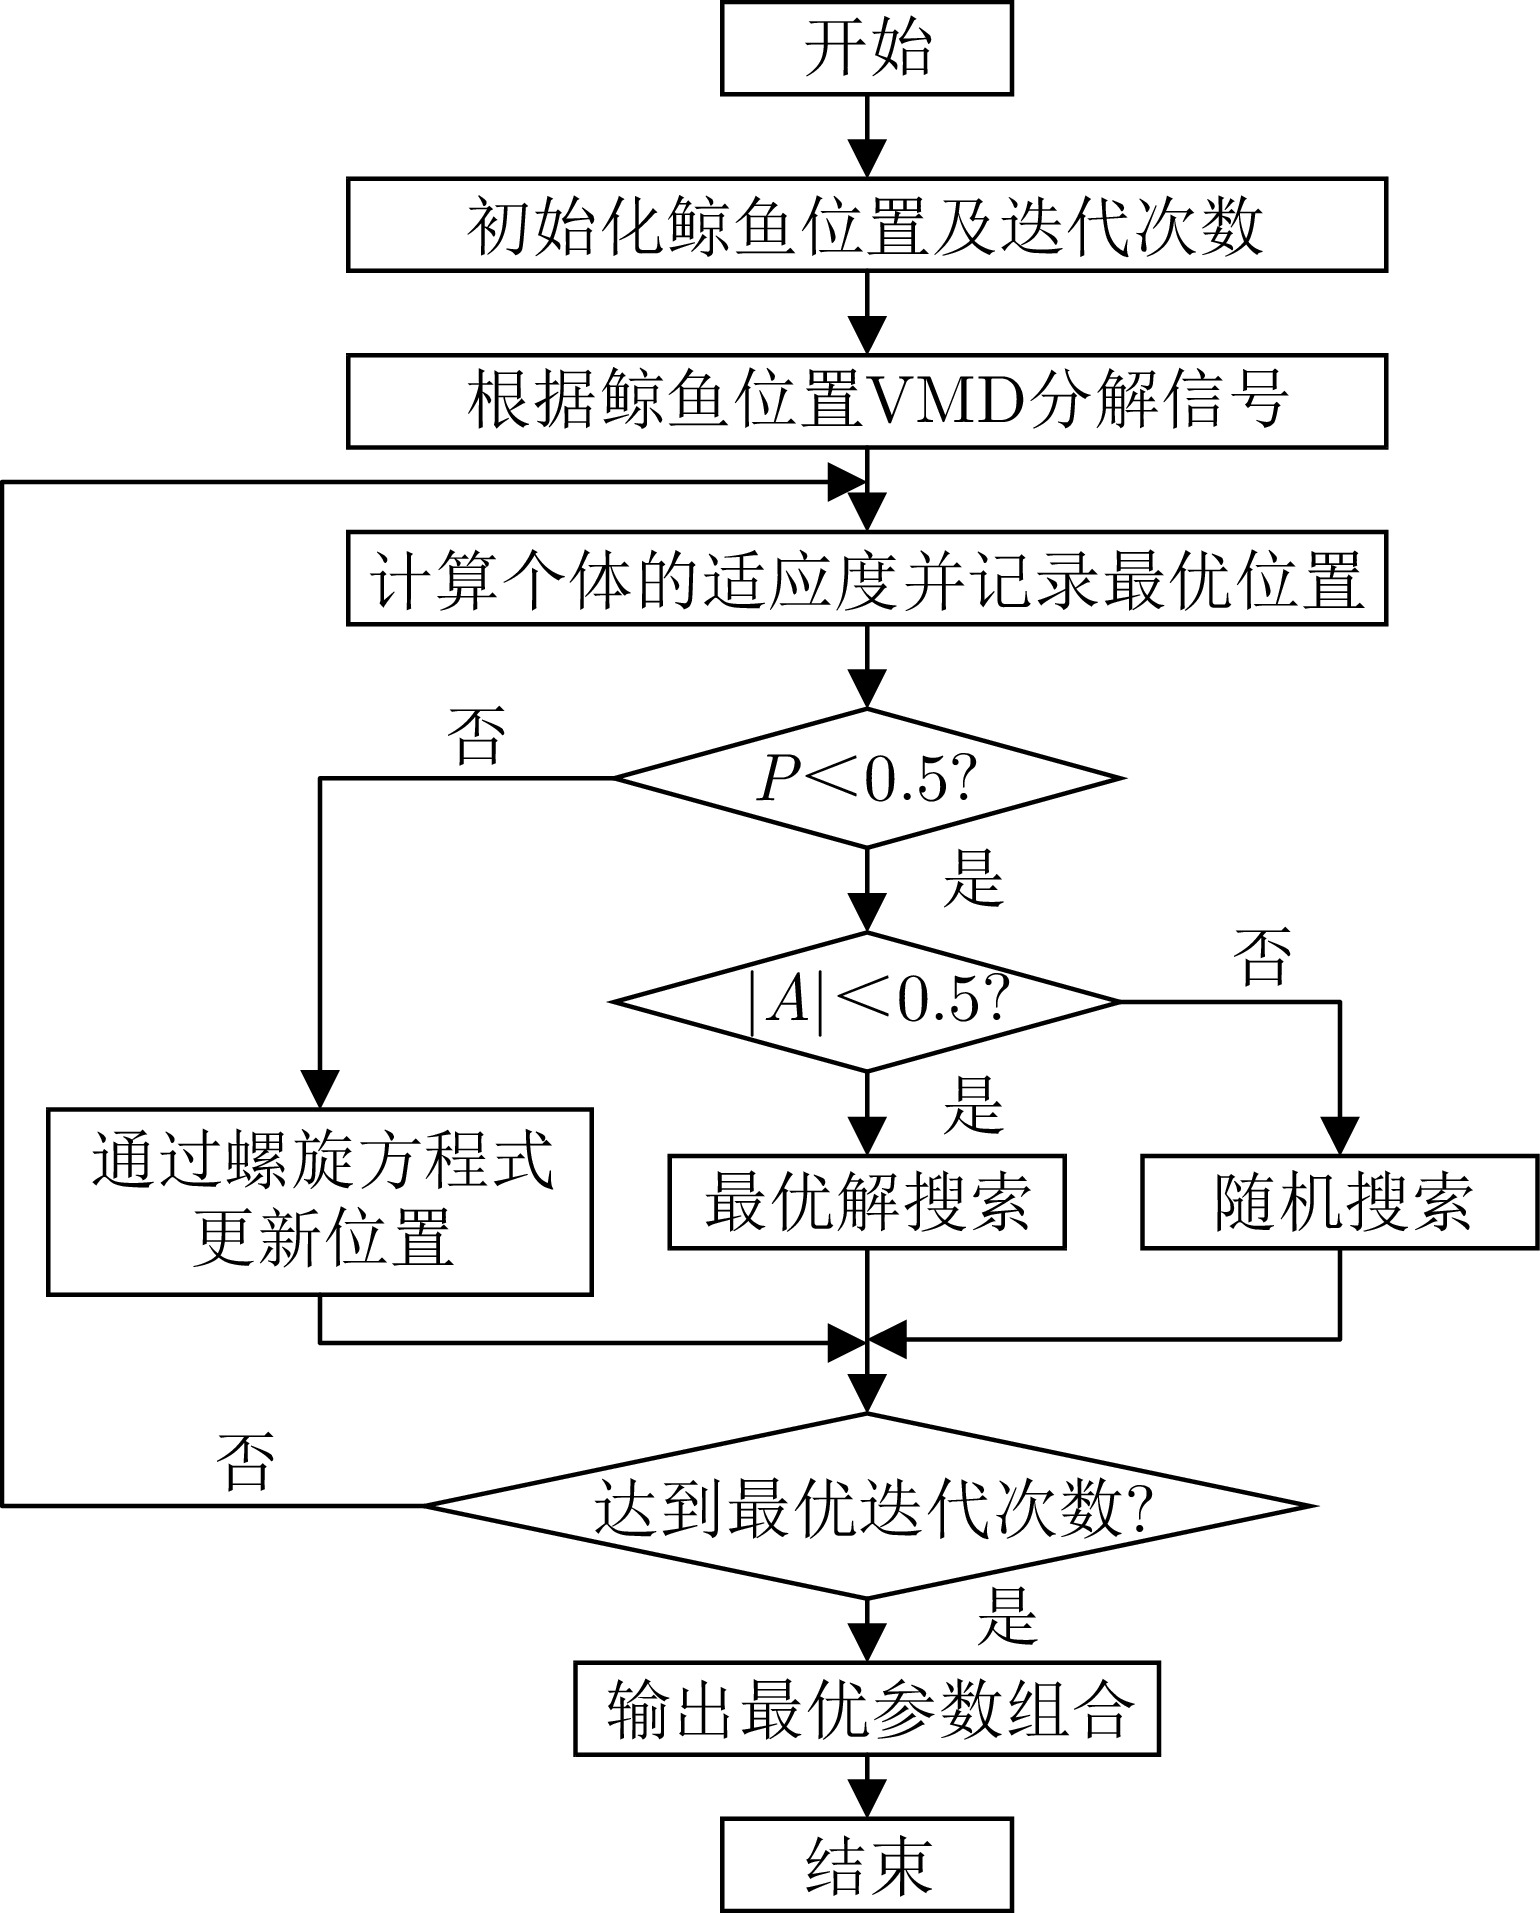
- Figure 10. Flow of VMD-WOA algorithm[58]
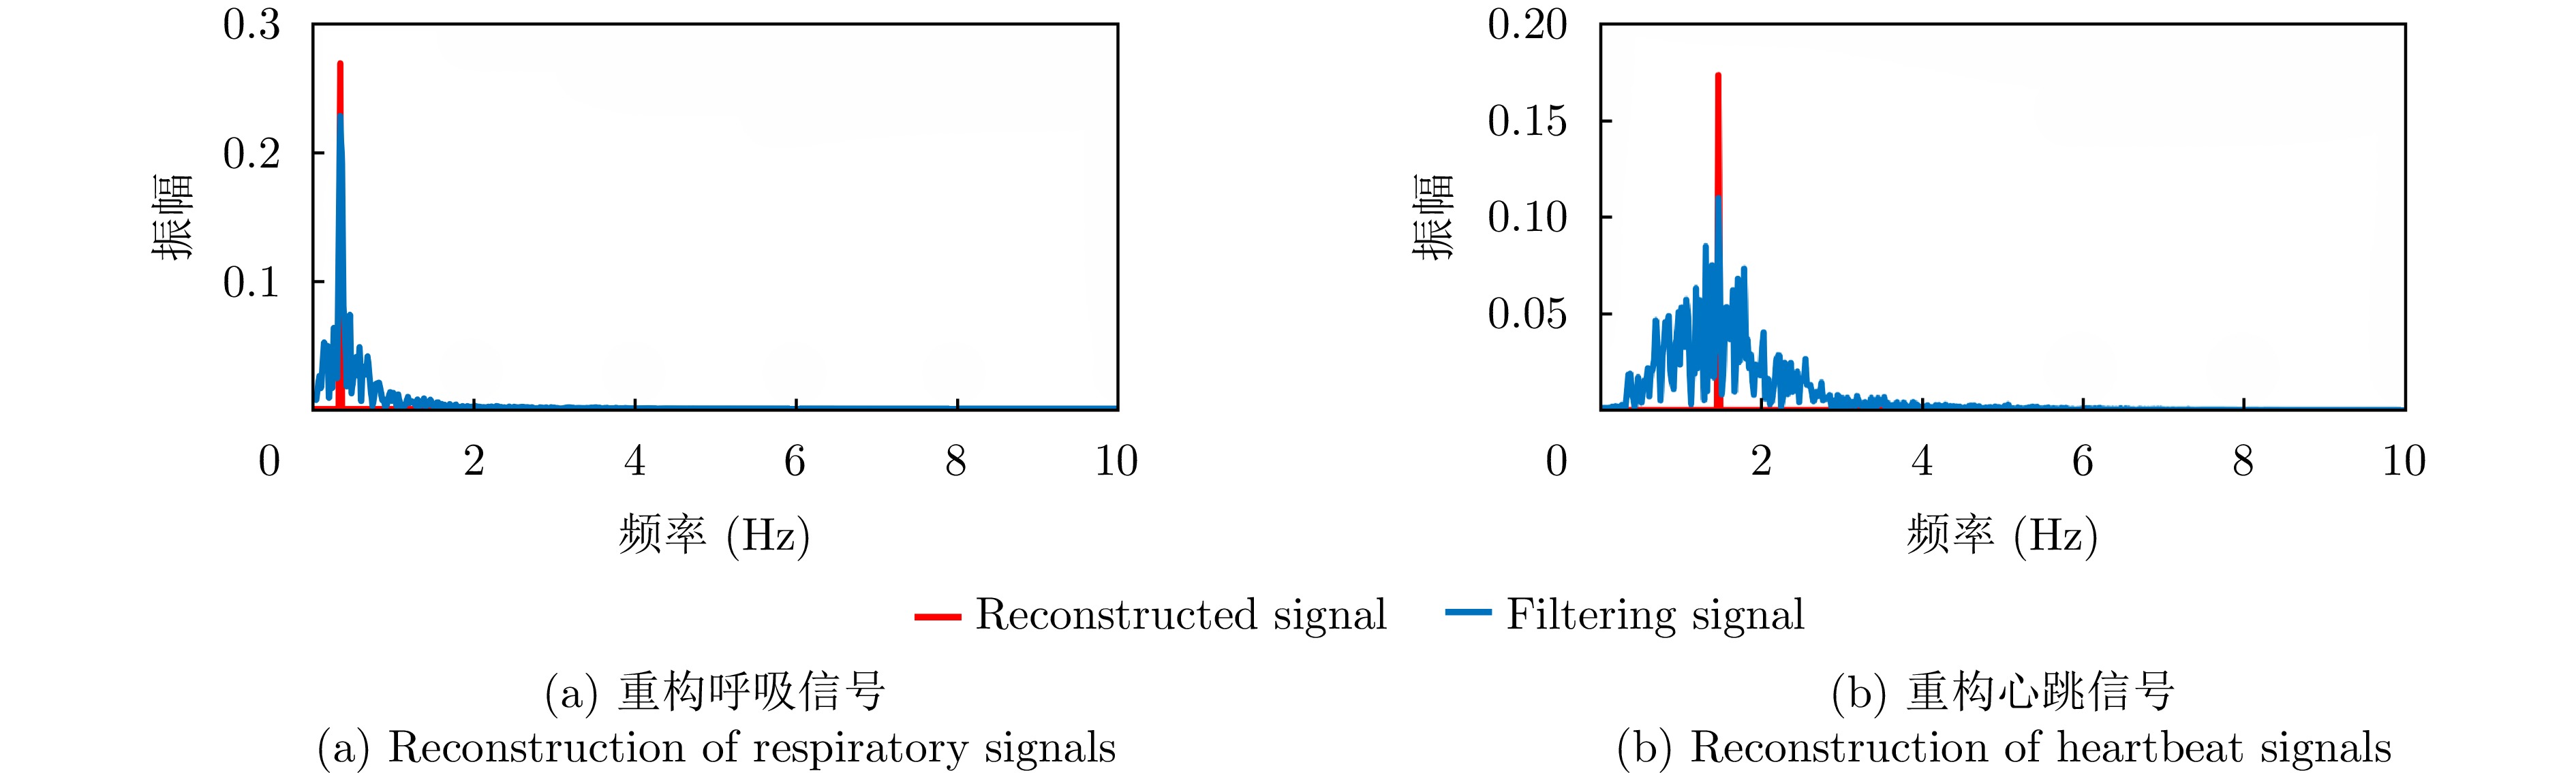
- Figure 11. Spectrogram of reconstructed signal from Ref. [63]
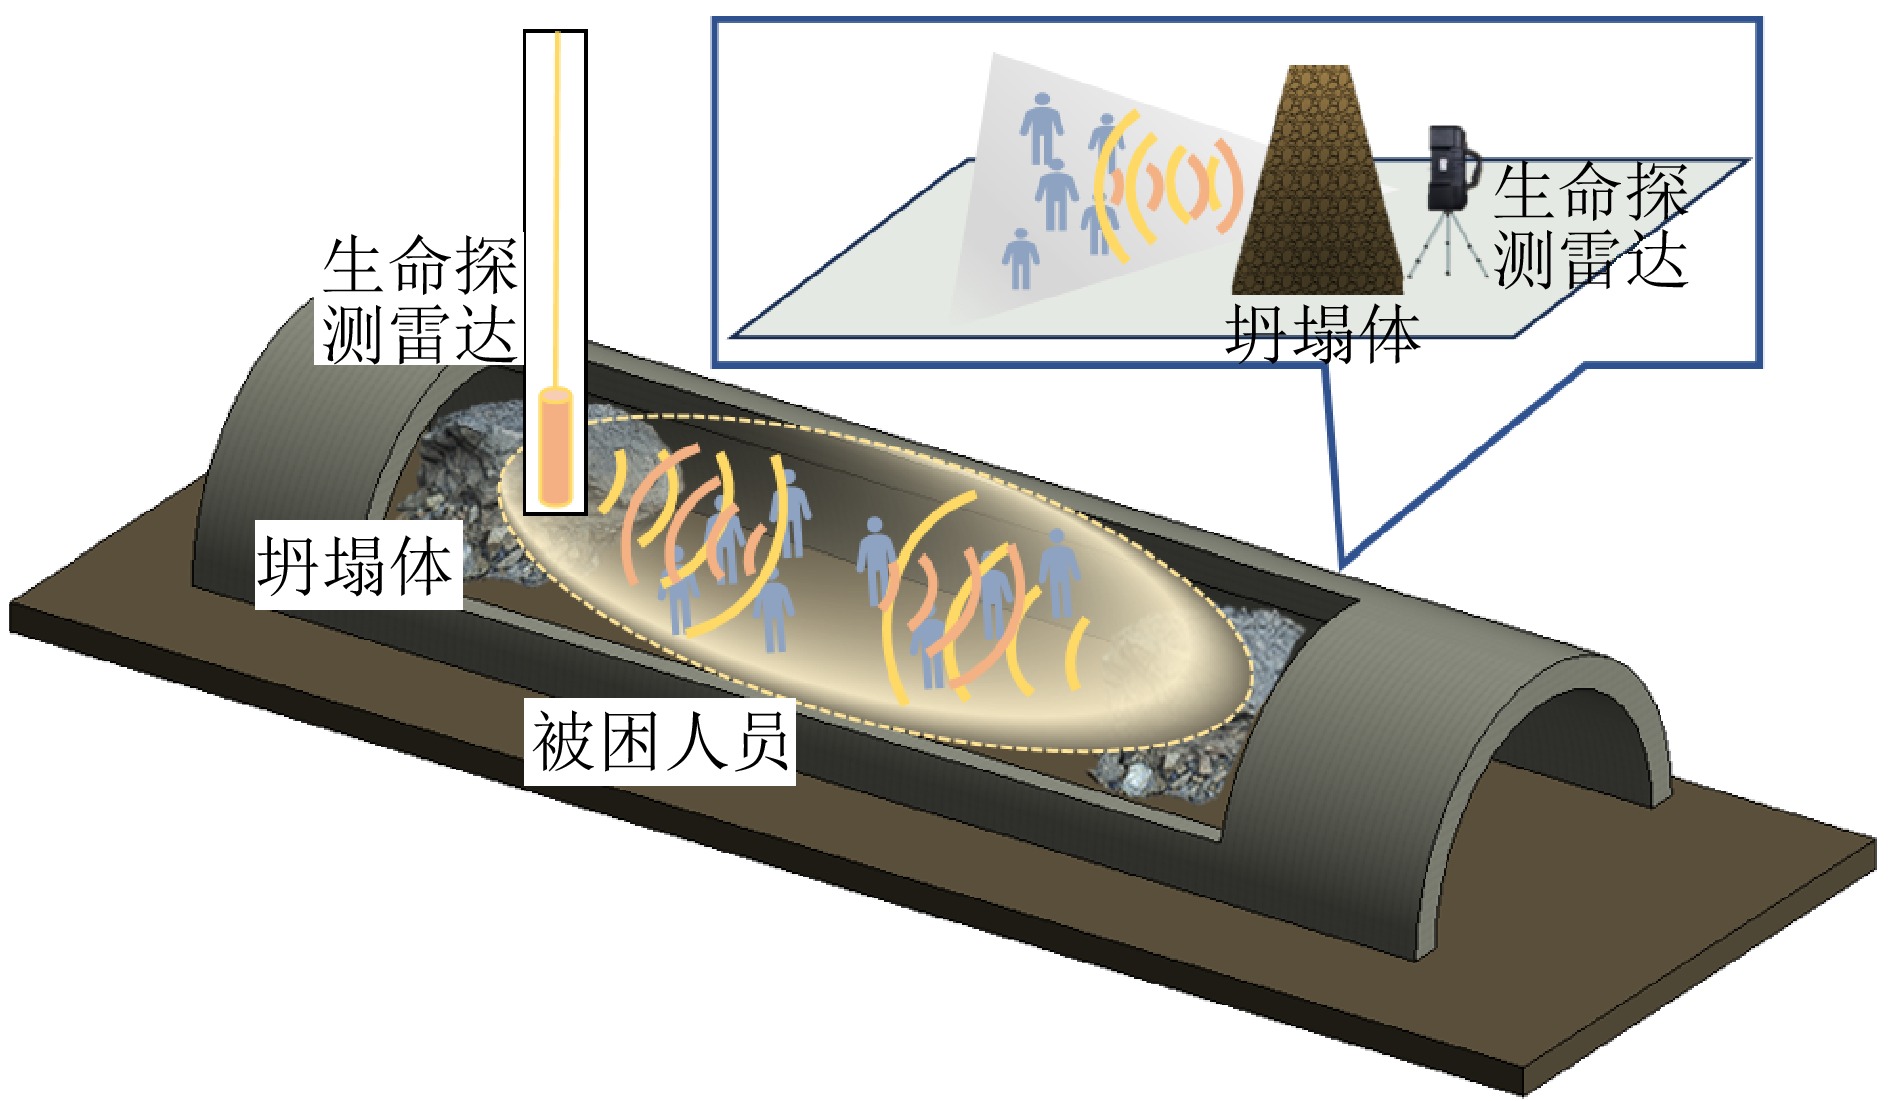
- Figure 12. Schematic diagram of the application of UWB radar in mine rescue
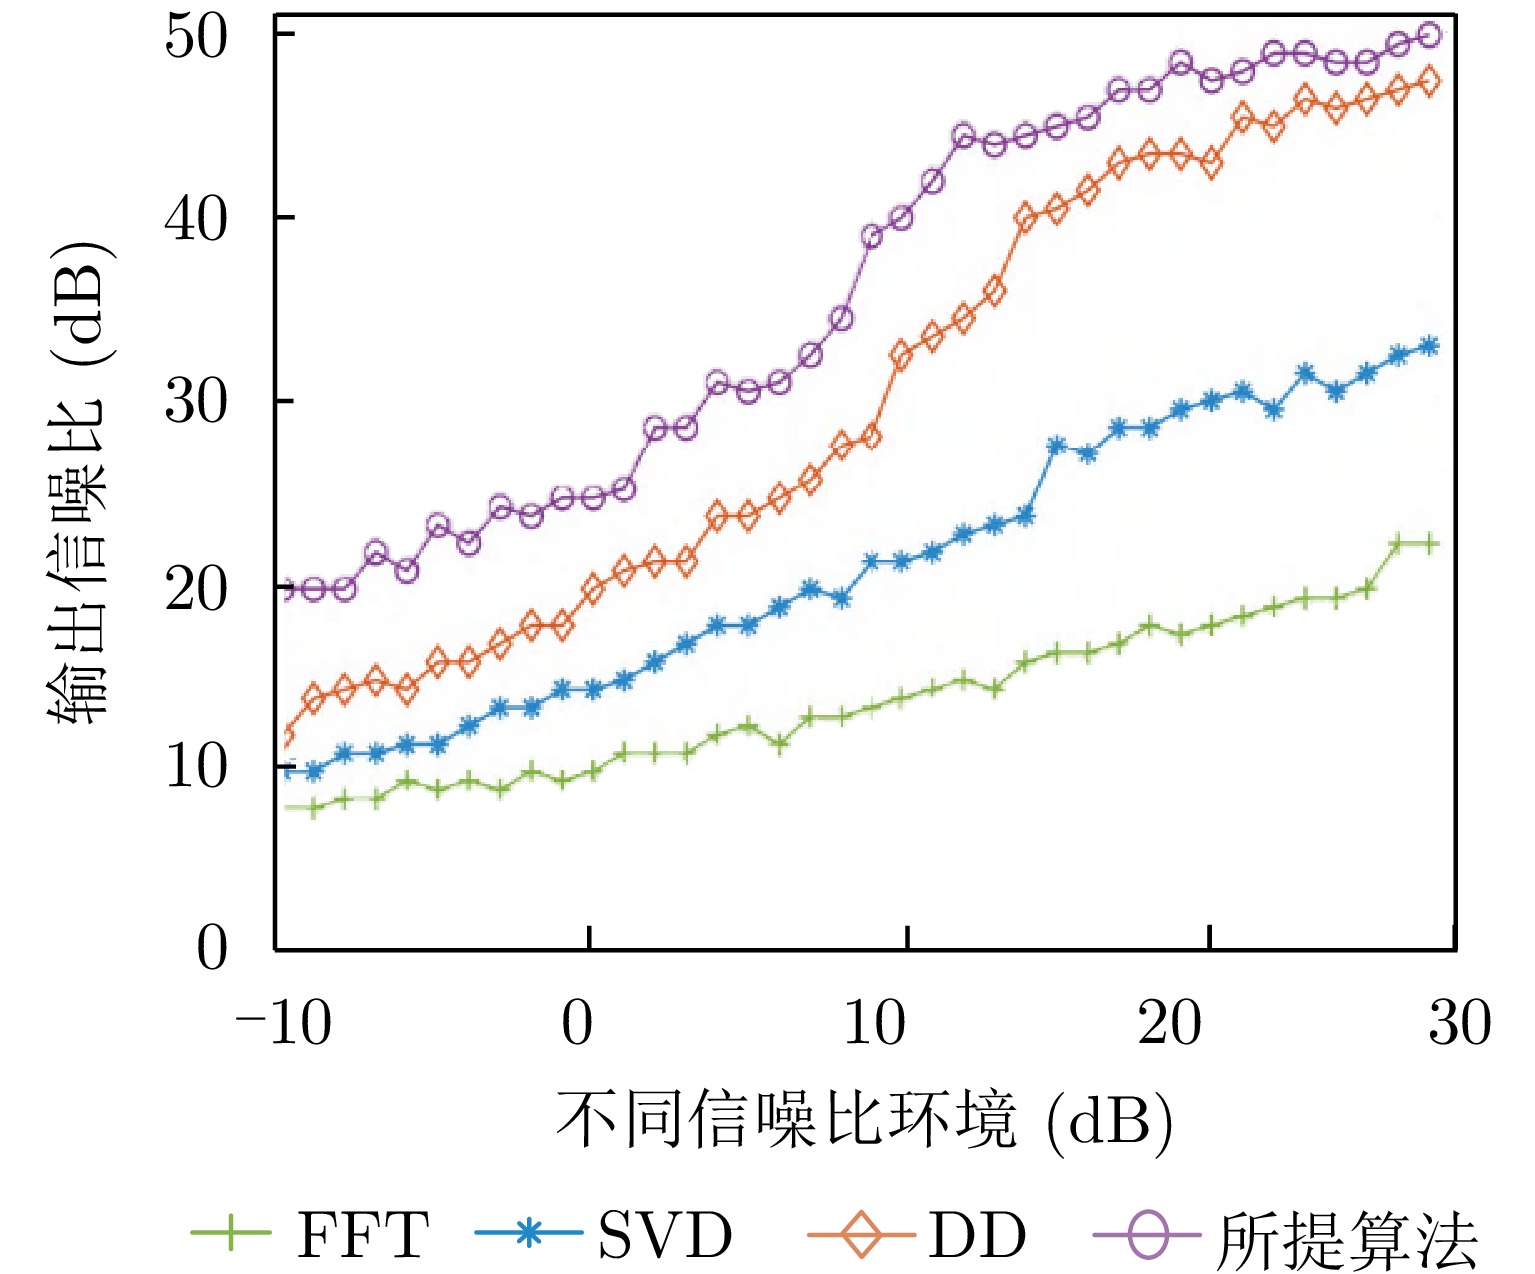
- Figure 13. Signal extraction performance of each algorithm in different SNR environments[74]
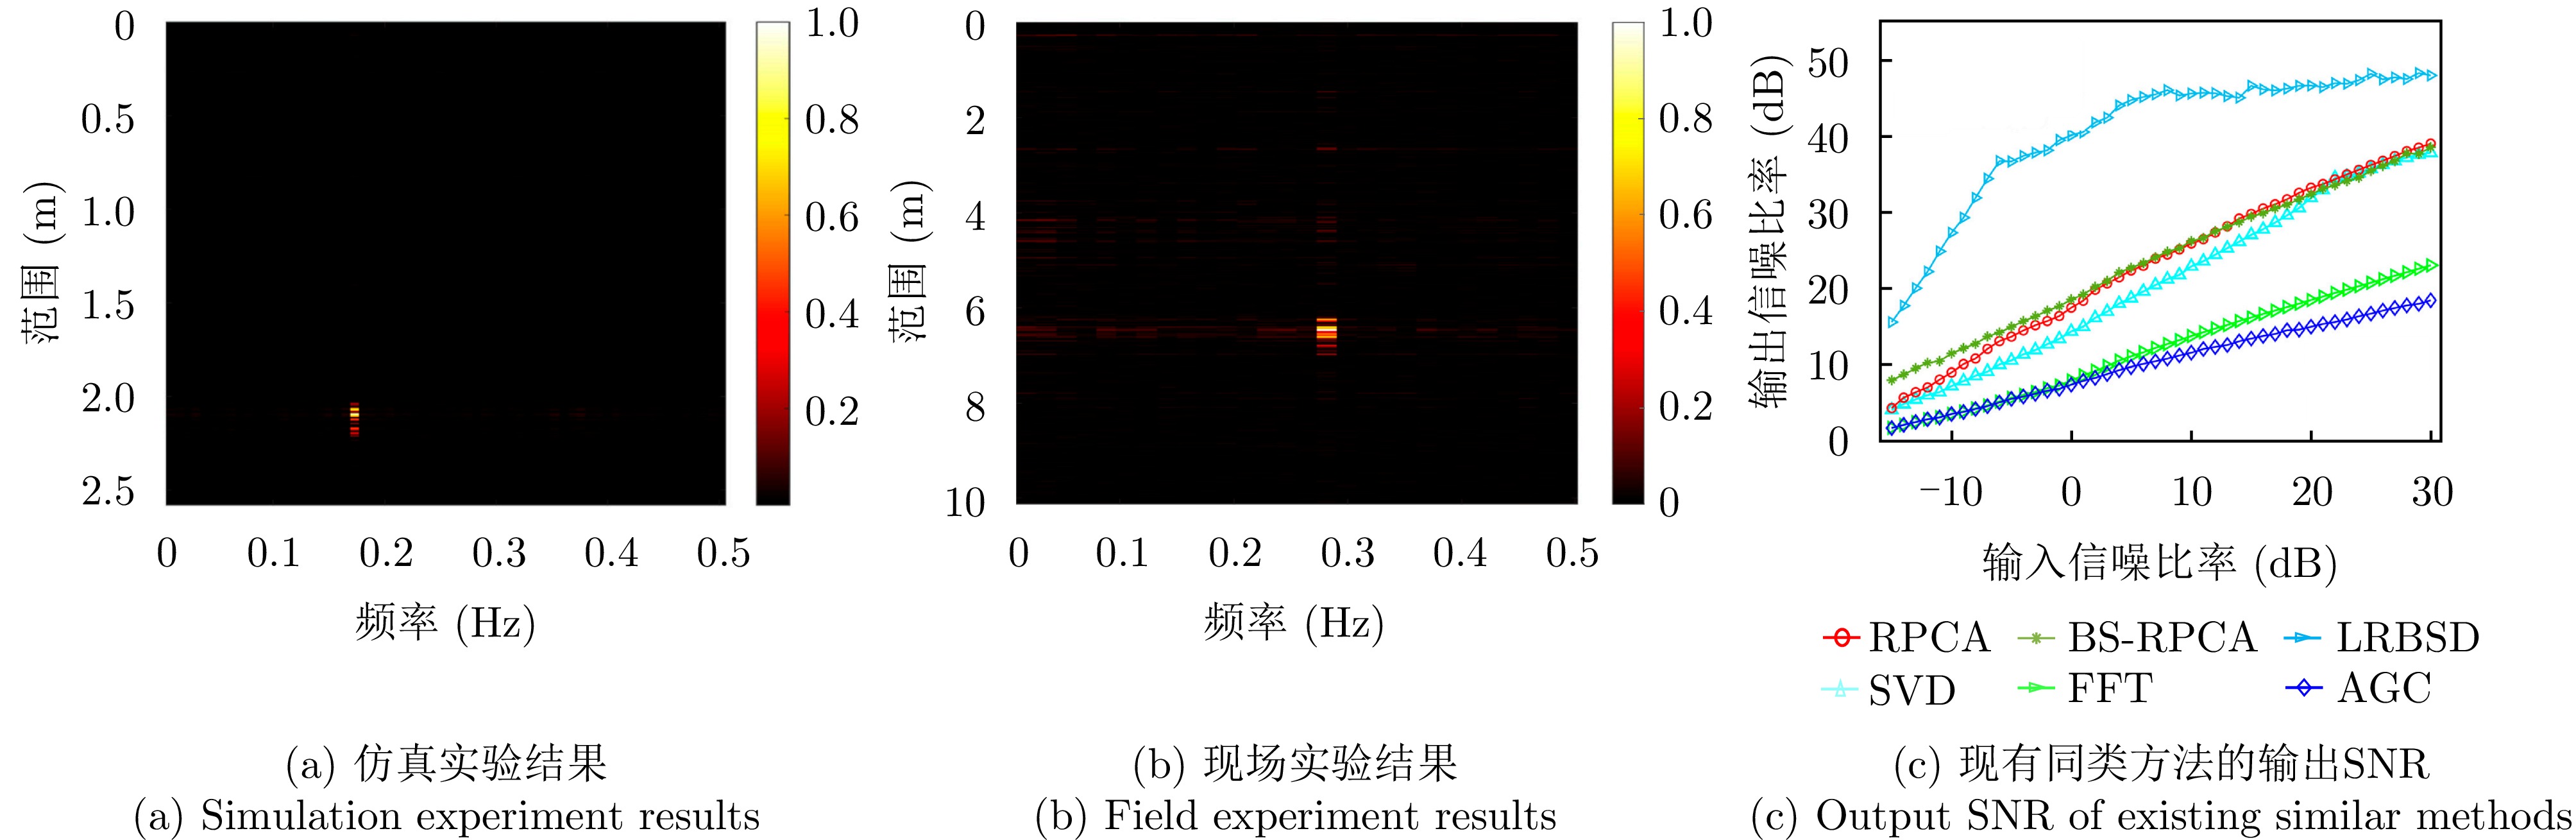
- Figure 14. Comparison of experimental results of Ref. [86] and existing similar methods
- Figure 15. Respiratory heartbeat separation effect of adaptive wavelet scale selection method[89]
- Figure 16. Comparison of the separation effect of the proposed method in Ref. [90] with contact sensor, bandpass filter, EMD algorithm and WT algorithm
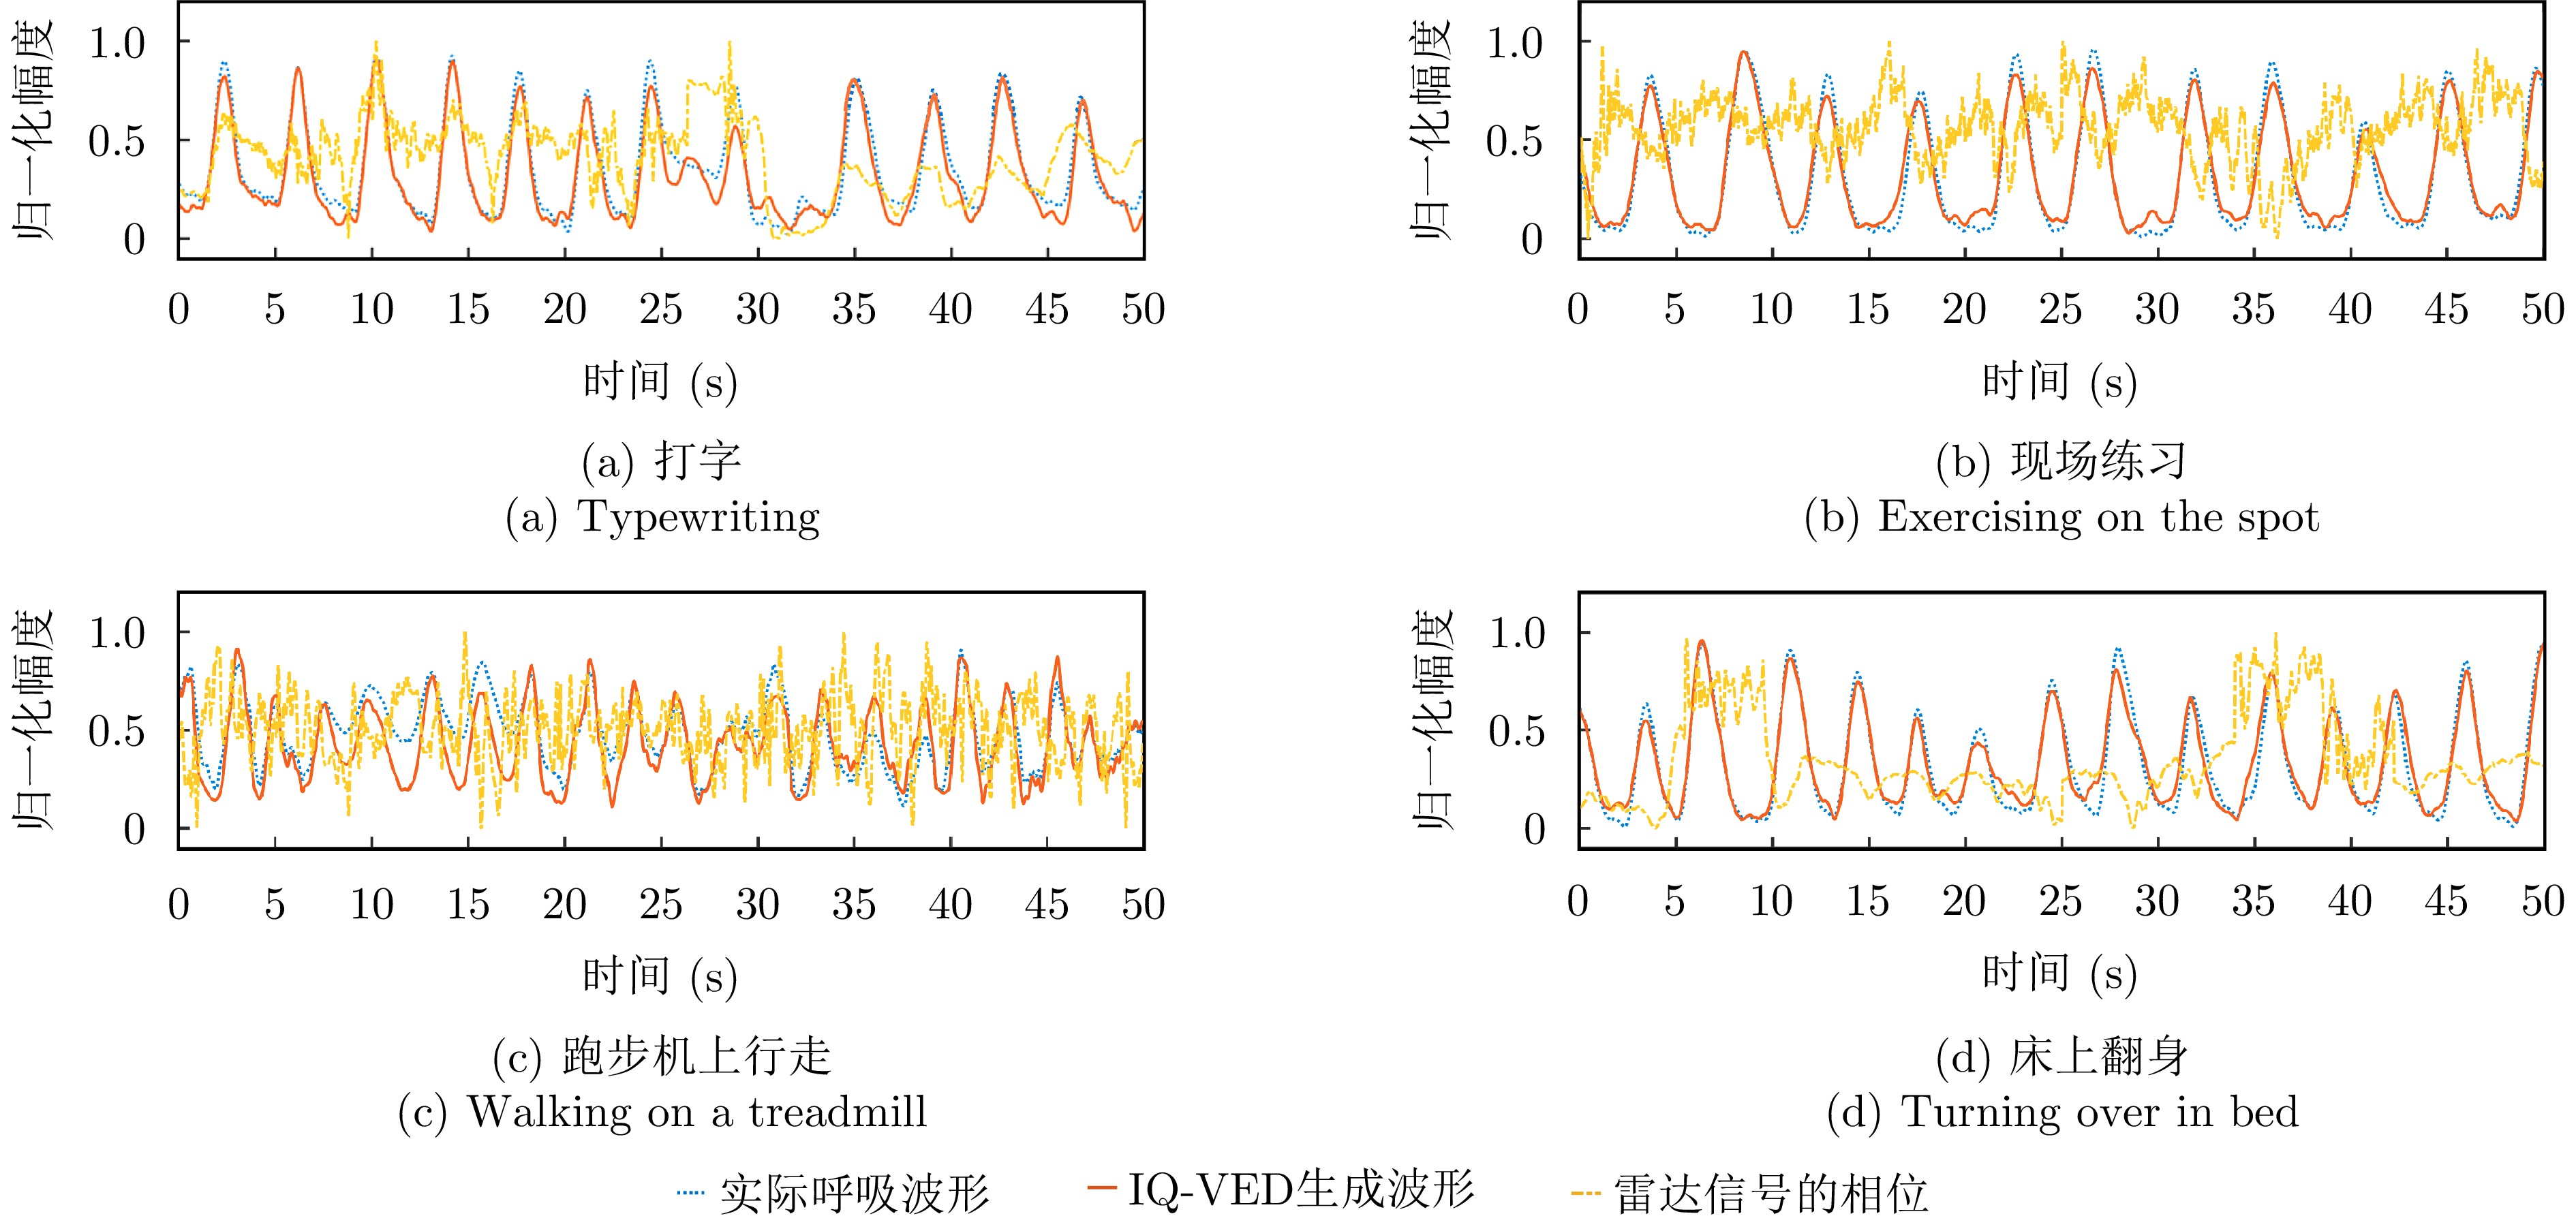
- Figure 17. Respiratory waveforms extracted from Ref. [93]
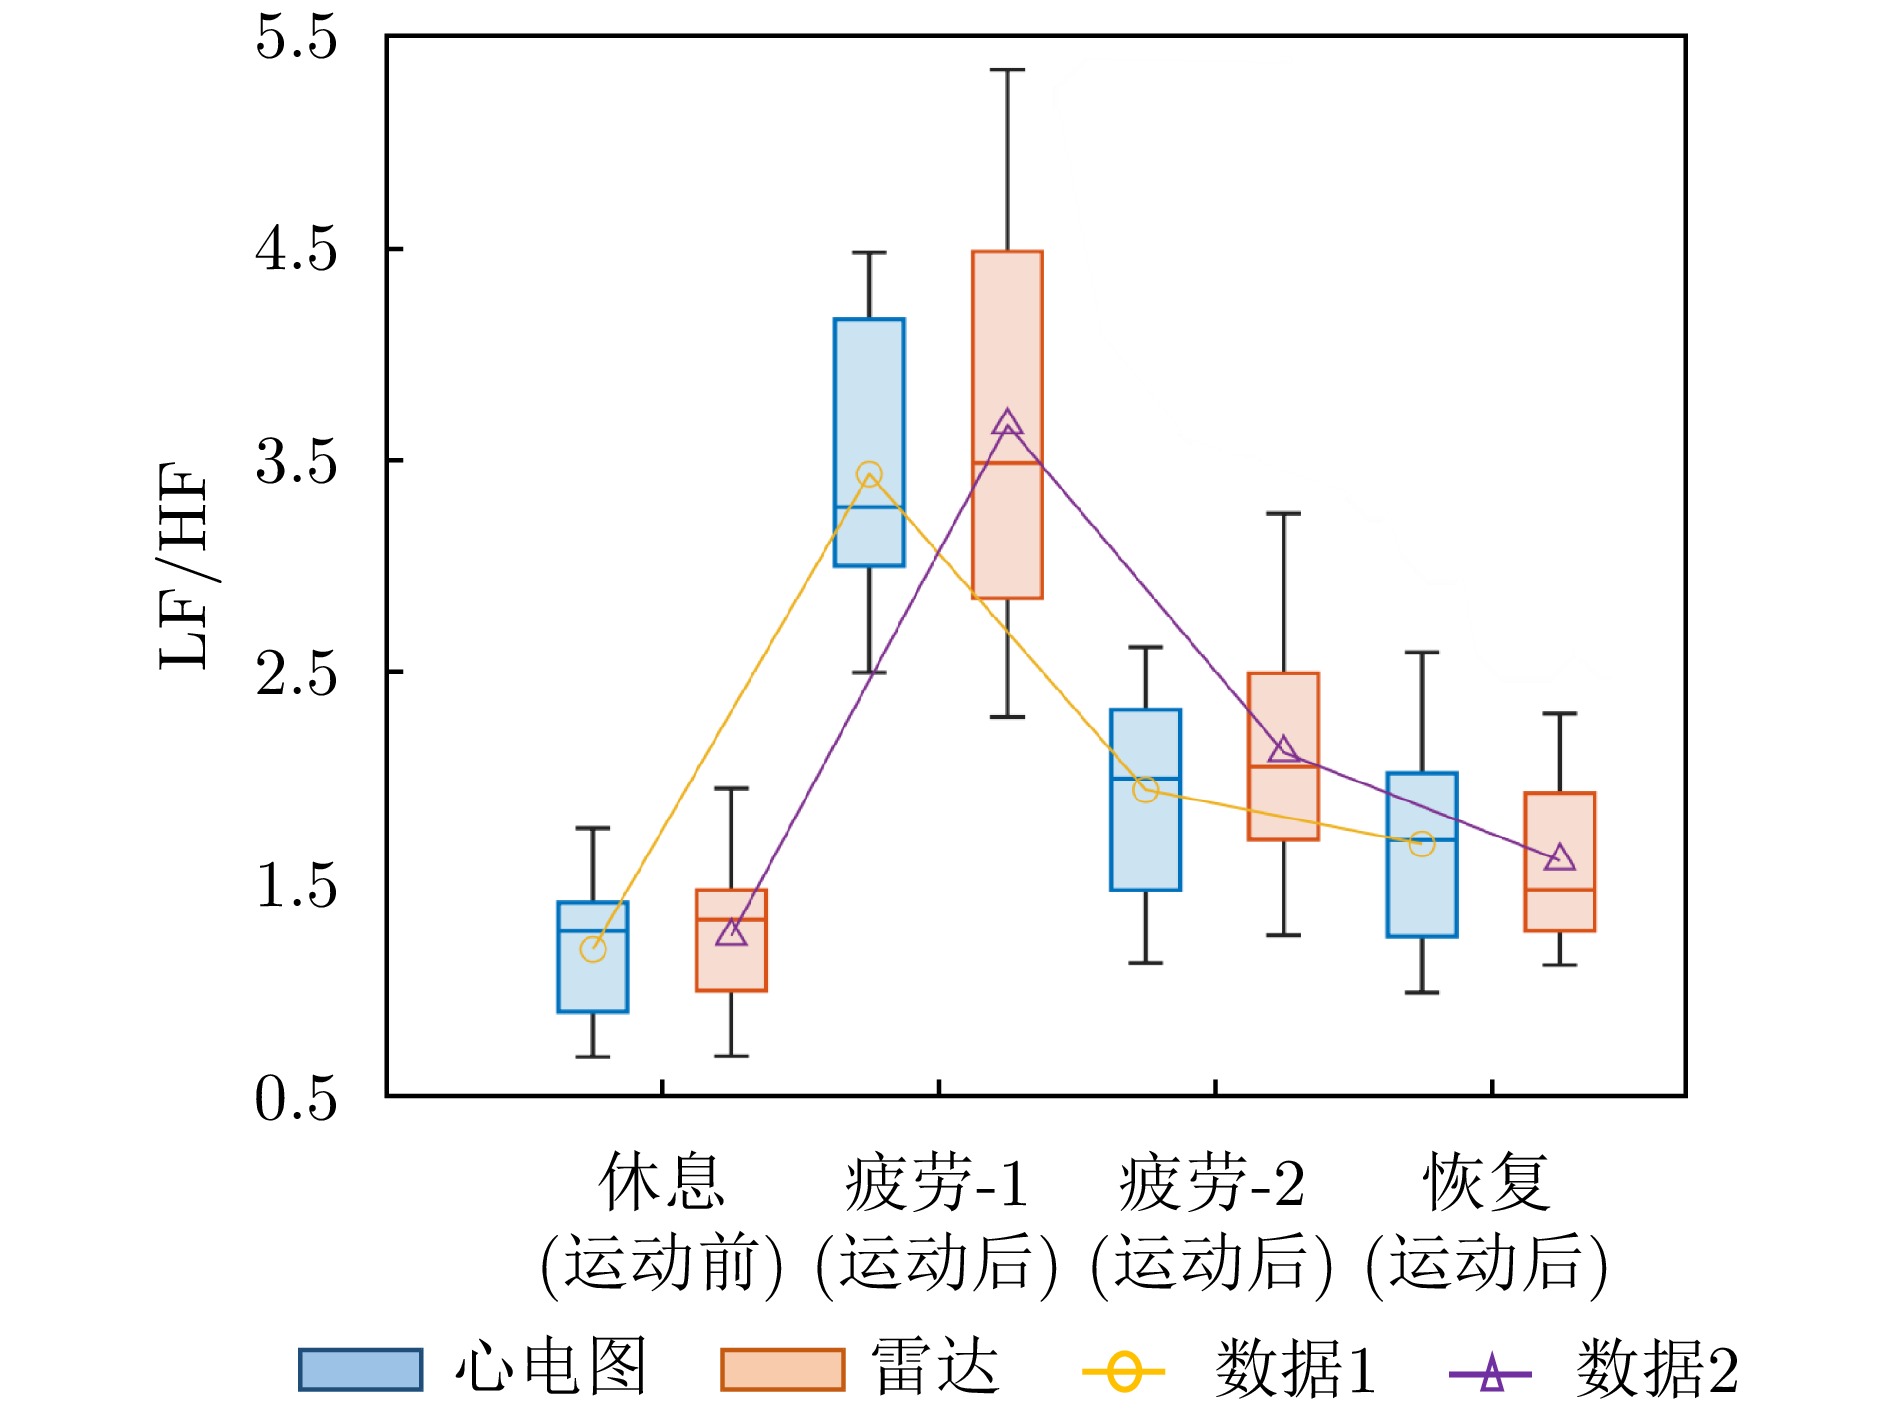
- Figure 18. Comparison of LF/HF ratio of heartbeat signals detected by radar and ECG in Ref. [97]
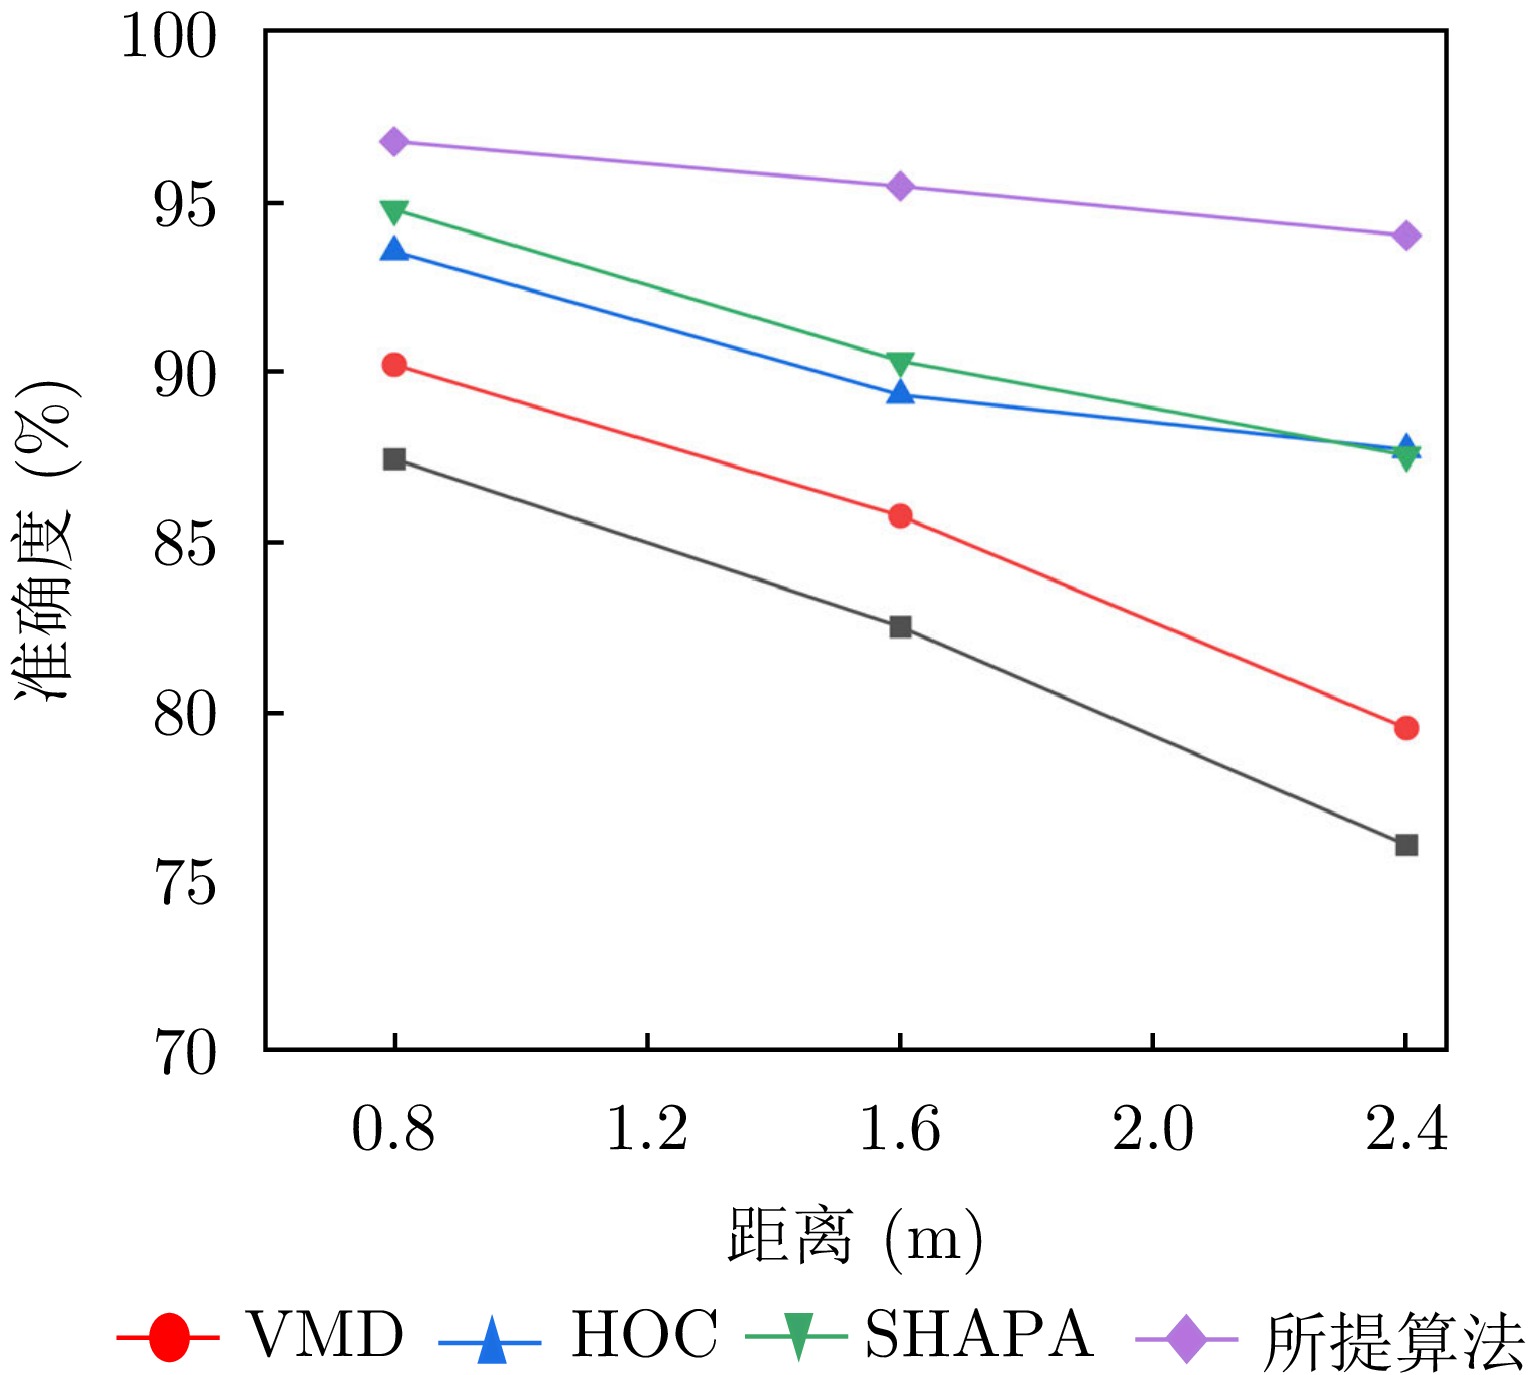
- Figure 19. Comparison of accuracy of extracting heartbeat signals between the proposed method in Ref. [33] and existing methods
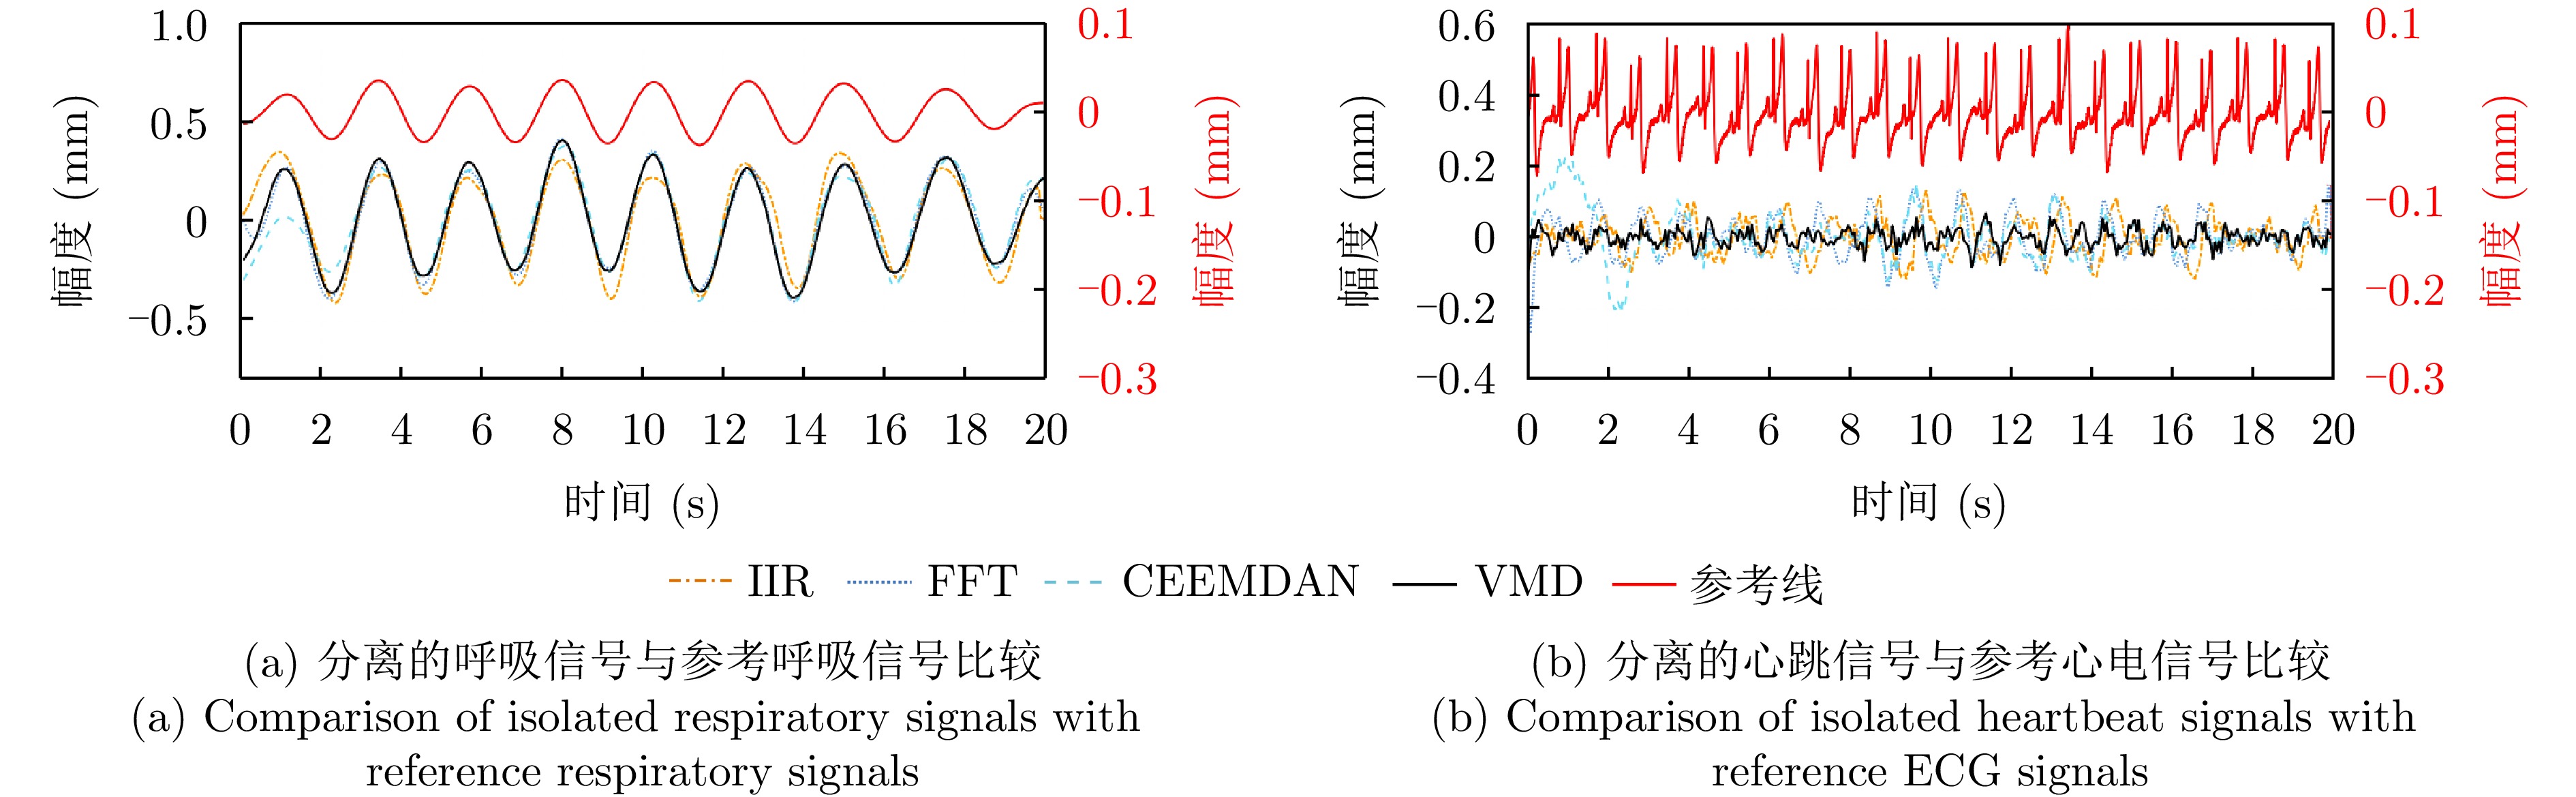
- Figure 20. Comparison of the effectiveness of the proposed method in Ref. [21] with IIR, FFT and CEEMDAN for the separation of respiratory heartbeat signals
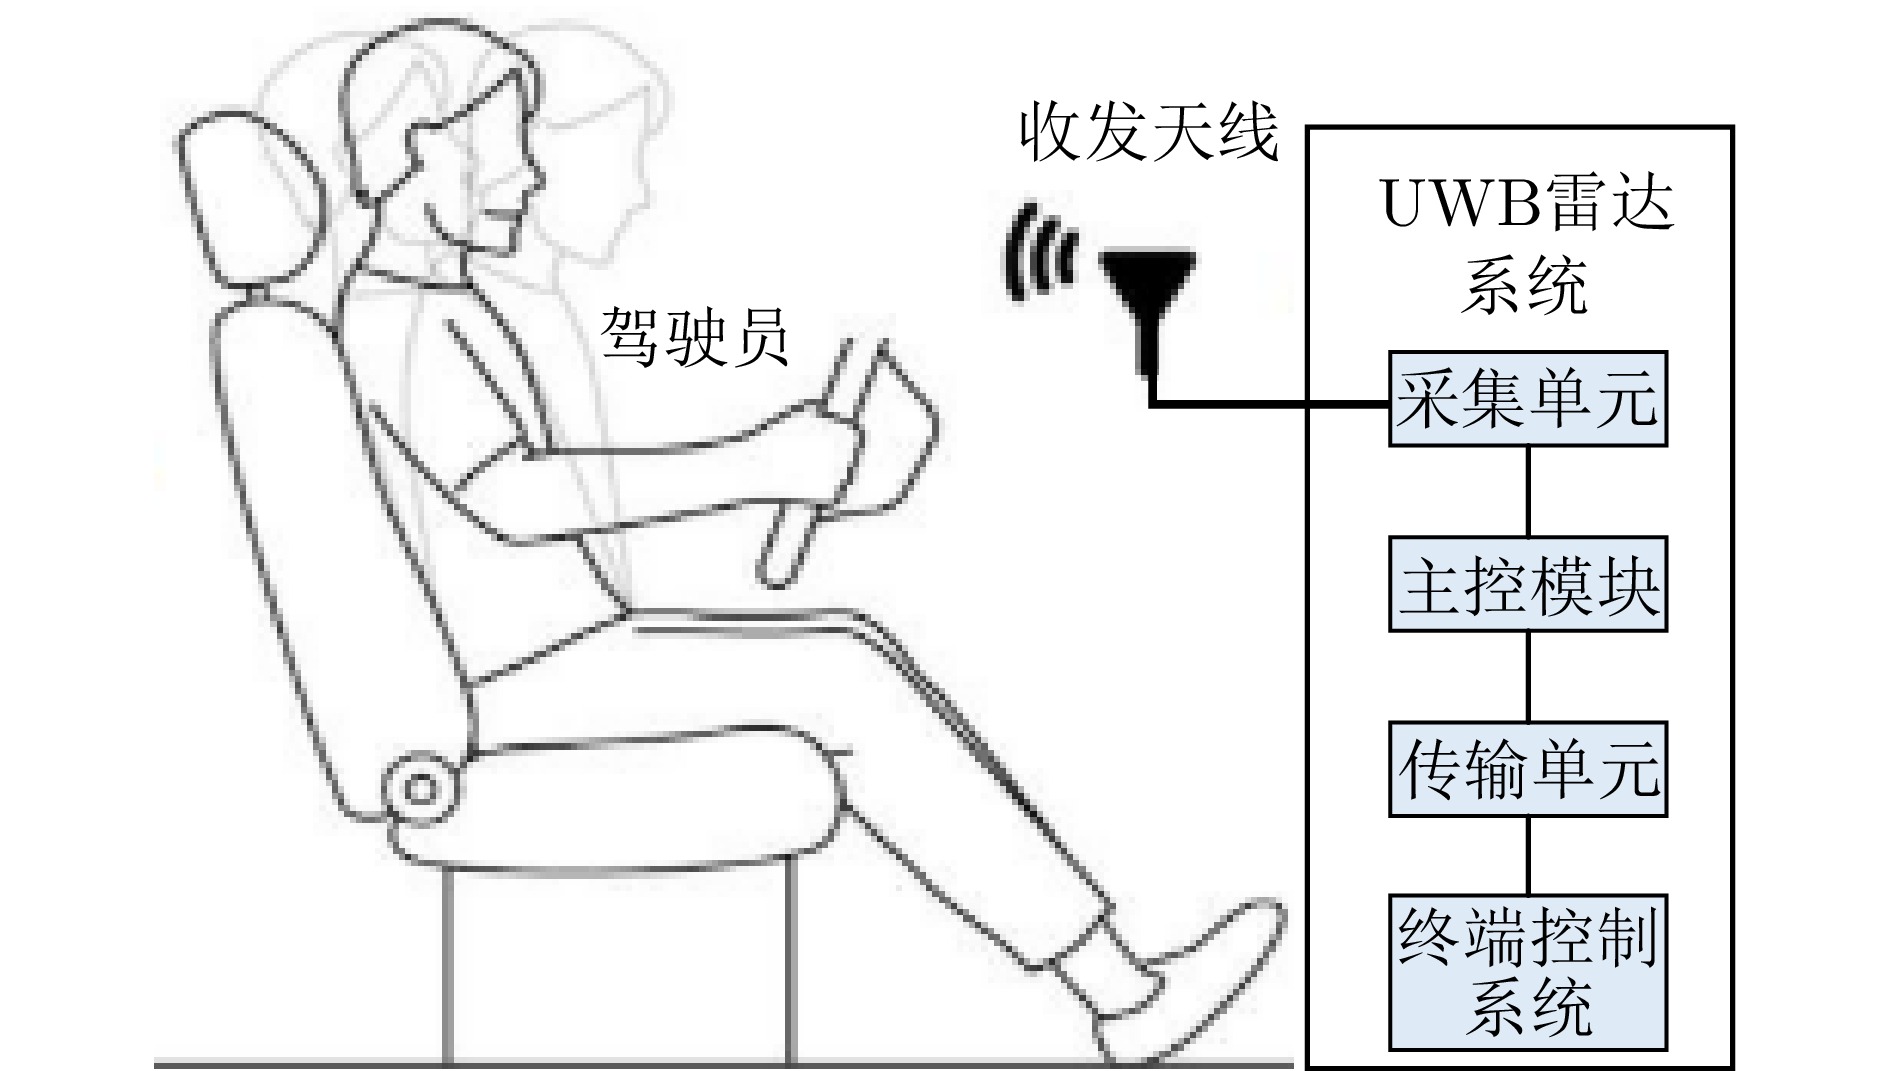
- Figure 21. Application of UWB radar to monitor driver status
- Figure 22. Ref. [102] detection results