MPOLSAR-1.0: Multidimensional SAR Multiband Fully Polarized Fine Classification Dataset(in English)
-
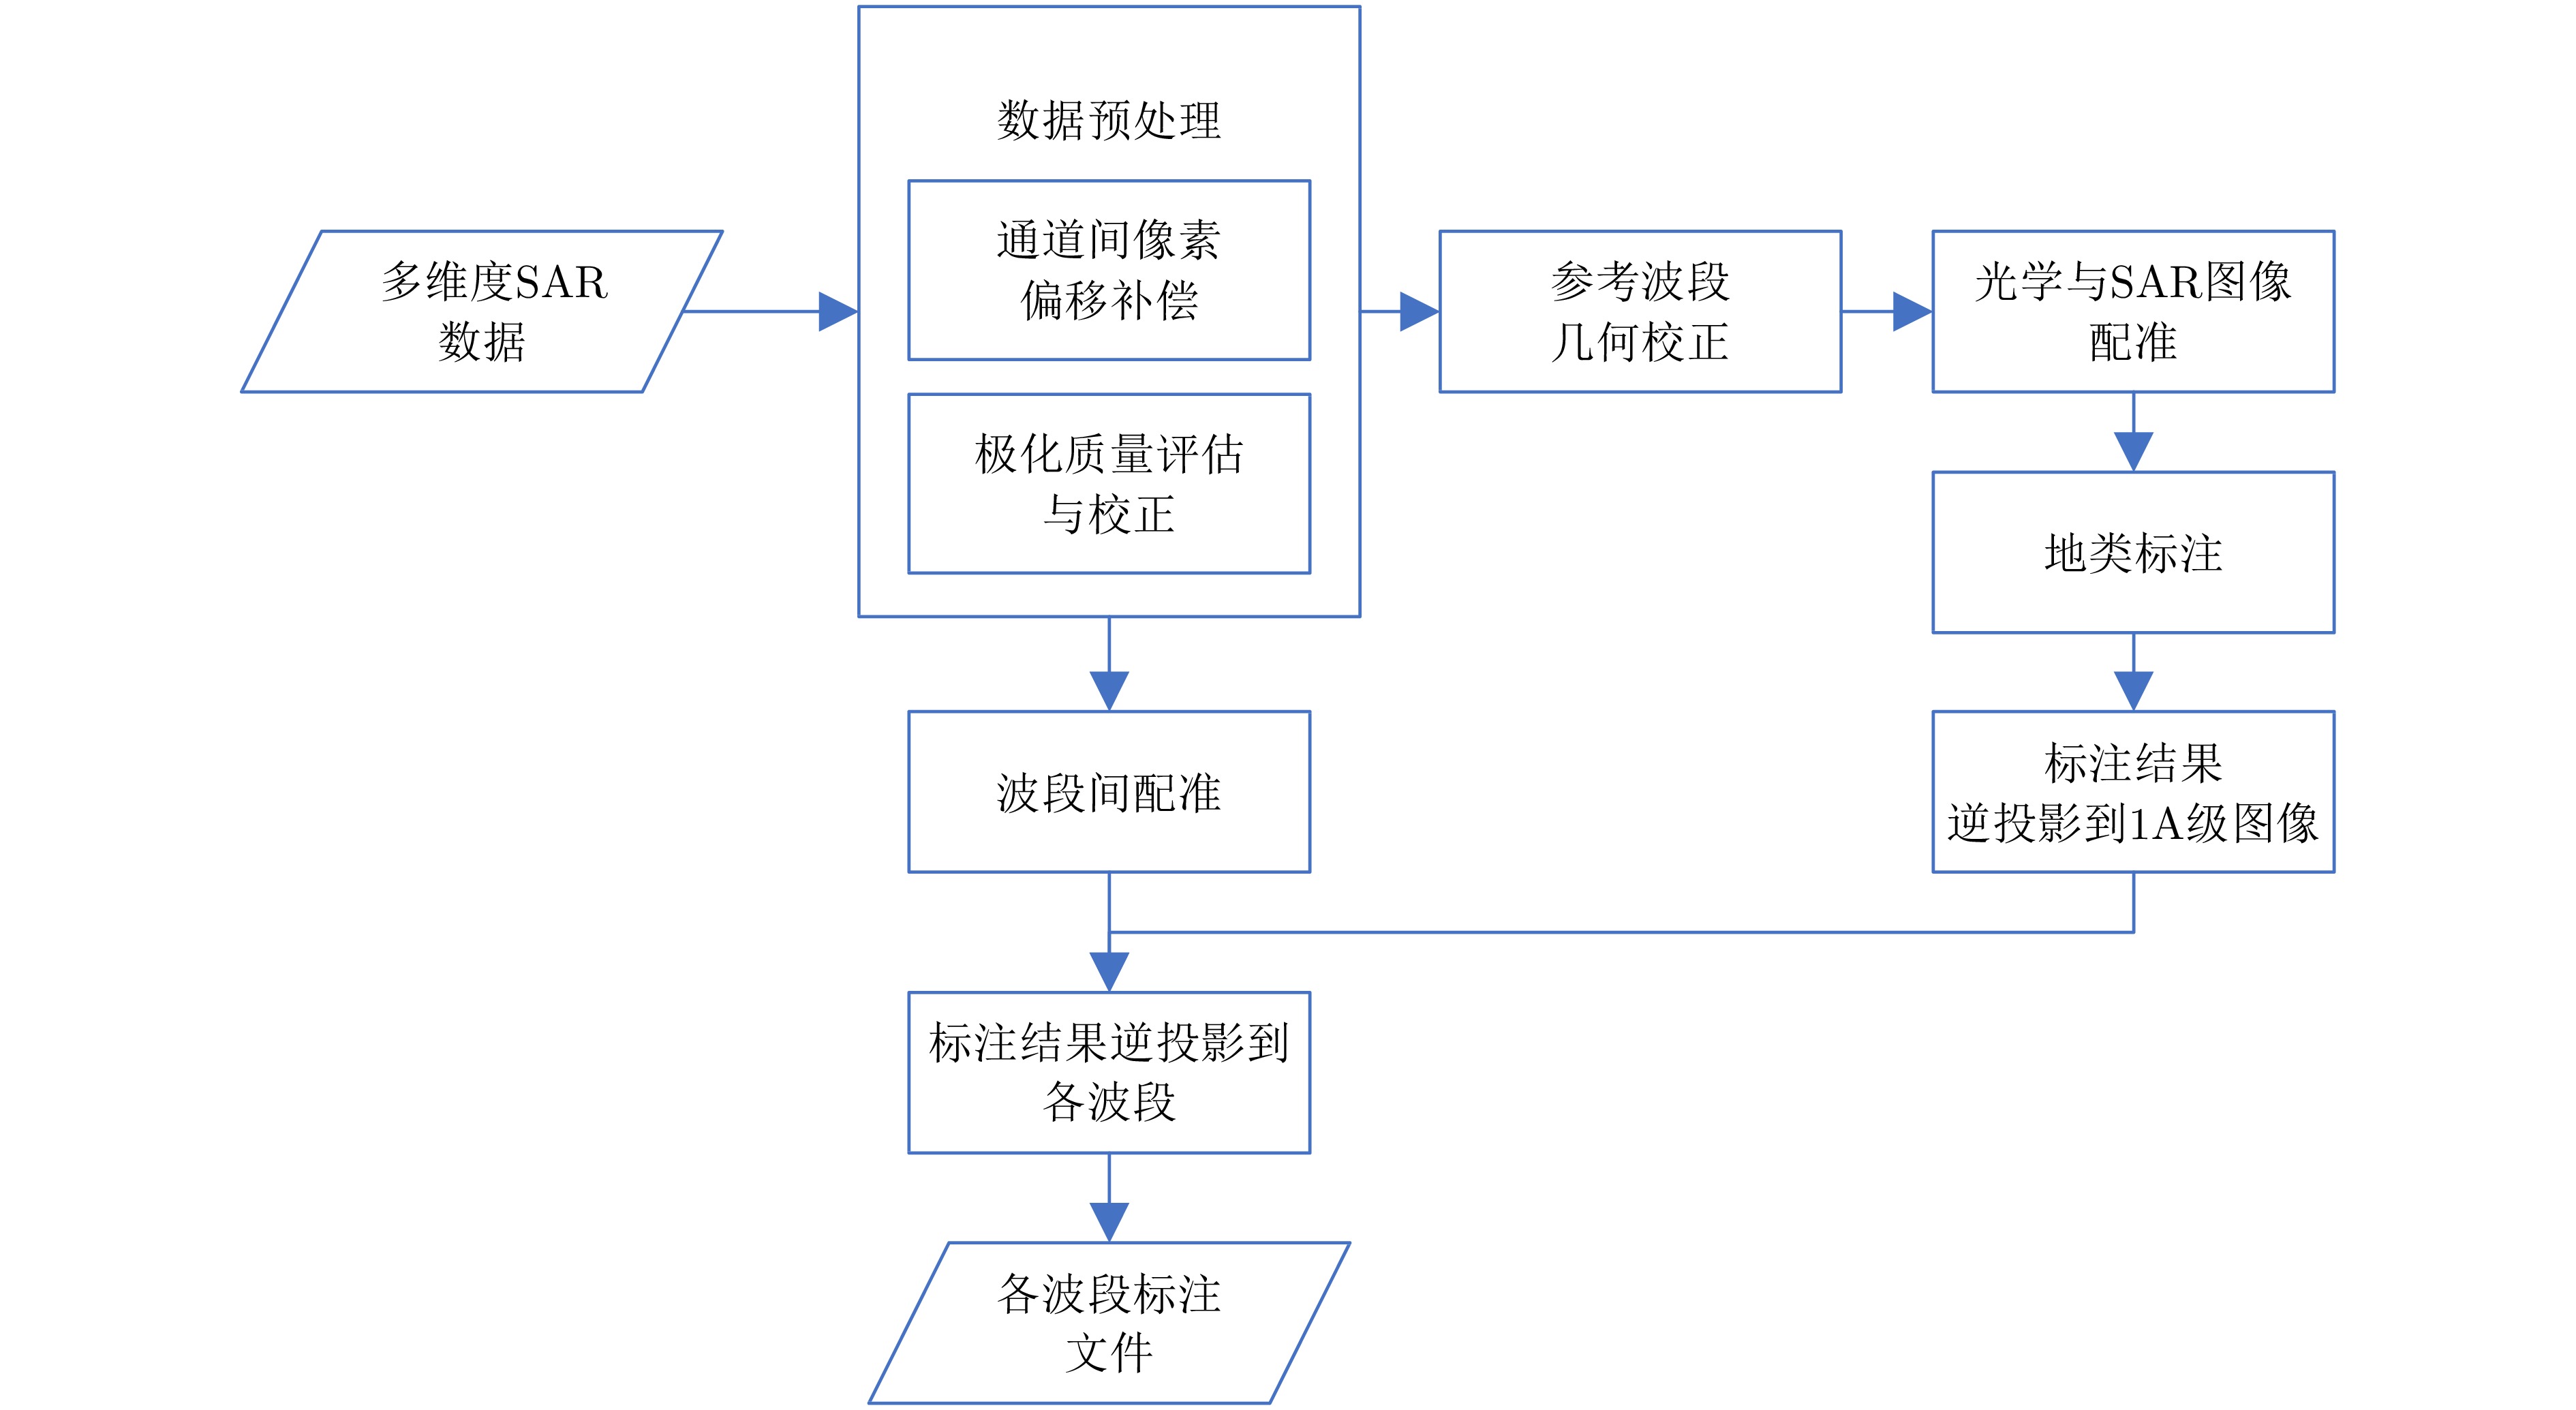
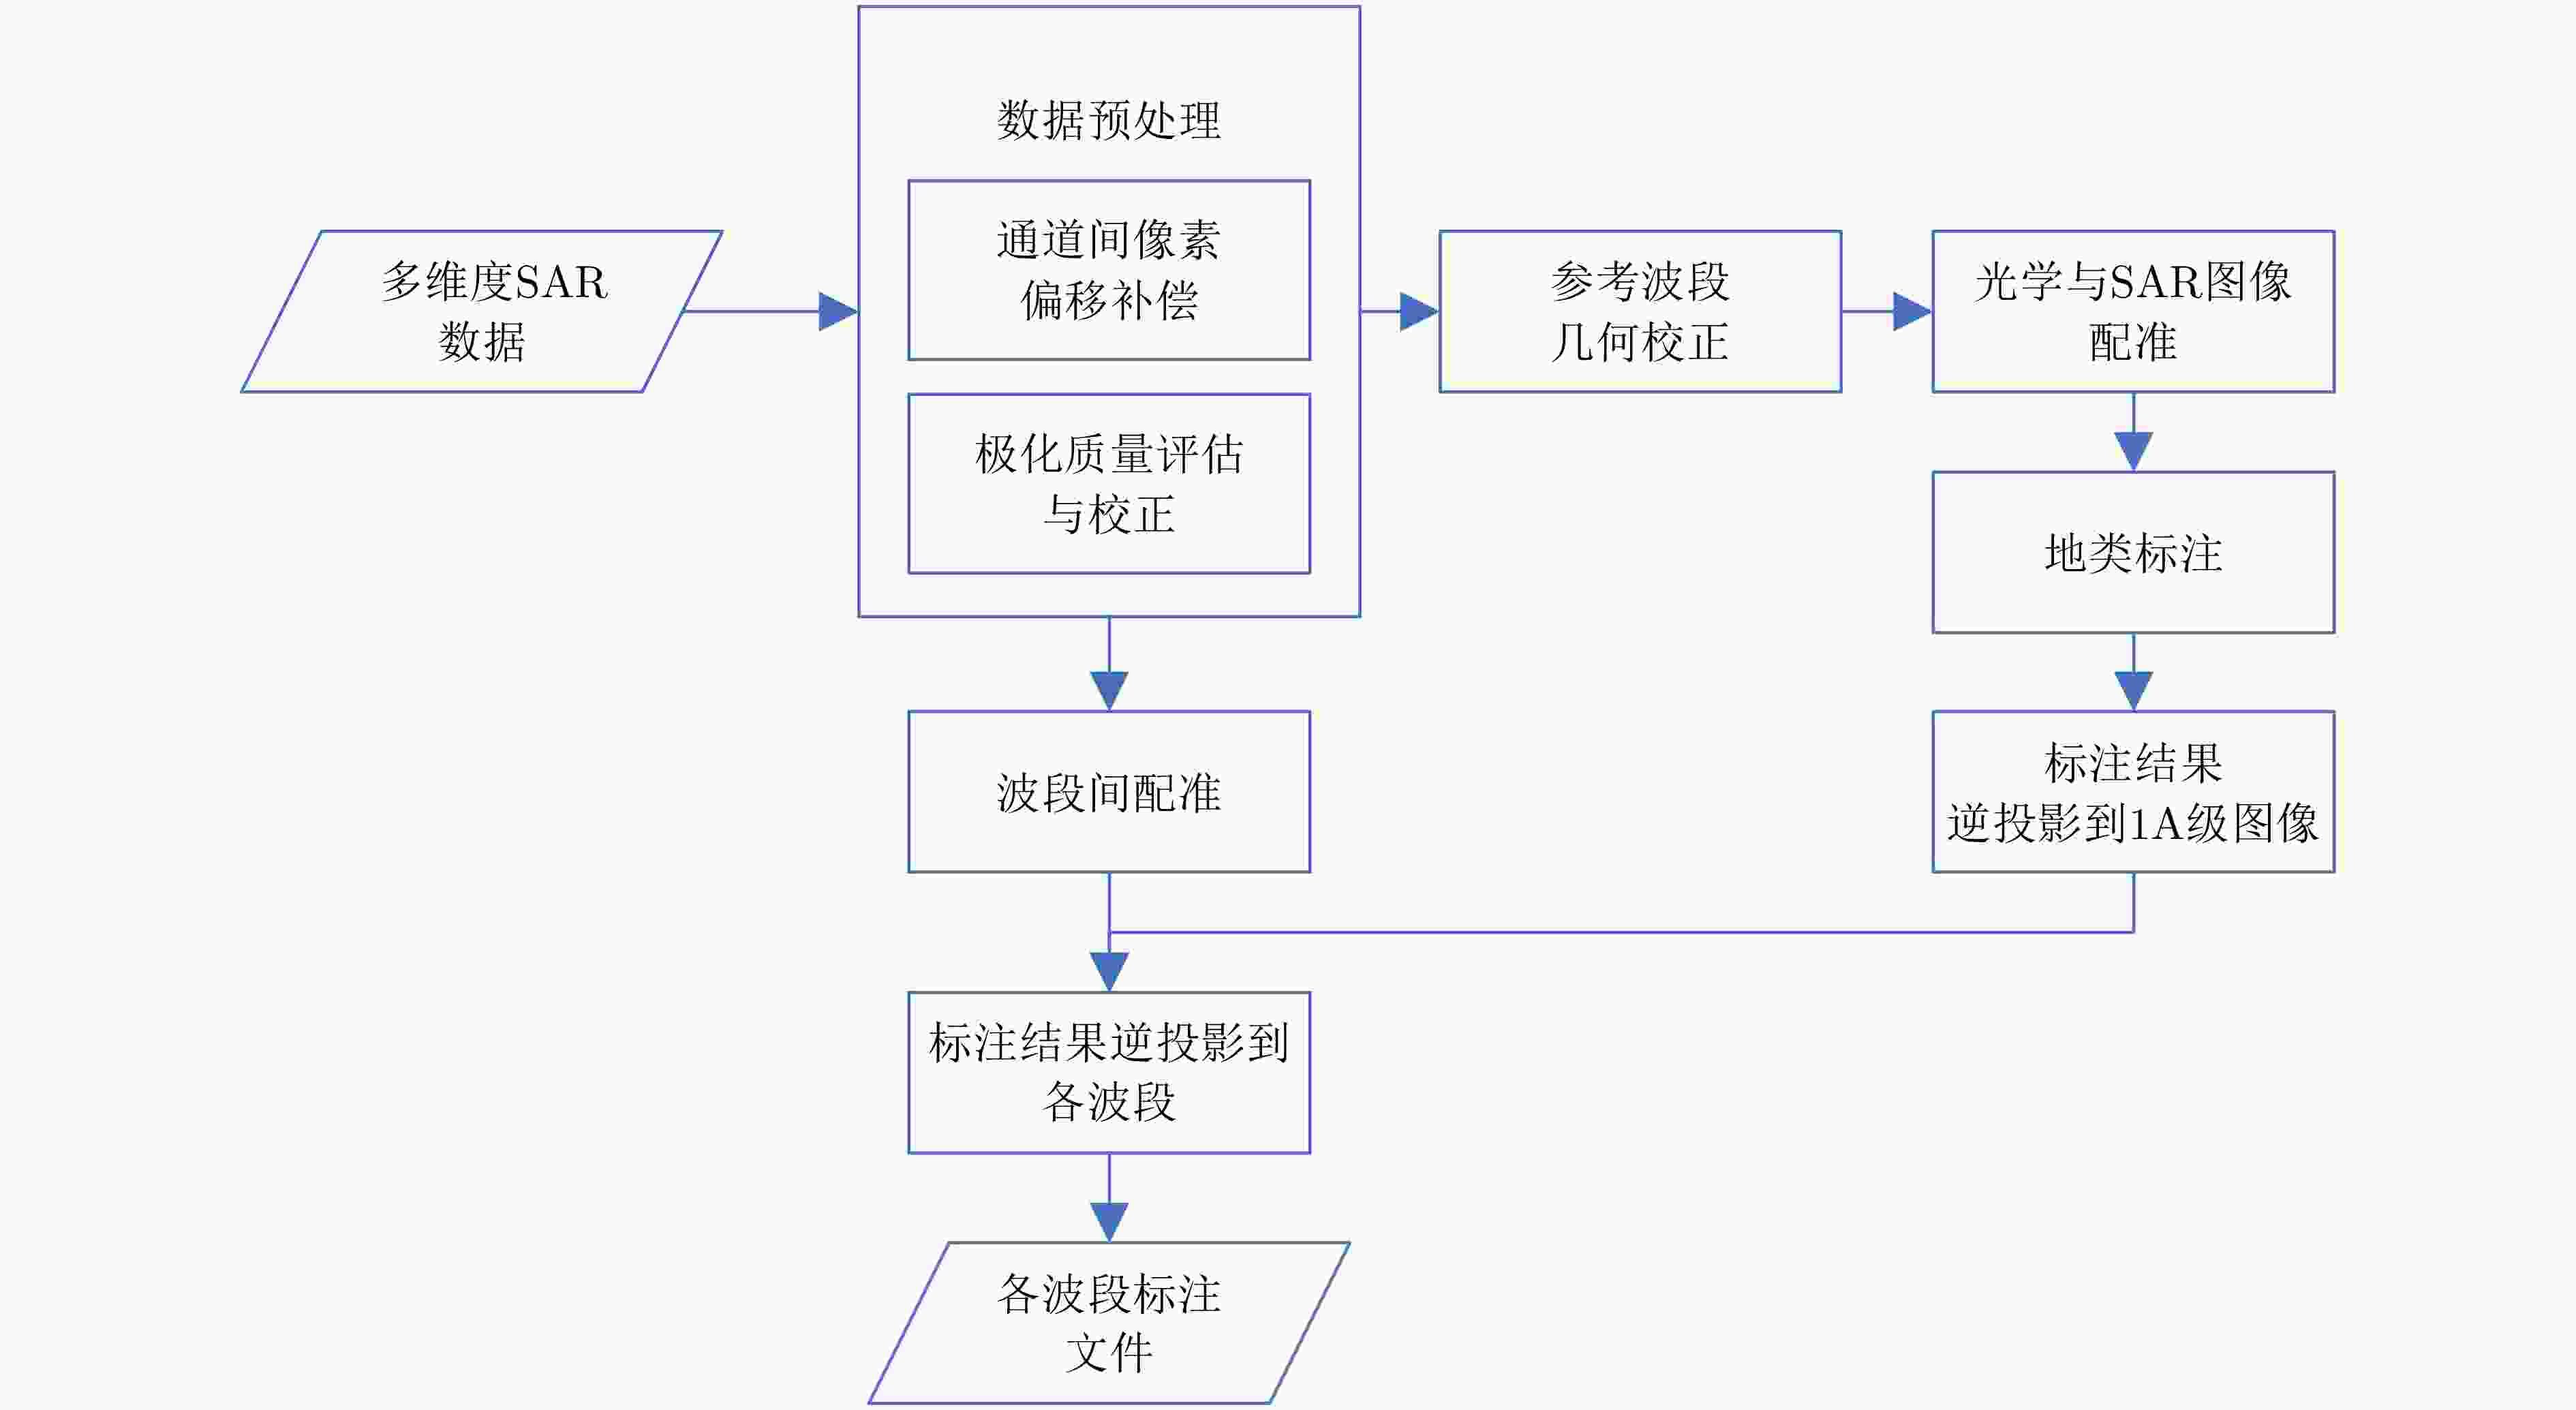
摘要: 地物精细分类是合成孔径雷达(SAR)的主要应用方向之一。在多波段全极化SAR工作模式下,可充分获取目标不同波段信息和极化响应特征,有望提高目标分类精度。然而国内外现有的数据集仅有个别波段、少数地区、少量样本的低分辨率全极化分类数据。为推动多波段全极化SAR分类应用的发展,在高分航空观测系统应用校飞与验证项目支持下,利用多维度SAR在海南的校飞数据构建了一个样本量充分大、地物类别较为丰富、分类可靠性较高的多波段全极化精细分类数据集。该文概述了该数据集的构成,给出了发布数据(MPOLSAR-1.0)的信息描述方式、数据集制作流程和方法,并分别基于极化特征分类方法和经典机器学习分类方法给出了初步的分类实验结果,为该数据集的共享和应用提供支撑。Abstract: Fine terrain classification is one of the main applications of Synthetic Aperture Radar (SAR). In the multiband fully polarized SAR operating mode, obtaining information on different frequency bands of the target and polarization response characteristics of a target is possible, which can improve target classification accuracy. However, the existing datasets at home and abroad only have low-resolution fully polarized classification data for individual bands, limited regions, and small samples. Thus, a multidimensional SAR dataset from Hainan is used to construct a multiband fully polarized fine classification dataset with ample sample size, diverse land cover categories, and high classification reliability. This dataset will promote the development of multiband fully polarized SAR classification applications, supported by the high-resolution aerial observation system application calibration and verification project. This paper provides an overview of the composition of the dataset, and describes the information and dataset production methods for the first batch of published data (MPOLSAR-1.0). Furthermore, this study presents the preliminary classification experimental results based on the polarization feature classification and classical machine learning classification methods, providing support for the sharing and application of the dataset.
-
表 1 多维度SAR各波段雷达参数
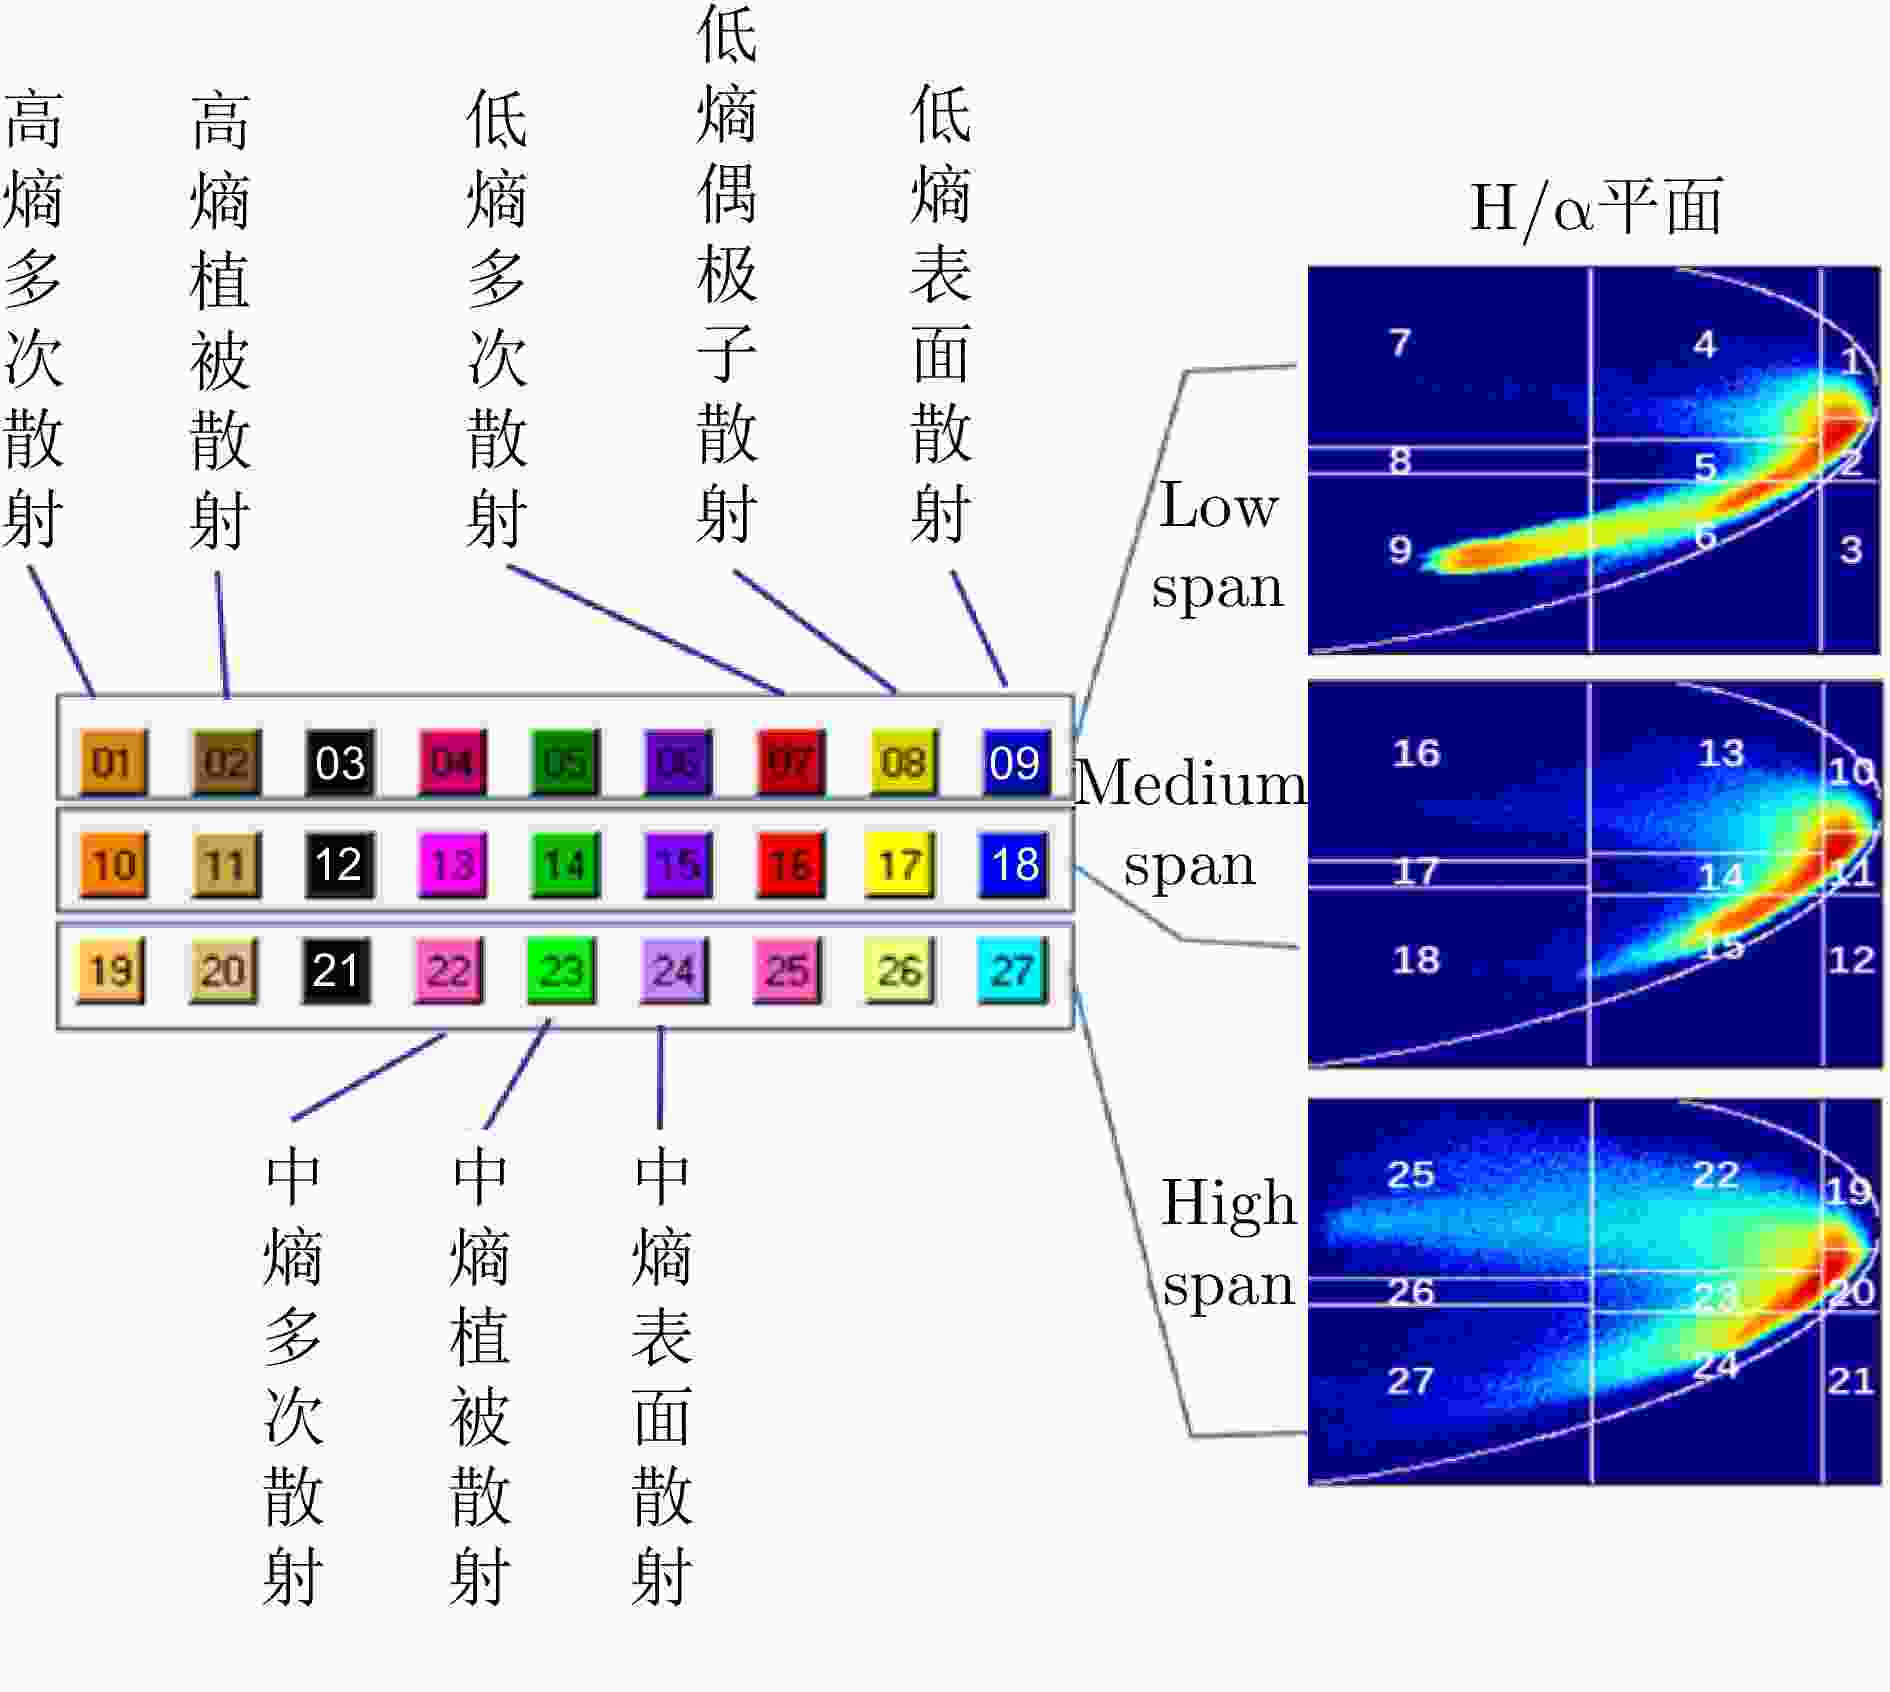
Table 1. Multi-dimensional SAR radar parameters in various bands
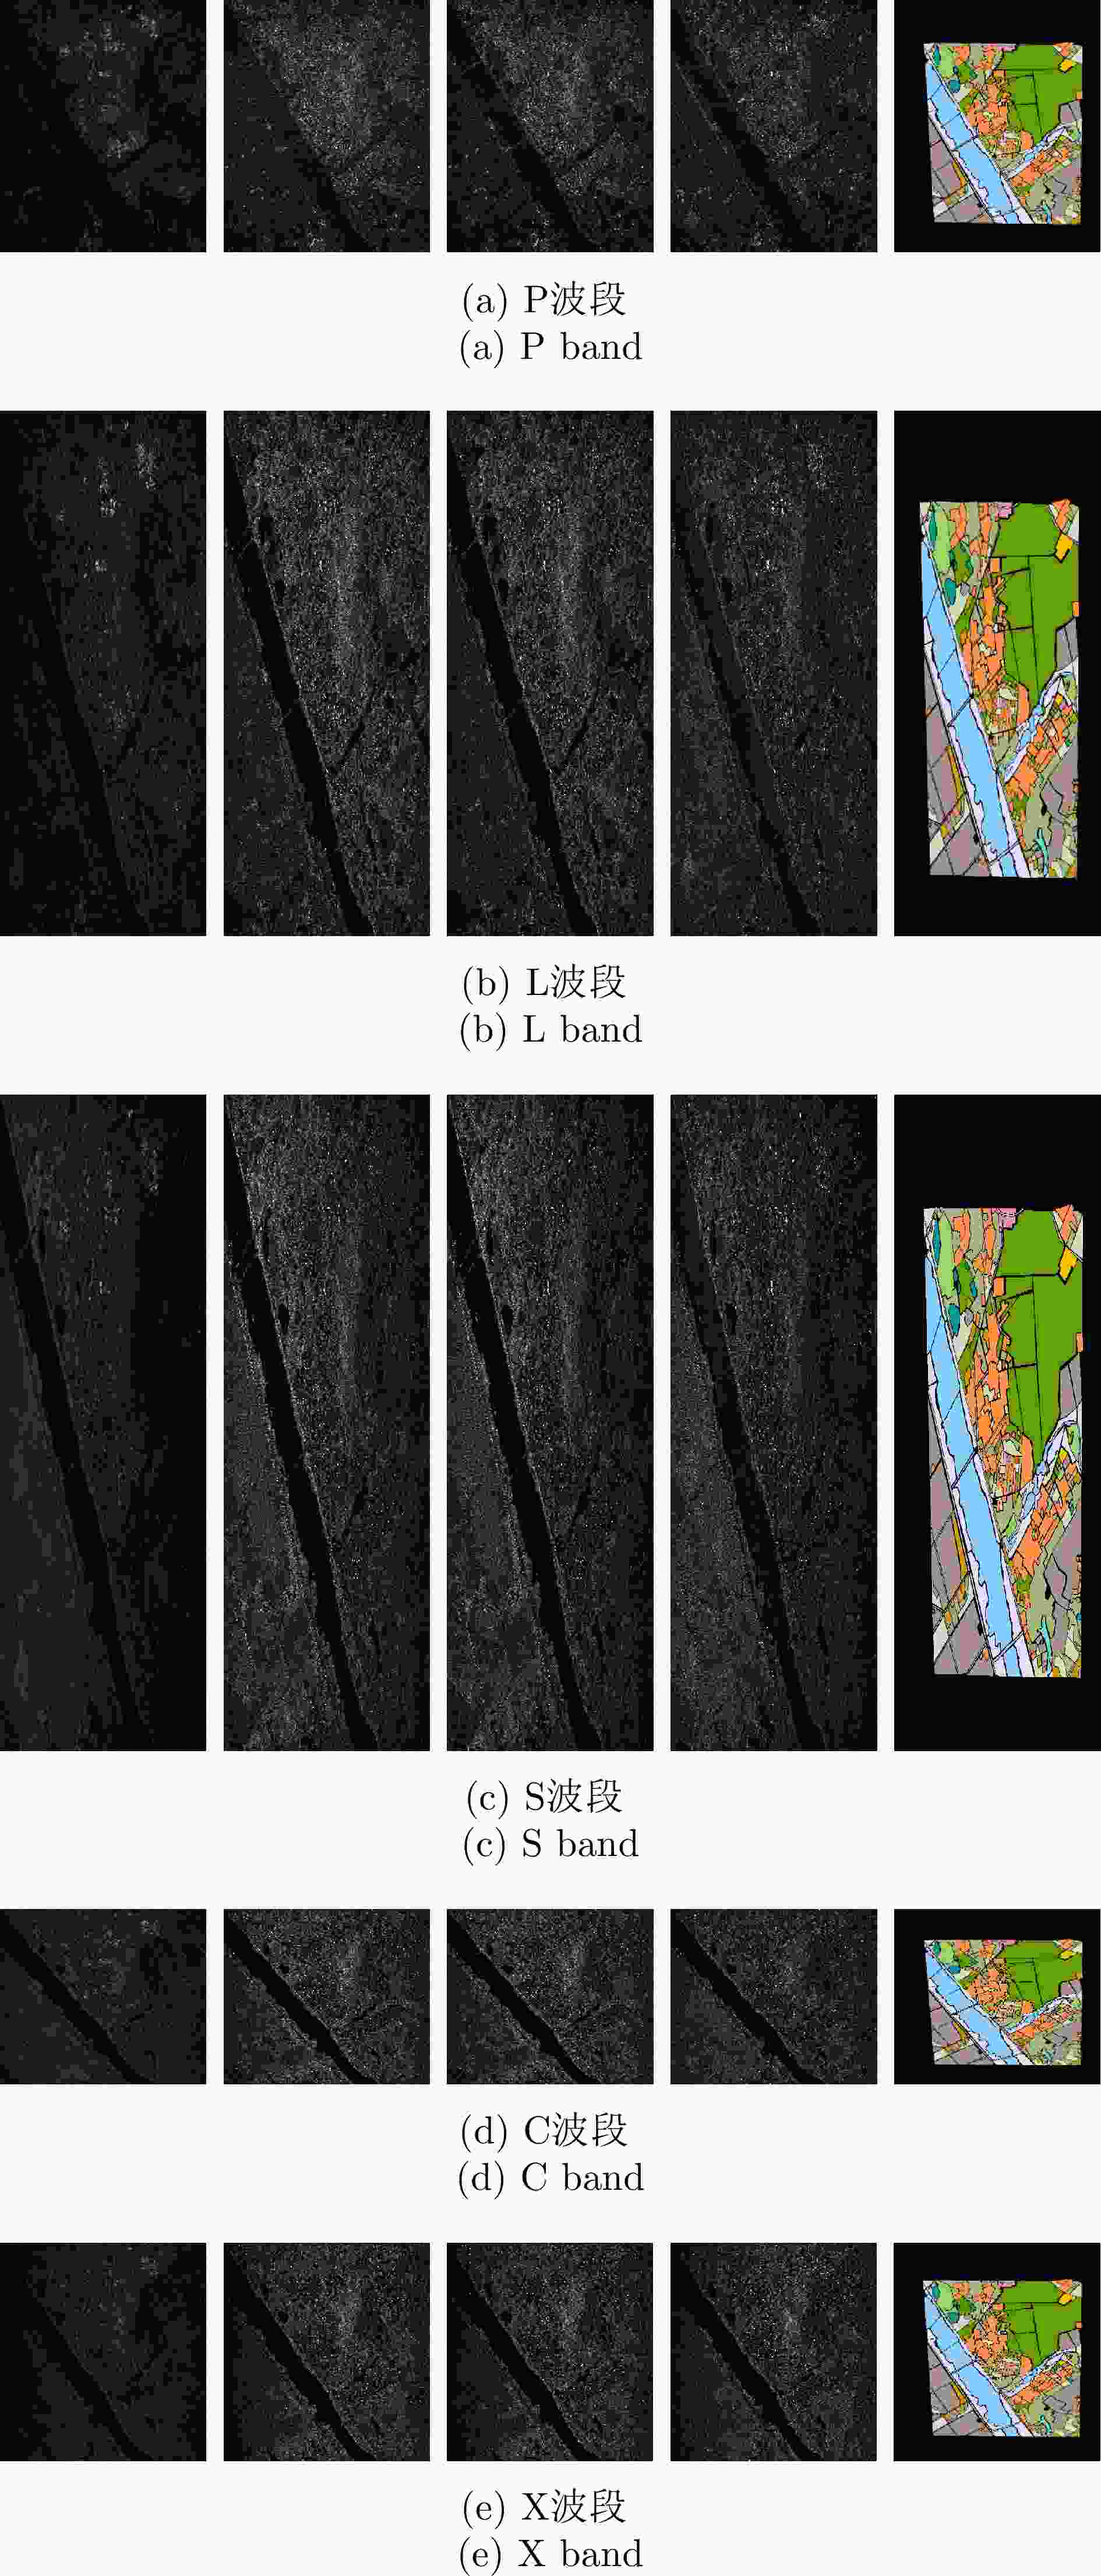
波段 带宽(MHz) PRF (Hz) 分辨率(m) X 500 250 0.5 C 560 250 0.5 S 300 500 0.5 L 200 250 1.0 P 200 125 1.0 表 2 多维度SAR多波段全极化精细分类数据集1.0构成
Table 2. Composition of MPOLSAR-1.0
序号 内容 文件命名和后缀 说明 1 P波段L1B图像 ID_Band_PQ_L1B.jpg 图像尺寸在 1024 ×1024 ~4096 ×4096 之间;Uint16量化2 P波段SLC数据 ID_Band_PQ_L1A.dat 与L1B.jpg严格对应,float32量化,IQIQIQ交替存储 3 P波段数据的元文件 ID_Band_PQ_meta.xml 包括采样率、带宽等一些必要的信息,以及四角点经纬度等 4 P波段Mask图 ID_Band_Mask.jpg Uint8量化,不同的值表示不同的类,详见下文说明 5 P波段标注文件 ID_Band_Label.json 每个切片各一个JSON文件,详见下文说明 6 L波段L1B图像 ID_Band_PQ_L1B.jpg 图像尺寸在 1024 ×1024 ~4096 ×4096 之间;Uint16量化7 L波段SLC数据 ID_Band_PQ_L1A.dat 与L1B.jpg严格对应,float32量化,IQIQIQ交替存储 8 L波段数据的元文件 ID_Band_PQ_meta.xml 包括采样率、带宽等一些必要的信息,以及四角点经纬度等 9 L波段Mask图 ID_Band_Mask.jpg Uint8量化,不同的值表示不同的类,详见下文说明 10 L波段标注文件 ID_Band_Label.json 每个切片各一个JSON文件,详见下文说明 11 C波段L1B图像 ID_Band_PQ_L1B.jpg 图像尺寸在 1024 ×1024 ~4096 ×4096 之间;Uint16量化12 C波段SLC数据 ID_Band_PQ_L1A.dat 与L1B.jpg严格对应,float32量化,IQIQIQ交替存储 13 C波段数据的元文件 ID_Band_PQ_meta.xml 包括采样率、带宽等一些必要的信息,以及四角点经纬度等 14 C波段Mask图 ID_Band_Mask.jpg Uint8量化,不同的值表示不同的类,详见下文说明 15 C波段标注文件 ID_Band_Label.json 每个切片各一个JSON文件,详见下文说明 16 X波段L1B图像 ID_Band_PQ_L1B.jpg 图像尺寸在 1024 ×1024 ~4096 ×4096 之间;Uint16量化17 X波段SLC数据 ID_Band_PQ_L1A.dat 与L1B.jpg严格对应,float32量化,IQIQIQ交替存储 18 X波段数据的元文件 ID_Band_PQ_meta.xml 包括采样率、带宽等一些必要的信息,以及四角点经纬度等 19 X波段Mask图 ID_Band_Mask.jpg Uint8量化,不同的值表示不同的类,详见下文说明 20 X波段标注文件 ID_Band_Label.json 每个切片各一个JSON文件,详见下文说明 21 每个波段与参考波段的像素对应关系文件 relationship.txt 以C波段作为参考波段 22 总体的标注文件 ID_Overall_Label.json 这个文件是之前各个波段JSON文件的综合,一个实例会对应不同的image_id的不同范围 注:ID是这个切片的唯一编号;Band: P, L, S, C等,表示波段;PQ: HH, HV, VH, VV等,表示极化方式。 表 3 多波段极化通道间的像素偏移检测结果
Table 3. Detection results of pixel migration between multiband SAR polarization channels
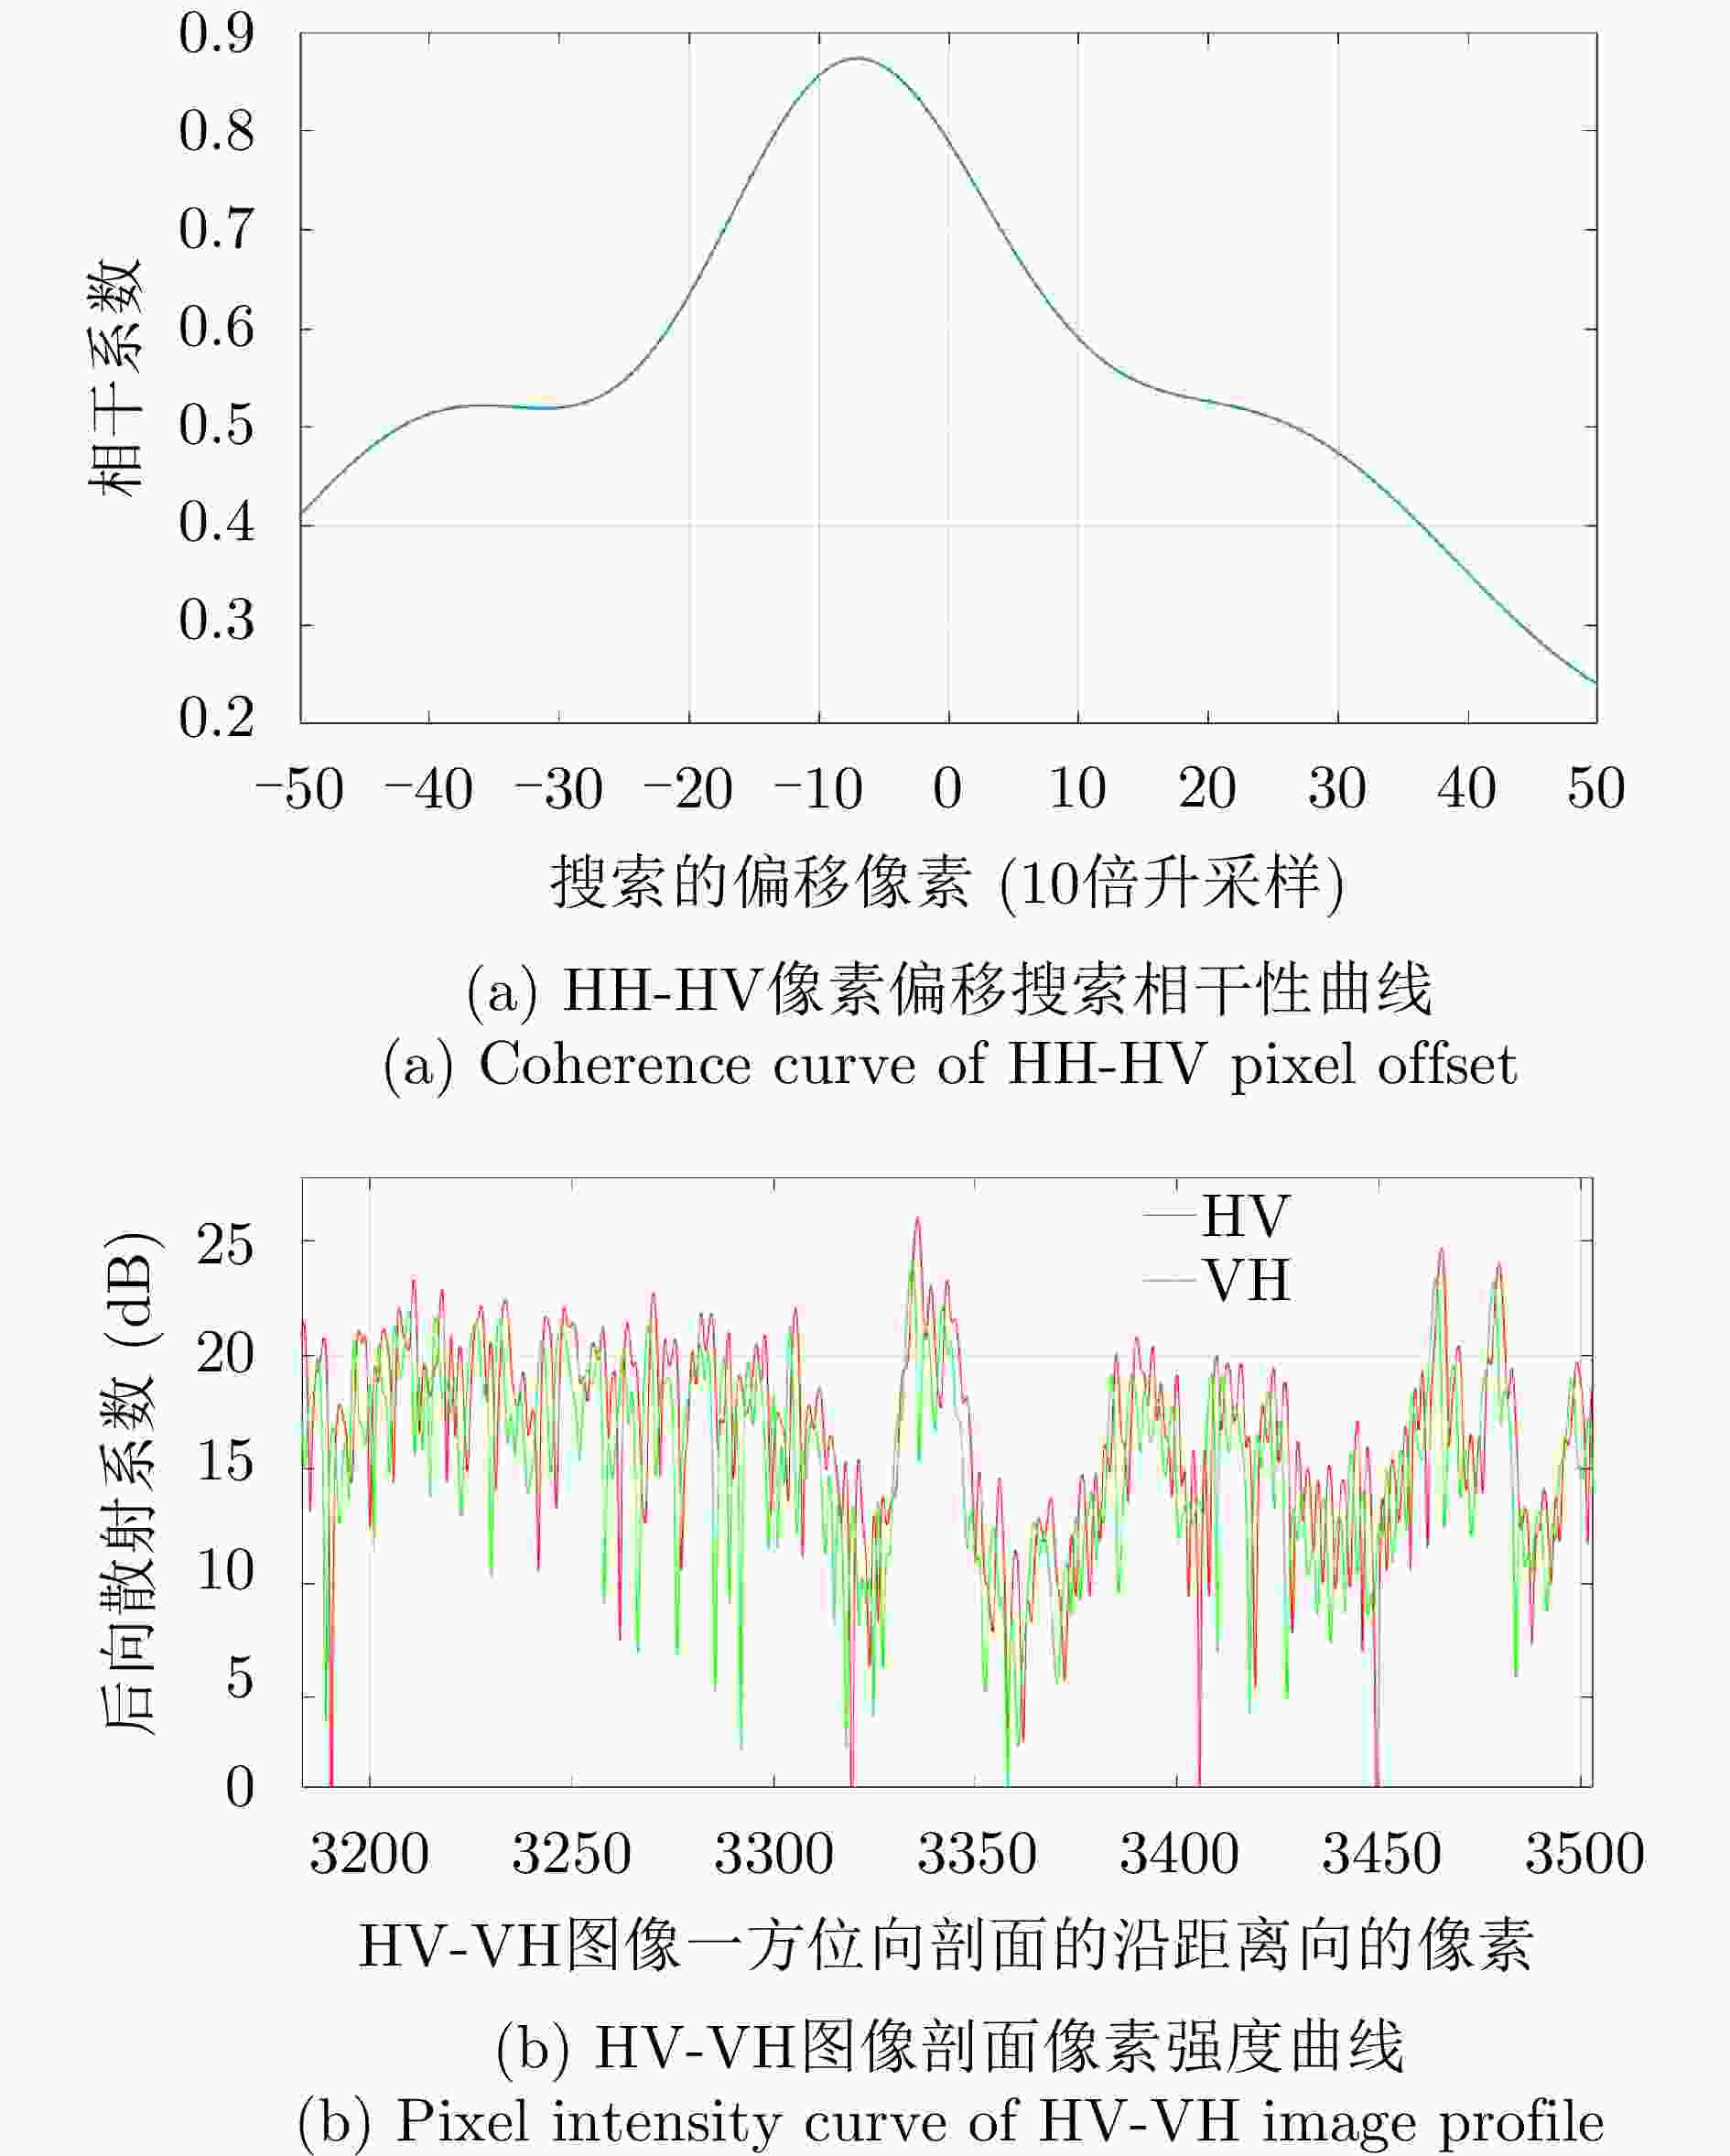
波段 方向 HH-HV(像素) HH-VH(像素) HH-VV(像素) P 距离向 –0.1 0 0 方位向 0 0 –0.2 L 距离向 –0.1 1.0 –0.2 方位向 0.2 0.1 –0.3 S 距离向 0 0.2 0.1 方位向 0.1 0.4 0.2 C 距离向 1.2 0.1 1.3 方位向 –0.1 –0.1 –0.3 X 距离向 0.5 –0.9 –0.6 方位向 0 –0.1 –0.1 表 4 多波段极化失真参数估计结果
Table 4. Estimation results of multiband SAR polarization distortion parameters
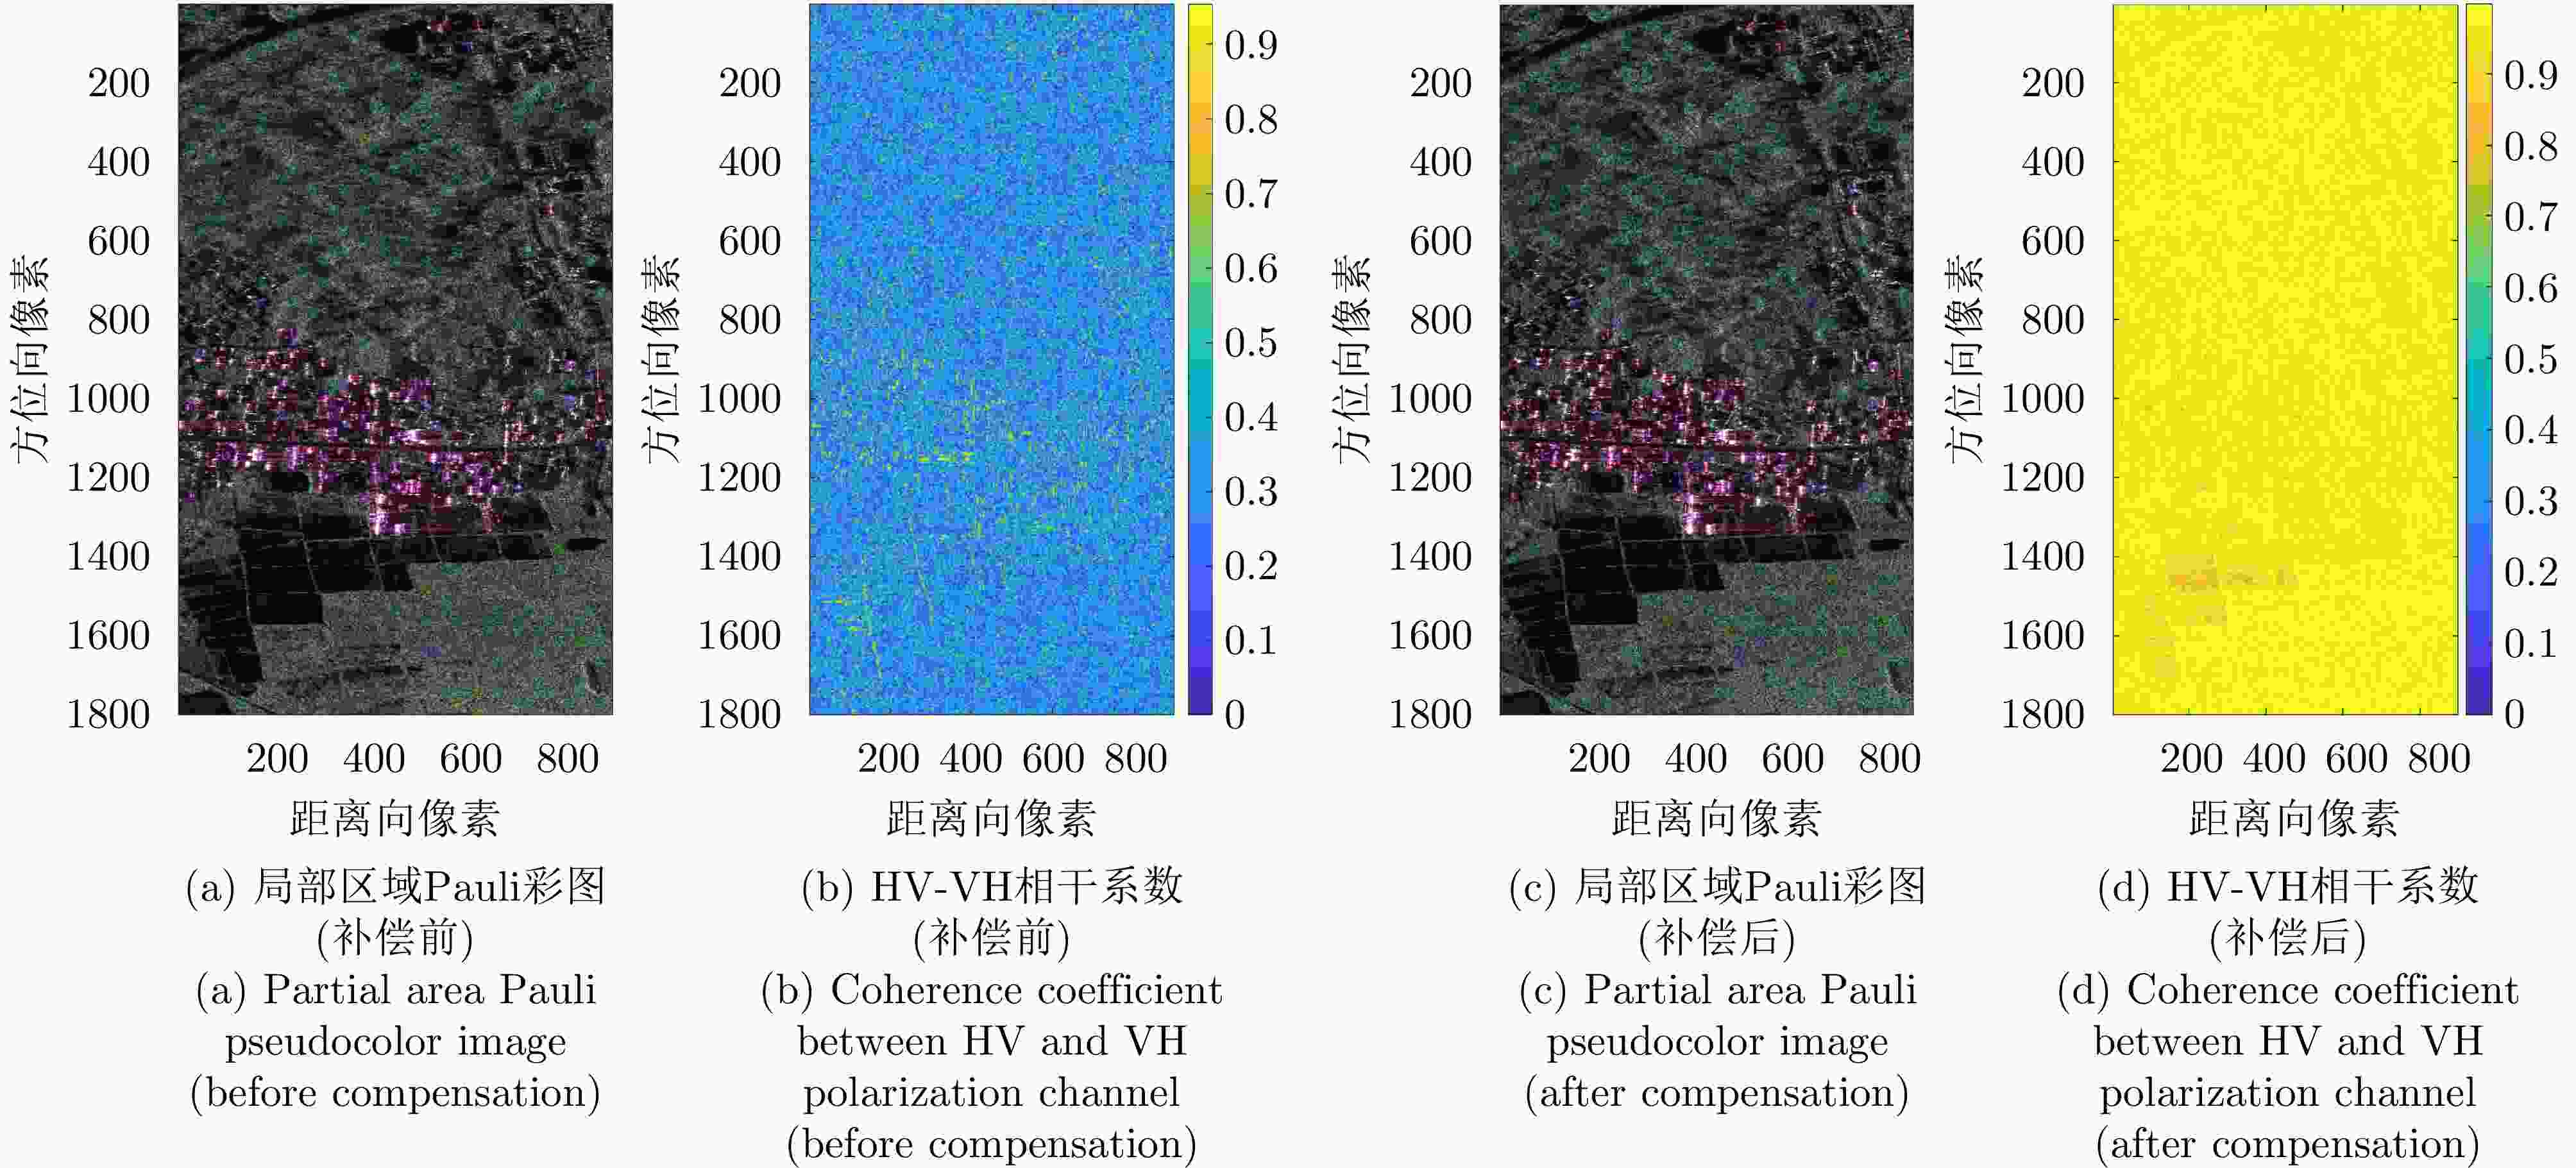
波段 发射端幅度不平衡(dB) 发射端相位不平衡(°) 接收端幅度不平衡(dB) 接收端相位不平衡(°) 极化隔离度(dB) P –3.51 –44.16 –1.16 –40.83 27.79 L 1.64 –72.72 2.22 5.55 24.48 S 4.75 107.91 –2.27 21.06 25.16 C 2.18 0.48 2.95 90.51 31.26 X –1.54 33.86 0.99 6.44 26.18 表 5 分类参数
Table 5. Parameters used for classification
参数 获取方法 Alpha, H, A, (1–H)(1–A) H-alpha-A分解 Y4_Odd, Y4_Dbl, Y4_Vol, Y4_Hlx Yamaguchi分解 SPAN, T11, T22, T33 T矩阵 表 6 模型1分类结果混淆矩阵和召回率
Table 6. Model 1 classification result confusion matrix and recall rate
真值 预测 1 2 3 4 5 Recall 1 276607 27878 1057 14577 87 0.8638 2 83245 95333 3223 11422 951 0.4910 3 2301 6846 71840 1385 0 0.8721 4 73156 3924 273 127090 3691 0.6106 5 4670 1350 0 2967 268945 0.9677 表 7 模型2分类结果混淆矩阵和召回率
Table 7. Model 2 classification result confusion matrix and recall rate
真值 预测 1 2 3 4 5 Recall 1 276238 22265 9627 12008 68 0.8627 2 144229 31880 6756 10927 382 0.1642 3 9053 2030 68807 2482 0 0.8353 4 114212 6329 4703 80838 2052 0.3884 5 10613 304 510 6780 259725 0.9345 表 8 模型3分类结果混淆矩阵和召回率
Table 8. Model 3 classification result confusion matrix and recall rate
真值 预测 1 2 3 4 5 Recall 1 264998 27494 11779 15721 214 0.8276 2 143599 28563 9246 12036 730 0.1471 3 4035 4230 72380 1726 1 0.8787 4 89643 7335 5098 100168 5890 0.4813 5 12677 230 72 5000 259953 0.9353 表 9 模型4分类结果混淆矩阵和召回率
Table 9. Model 4 classification result confusion matrix and recall rate
真值 预测 1 2 3 4 5 Recall 1 278463 20239 6438 14955 111 0.8696 2 149579 20500 8838 14053 1204 0.1056 3 4655 5676 70645 1396 0 0.8576 4 95297 11409 4501 90199 6728 0.4334 5 6418 1145 563 8288 261518 0.9409 表 10 模型5分类结果混淆矩阵和召回率
Table 10. Model 5 classification result confusion matrix and recall rate
真值 预测 1 2 3 4 5 Recall 1 278361 16519 9412 12555 3359 0.8693 2 130637 23062 14786 14016 11673 0.1188 3 24496 10469 45519 1685 203 0.5526 4 162640 12980 4677 26304 1533 0.1264 5 44108 28618 3508 6964 194734 0.7007 表 11 模型6分类结果混淆矩阵和召回率
Table 11. Model 6 classification result confusion matrix and recall rate
真值 预测 1 2 3 4 5 Recall 1 274014 18665 6258 12666 8603 0.8557 2 98518 44169 28736 4580 18171 0.2275 3 8163 10326 57887 756 5240 0.7028 4 169684 8344 1744 26559 1803 0.1276 5 37395 10402 7306 29010 193819 0.6974 表 1 Multidimensional SAR radar parameters in various bands
Band Bandwidth (MHz) PRF (Hz) Resolution (m) X 500 250 0.5 C 560 250 0.5 S 300 500 0.5 L 200 250 1.0 P 200 125 1.0 表 2 Composition of MPOLSAR-1.0
No Content File naming and extension Description 1 P-band L1B image ID_Band_PQ_L1B.jpg Image dimensions range from 1,024 × 1,024 to 4,096 × 4,096;
16-bit unsigned integer quantization2 P-band SLC data ID_Band_PQ_L1A.dat Strictly corresponds to L1B.jpg; 32-bit floating-point quantization; alternating IQIQIQ storage 3 P-band metadata file ID_Band_PQ_meta.xml Includes sampling rate, bandwidth, and geographic coordinates
of the four corners4 P-band Mask image ID_Band_Mask.jpg 8-bit unsigned integer quantization; different values represent different classes (see details below) 5 P-band annotation file ID_Band_Label.json One JSON file per slice (see details below) 6 L-band L1B image ID_Band_PQ_L1B.jpg Image dimensions range from 1,024 × 1,024 to 4,096 × 4,096;
16-bit unsigned integer quantization7 L-band SLC data ID_Band_PQ_L1A.dat Strictly corresponds to L1B.jpg; 32-bit floating-point quantization; alternating IQIQIQ storage 8 L-band metadata file ID_Band_PQ_meta.xml Includes sampling rate, bandwidth, and geographic coordinates
of the four corners9 L-band Mask image ID_Band_Mask.jpg 8-bit unsigned integer quantization; different values represent different classes (see details below) 10 L-band annotation file ID_Band_Label.json One JSON file per slice (see details below) 11 C-band L1B image ID_Band_PQ_L1B.jpg Image dimensions range from 1,024 × 1,024 to 4,096 × 4,096;
16-bit unsigned integer quantization12 C-band SLC data ID_Band_PQ_L1A.dat Strictly corresponds to L1B.jpg; 32-bit floating-point quantization; alternating IQIQIQ storage 13 C-band metadata file ID_Band_PQ_meta.xml Includes sampling rate, bandwidth, and geographic coordinates
of the four corners14 C-band Mask image ID_Band_Mask.jpg 8-bit unsigned integer quantization; different values represent different classes (see details below) 15 C-band annotation file ID_Band_Label.json One JSON file per slice (see details below) 16 X-band L1B image ID_Band_PQ_L1B.jpg Image dimensions range from 1,024 × 1,024 to 4,096 × 4,096;
16-bit unsigned integer quantization17 X-band SLC data ID_Band_PQ_L1A.dat Strictly corresponds to L1B.jpg; 32-bit floating-point quantization; alternating IQIQIQ storage 18 X-band metadata file ID_Band_PQ_meta.xml Includes sampling rate, bandwidth, and geographic coordinates
of the four corners19 X-band Mask image ID_Band_Mask.jpg 8-bit unsigned integer quantization; different values represent
different classes (see details below)20 X-band annotation file ID_Band_Label.json One JSON file per slice (see details below) 21 Pixel correspondence file
between bandsrelationship.txt Uses the C band as the reference band 22 Overall annotation file ID_Overall_Label.json A comprehensive file integrating annotation files from all bands;
covers different image IDs and rangesNotes: ID: Unique identifier for the slice. Band: P, L, C, X (indicating frequency bands). PQ: HH, HV, VH, VV (indicating polarization modes). 表 3 Detection results of pixel migration between multiband SAR polarization channels
Band Direction HH-HV
(Pixels)HH-VH
(Pixels)HH-VV
(Pixels)P Range −0.1 0 0 Azimuth 0 0 −0.2 L Range −0.1 1.0 −0.2 Azimuth 0.2 0.1 −0.3 S Range 0 0.2 0.1 Azimuth 0.1 0.4 0.2 C Range 1.2 0.1 1.3 Azimuth −0.1 −0.1 −0.3 X Range 0.5 −0.9 −0.6 Azimuth 0 −0.1 −0.1 表 4 Estimation results of multiband SAR polarimetric distortion parameters
Band Transmit amplitude
imbalance (dB)Transmit phase
imbalance (°)Receive amplitude
imbalance (dB)Receive phase
imbalance (°)Polarization
isolation (dB)P −3.51 −44.16 −1.16 −40.83 27.79 L 1.64 −72.72 2.22 5.55 24.48 S 4.75 107.91 −2.27 21.06 25.16 C 2.18 0.48 2.95 90.51 31.26 X −1.54 33.86 0.99 6.44 26.18 表 5 Parameters used for classification
Parameter Acquisition method Alpha, H, A, (1– H)(1– A) H-alpha-A decomposition Y4_Odd, Y4_Dbl, Y4_Vol, Y4_Hlx Yamaguchi decomposition SPAN, T11, T22, T33 T matrix 表 6 Model 1 classification result confusion matrix and recall rate
True value Prediction 1 2 3 4 5 Recall 1 276,607 27,878 1,057 14,577 87 0.8638 2 83,245 95,333 3,223 11,422 951 0.4910 3 2,301 6,846 71,840 1,385 0 0.8721 4 73,156 3,924 273 127,090 3,691 0.6106 5 4,670 1,350 0 2,967 268,945 0.9677 表 7 Model 2 classification result confusion matrix and recall rate
True value Prediction 1 2 3 4 5 Recall 1 276,238 22,265 9,627 12,008 68 0.8627 2 144,229 31,880 6,756 10,927 382 0.1642 3 9,053 2,030 68,807 2,482 0 0.8353 4 114,212 6,329 4,703 80,838 2,052 0.3884 5 10,613 304 510 6,780 259,725 0.9345 表 8 Model 3 classification result confusion matrix and recall rate
True value Prediction 1 2 3 4 5 Recall 1 264,998 27,494 11,779 15,721 214 0.8276 2 143,599 28,563 9,246 12,036 730 0.1471 3 4,035 4,230 72,380 1,726 1 0.8787 4 89,643 7,335 5,098 100,168 5,890 0.4813 5 12,677 230 72 5,000 259,953 0.9353 表 9 Model 4 classification result confusion matrix and recall rate
True value Prediction 1 2 3 4 5 Recall 1 278,463 20,239 6,438 14,955 111 0.8696 2 149,579 20,500 8,838 14,053 1,204 0.1056 3 4,655 5,676 70,645 1,396 0 0.8576 4 95,297 11,409 4,501 90,199 6,728 0.4334 5 6,418 1,145 563 8,288 26,1518 0.9409 表 10 Model 5 classification result confusion matrix and recall rate
True value Prediction 1 2 3 4 5 Recall 1 278,361 16,519 9,412 12,555 3,359 0.8693 2 130,637 23,062 14,786 14,016 11,673 0.1188 3 24,496 10,469 45,519 1,685 203 0.5526 4 162,640 12,980 4,677 26,304 1,533 0.1264 5 44,108 28,618 3,508 6,964 194,734 0.7007 表 11 Model 6 classification result confusion matrix and recall rate
True value Prediction 1 2 3 4 5 Recall 1 274,014 18,665 6,258 12,666 8,603 0.8557 2 98,518 44,169 28,736 4,580 18,171 0.2275 3 8,163 10,326 57,887 756 5,240 0.7028 4 169,684 8,344 1,744 26,559 1,803 0.1276 5 37,395 10,402 7,306 29,010 193,819 0.6974 -
[1] 亓宁轩, 罗征宇, 李彬. 基于多波段全极化SAR影像的湿地分类[J]. 测绘与空间地理信息, 2017, 40(1): 171–174. doi: 10.3969/j.issn.1672-5867.2017.01.051.QI Ningxuan, LUO Zhengyu, and LI Bin. Multi-band polarization SAR wetlands classification[J]. Geomatics & Spatial Information Technology, 2017, 40(1): 171–174. doi: 10.3969/j.issn.1672-5867.2017.01.051. [2] 丁赤飚, 仇晓兰, 吴一戎. 全息合成孔径雷达的概念、体制和方法[J]. 雷达学报, 2020, 9(3): 399–408. doi: 10.12000/JR20063.DING Chibiao, QIU Xiaolan, and WU Yirong. Concept, system, and method of holographic synthetic aperture radar[J]. Journal of Radars, 2020, 9(3): 399–412. doi: 10.12000/JR20063. [3] YIN Junjun and YANG Jian. A modified level set approach for segmentation of multiband polarimetric SAR images[J]. IEEE Transactions on Geoscience and Remote Sensing, 2014, 52(11): 7222–7232. doi: 10.1109/TGRS.2014.2309725. [4] 廖静娟, 郭华东, 邵芸. 多波段多极化成像雷达图象识别森林类型效果分析[J]. 中国图象图形学报, 2000, 5(1): 30–33. doi: 10.3969/j.issn.1006-8961.2000.01.007.LIAO Jingjuan, GUO Huadong, and SHAO Yun. Effect of forest types discrimination using multifrequency and multipolarization imaging radar images[J]. Journal of Image and Graphics, 2000, 5(1): 30–33. doi: 10.3969/j.issn.1006-8961.2000.01.007. [5] 王之禹, 朱敏慧, 白有天. 基于最优状态的多波段全极化SAR数据ML分类方法[J]. 电子与信息学报, 2001, 23(5): 507–511.WANG Zhiyu, ZHU Minhui, and BAI Youtian. Optimal state based ml classification method for multi-band and full-polarization SAR data[J]. Journal of Electronics & Information Technology, 2001, 23(5): 507–511. [6] 丁赤飚, 仇晓兰, 徐丰, 等. 合成孔径雷达三维成像—从层析、阵列到微波视觉[J]. 雷达学报, 2019, 8(6): 693–709. doi: 10.12000/JR19090.DING Chibiao, QIU Xiaolan, XU Feng, et al. Synthetic aperture radar three-dimensional imaging—from TomoSAR and array InSAR to microwave vision[J]. Journal of Radars, 2019, 8(6): 693–709. doi: 10.12000/JR19090. [7] VILLANO M. SNR and noise variance estimation in polarimetric SAR data[J]. IEEE Geoscience and Remote Sensing Letters, 2014, 11(1): 278–282. doi: 10.1109/LGRS.2013.2255860. [8] JIANG Sha, QIU Xiaolan, HAN Bing, et al. A quality assessment method based on common distributed targets for GF-3 polarimetric SAR data[J]. Sensors, 2018, 18(3): 807. doi: 10.3390/s18030807. [9] CLOUDE S R and POTTIER E. A review of target decomposition theorems in radar polarimetry[J]. IEEE Transactions on Geoscience and Remote Sensing, 1996, 34(2): 498–518. doi: 10.1109/36.485127. [10] 曹芳. 基于Cloude-Pottier分解的全极化SAR数据非监督分类的算法和实验研究[D]. 北京: 中国科学院研究生院(电子学研究所), 2007.CAO Fang. The unsupervised classification based on the Cloude-Pottier decomposition for fully polarimetric SAR data[D]. Bejing: Institute of Electronics, Chinese Academy of Science, 2007. [11] 徐乔, 张霄, 余绍淮, 等. 综合多特征的极化SAR图像随机森林分类算法[J]. 遥感学报, 2019, 23(4): 685–694. doi: 10.11834/jrs.20197475.XU Qiao, ZHANG Xiao, YU Shaohuai, et al. Multi-feature-based classification method using random forest and superpixels for polarimetric SAR images[J]. Journal of Remote Sensing, 2019, 23(4): 685–694. doi: 10.11834/jrs.20197475. -


 作者中心
作者中心 专家审稿
专家审稿 责编办公
责编办公 编辑办公
编辑办公
 下载:
下载:
