
 作者中心
作者中心 专家审稿
专家审稿 责编办公
责编办公 编辑办公
编辑办公
Evaluation of Radiometric and Polarimetric Errors in the LT-1A Satellite Data Based on Tropical Forests in the Amazon
-
摘要: 作为中国新一代天基长波SAR的代表,陆地探测1号01卫星(LT-1A)于2022年1月发射进入太阳同步轨道。LT-1A搭载的长波合成孔径雷达(SAR)工作在L波段,具备单极化、线性双极化、紧缩双极化、全极化等对地观测能力。现有研究主要侧重于LT-1A重轨干涉数据获取能力以及数字高程模型、沉降产品的生产精度评价,对LT-1A的辐射精度、地物极化信息保持能力的研究较为缺乏。该文以热带雨林植被为观测对象,通过不依赖人工定标器的自主定标方法对LT-1A全极化数据辐射误差、极化误差的稳定性进行评价与分析。实验表明:LT-1A传感器的辐射稳定性较好、极化精度优于国际对地观测组织(CEOS)推荐指标。持续对地观测
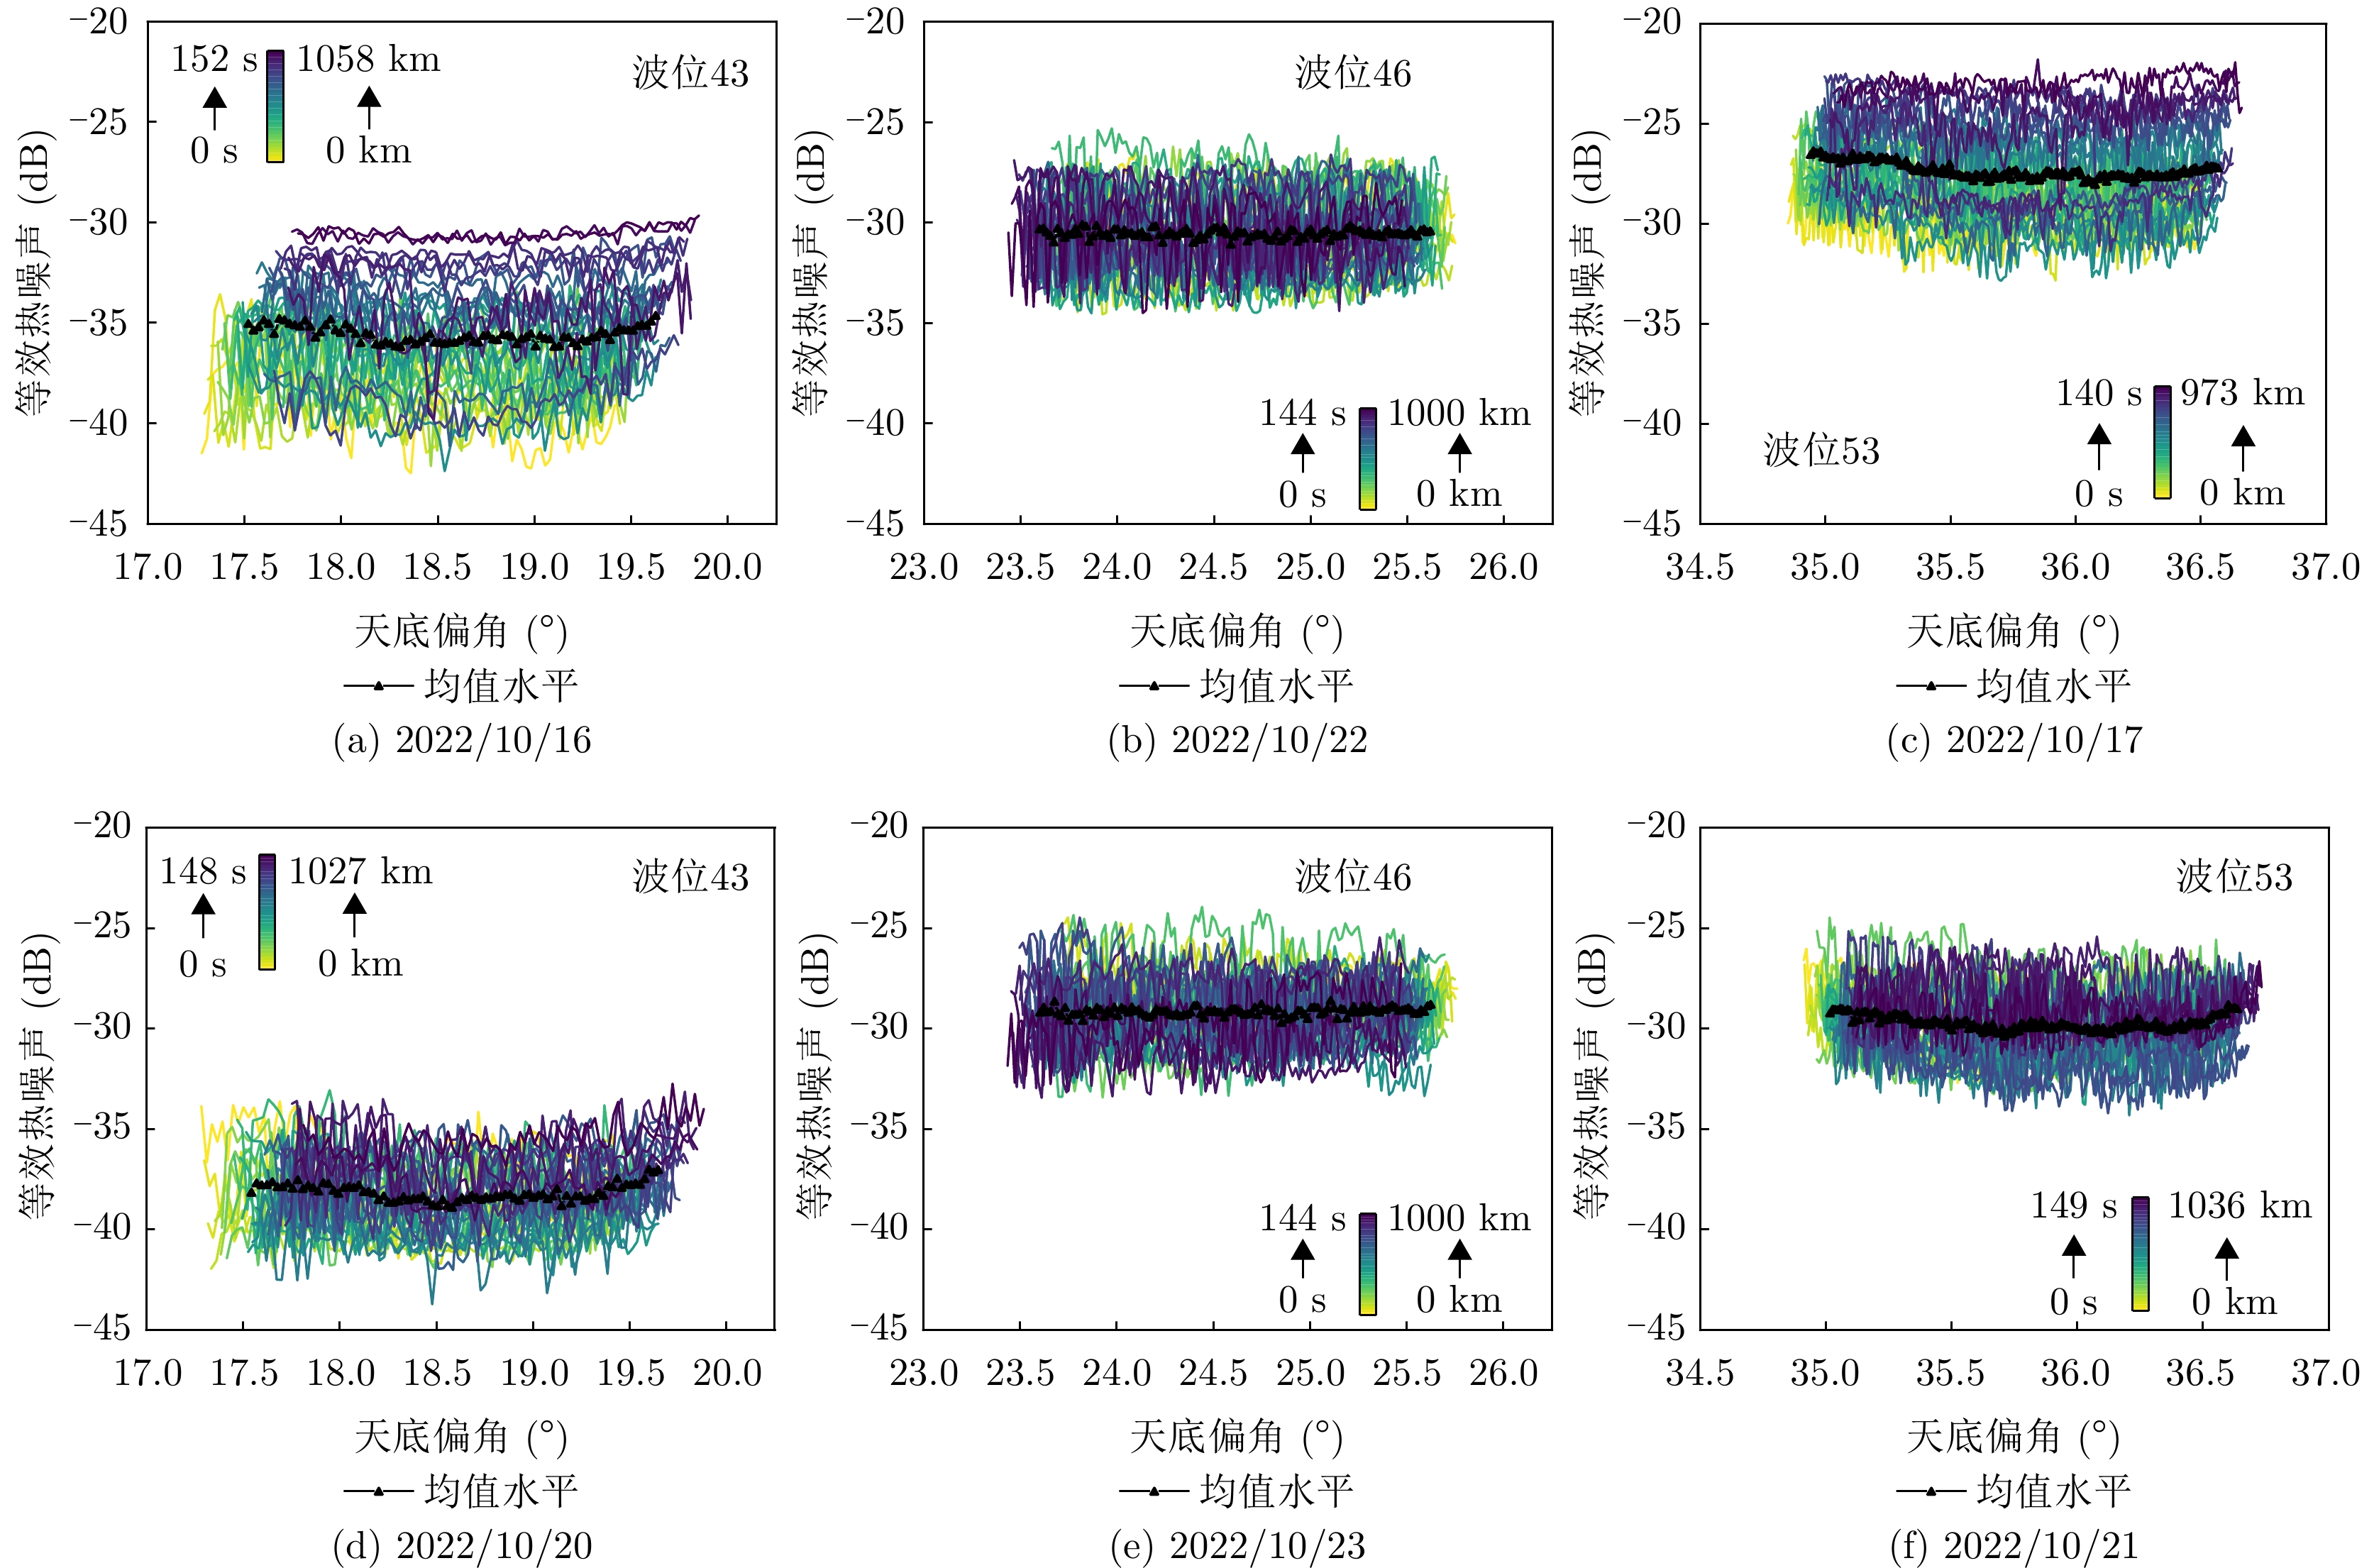
1000 km内归一化雷达截面(NRCS)误差波动小于1 dB (3倍标准差)、5天内重返观测时辐射误差波动小于0.5 dB (3倍标准差);全极化观测模式下系统串扰低于–35 dB甚至达到–40 dB,交叉极化通道不平衡优于0.2 dB与2°,同通道不平衡优于0.5 dB与10°;系统噪声介于–42~–22 dB,平均系统等效热噪声优于–25 dB,热噪声水平随持续对地观测时长的增加有升高。此外,该研究验证了电离层对LT-1A极化数据质量的影响:5°法拉第旋转角造成的图像退化与–20 dB系统串扰带来的影响相当,而3°~20°法拉第旋转角在中、低纬度较为常见,这将带来–21.16~–8.78 dB的极化通道间扰动,即电离层对全极化数据质量的退化相较传感器–40 dB的串扰更为严重。Abstract: As a representative of China’s new generation of space-borne long-wavelength Synthetic Aperture Radar (SAR), the LuTan-1A (LT-1A) satellite was launched into a solar synchronous orbit in January 2022. The SAR onboard the LT-1A satellite operates in the L band and exhibits various earth observation capabilities, including single-polarization, linear dual-polarization, compressed dual-polarization, and quad-polarization observation capabilities. Existing research has mainly focused on LT-1A interferometric data acquisition capabilities and the accuracy evaluation of digital elevation models and displacement measurements. Research on the radiometric and polarimetric accuracy of the LT-1A satellite is limited. This article uses tropical rainforest vegetation as a reference to evaluate and analyze the radiometric error and polarimetricstability of the LT-1A satellite in the full polarization observation mode through a self-calibration method that does not rely on artificial calibrators. The experiment demonstrates that the LT-1A satellite has good radiometric stability and polarimetric accuracy, exceeding the recommended specifications of the International Organization for Earth Observations (Committee on Earth Observation Satellites, CEOS). Fluctuations in the Normalized Radar Cross-Section (NRCS) error within 1,000 km of continuous observation are less than 1 dB (3σ), and there are no significant changes in system radiometric errors of less than 0.5 dB (3σ) when observation is resumed within five days. In the full polarization observation mode, the system crosstalk is less than −35 dB, reaching as low as −45 dB. Further, the cross-polarization channel imbalance is better than 0.2 dB and 2°, whilethe co-polarization channel imbalance is better than 0.5 dB and 10°. The equivalent thermal noise ranges from −42~−22 dB, and the average equivalent thermal noise of the system is better than −25 dB. The level of thermal noise may increase to some extent with increasing continuous observation duration. Additionally, this study found that the ionosphere significantly affects the quality of the LT-1A satellite polarization data, with a Faraday rotation angle of approximately 5°, causing a crosstalk of nearly −20 dB. In middle- and low-latitude regions, the Faraday rotation angle commonly ranges from 3° to 20°. The Faraday rotation angle can cause polarimetric distortion errors between channels ranging from −21.16~−8.78 dB. The interference from the atmospheric observation environment is considerably greater than the influence of about −40 dB system crosstalk errors. This research carefully assesses the radiomatric and polarimetric quality of the LT-1A satellite data considering dense vegetation in the Amazon rainforest and provides valuable information to industrial users. Thus, this research holds significant scientific importanceand reference value. -
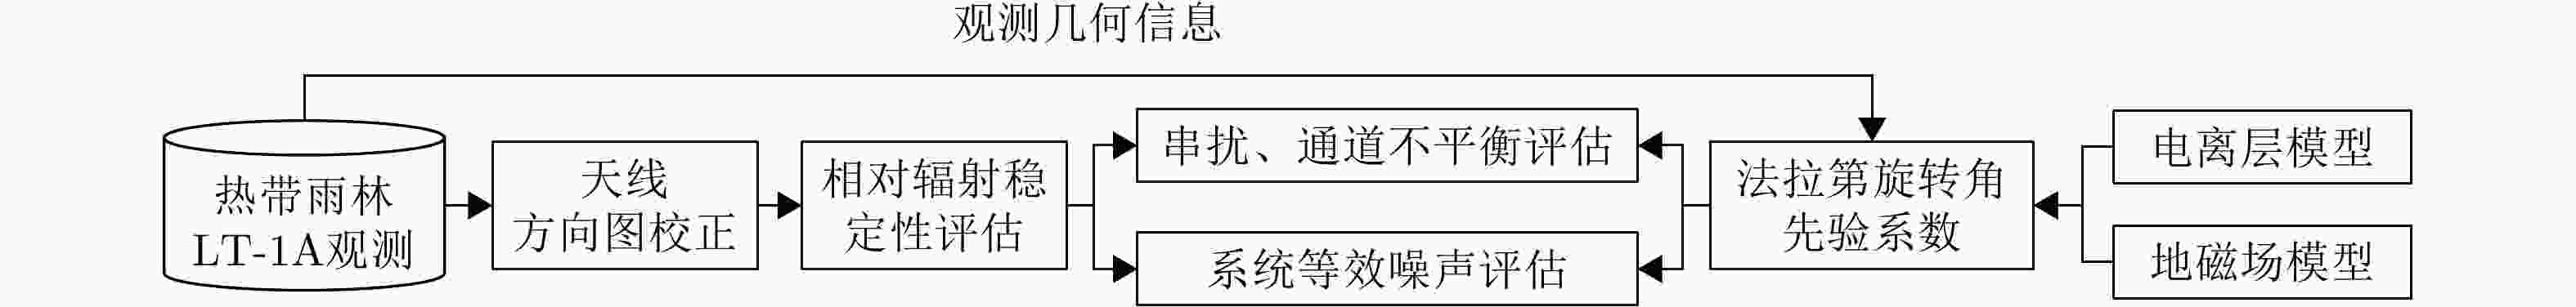
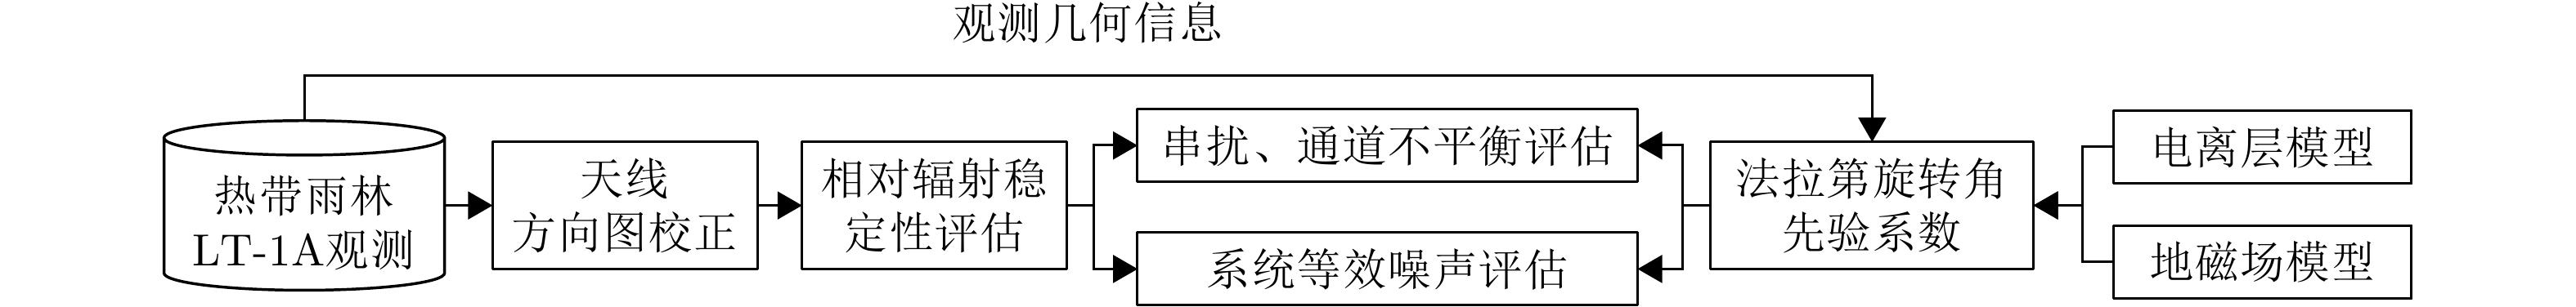
图 1 基于热带雨林观测的LT-1A数据评估流程
Figure 1. The quality evaluation of LT-1A based on tropical rainforest vegetation
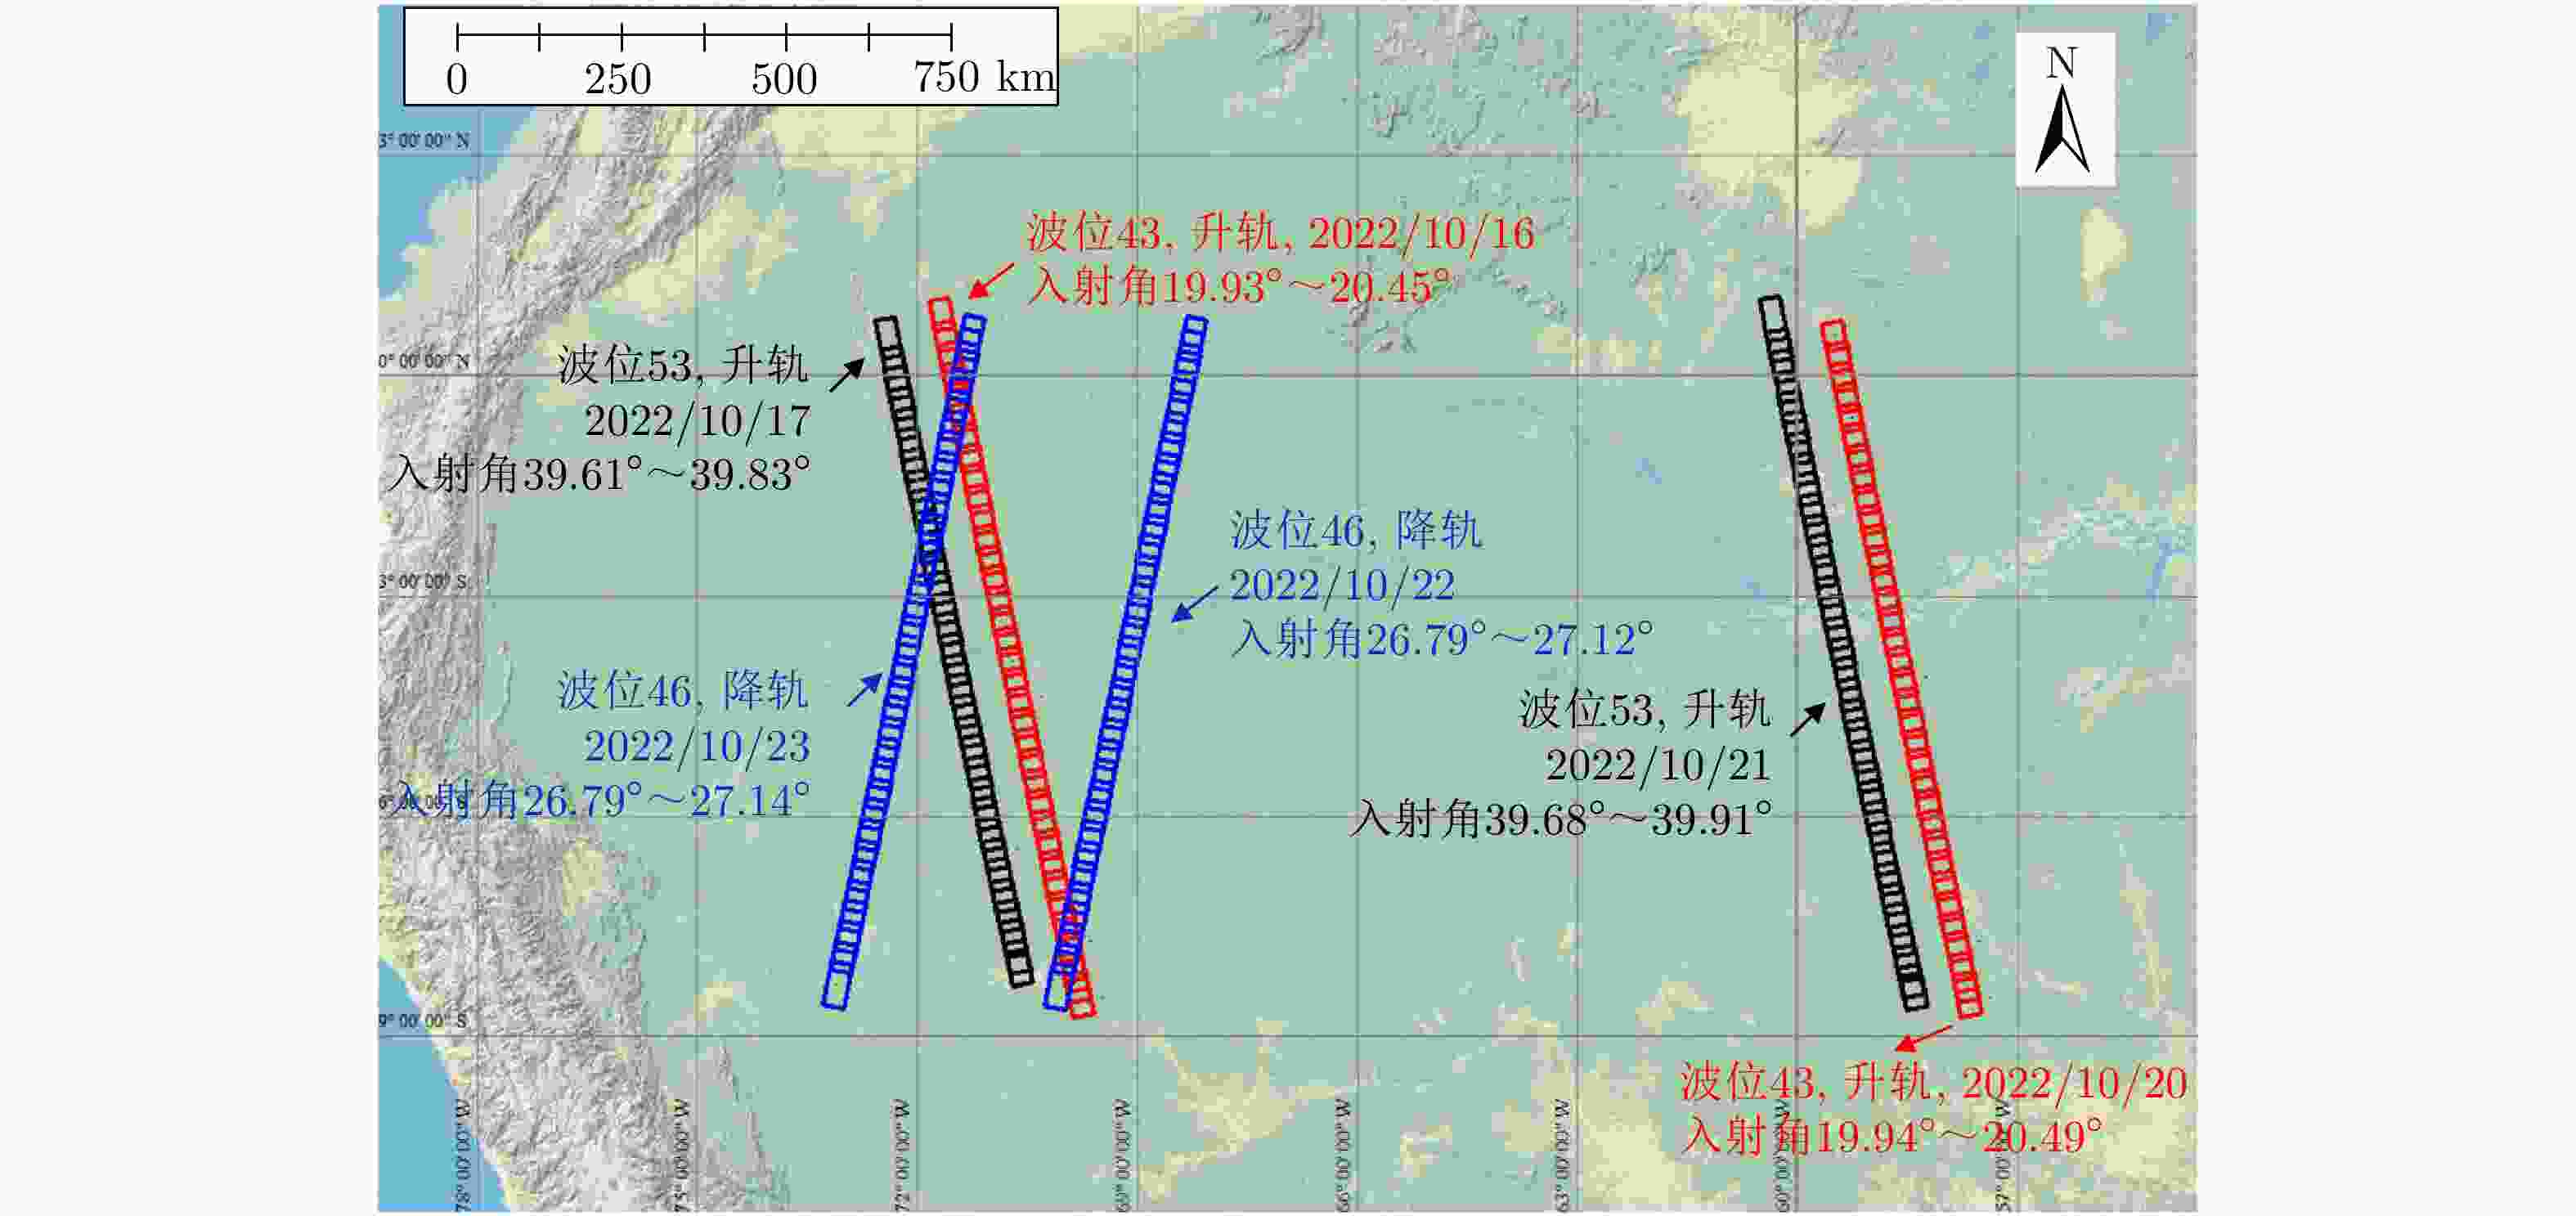
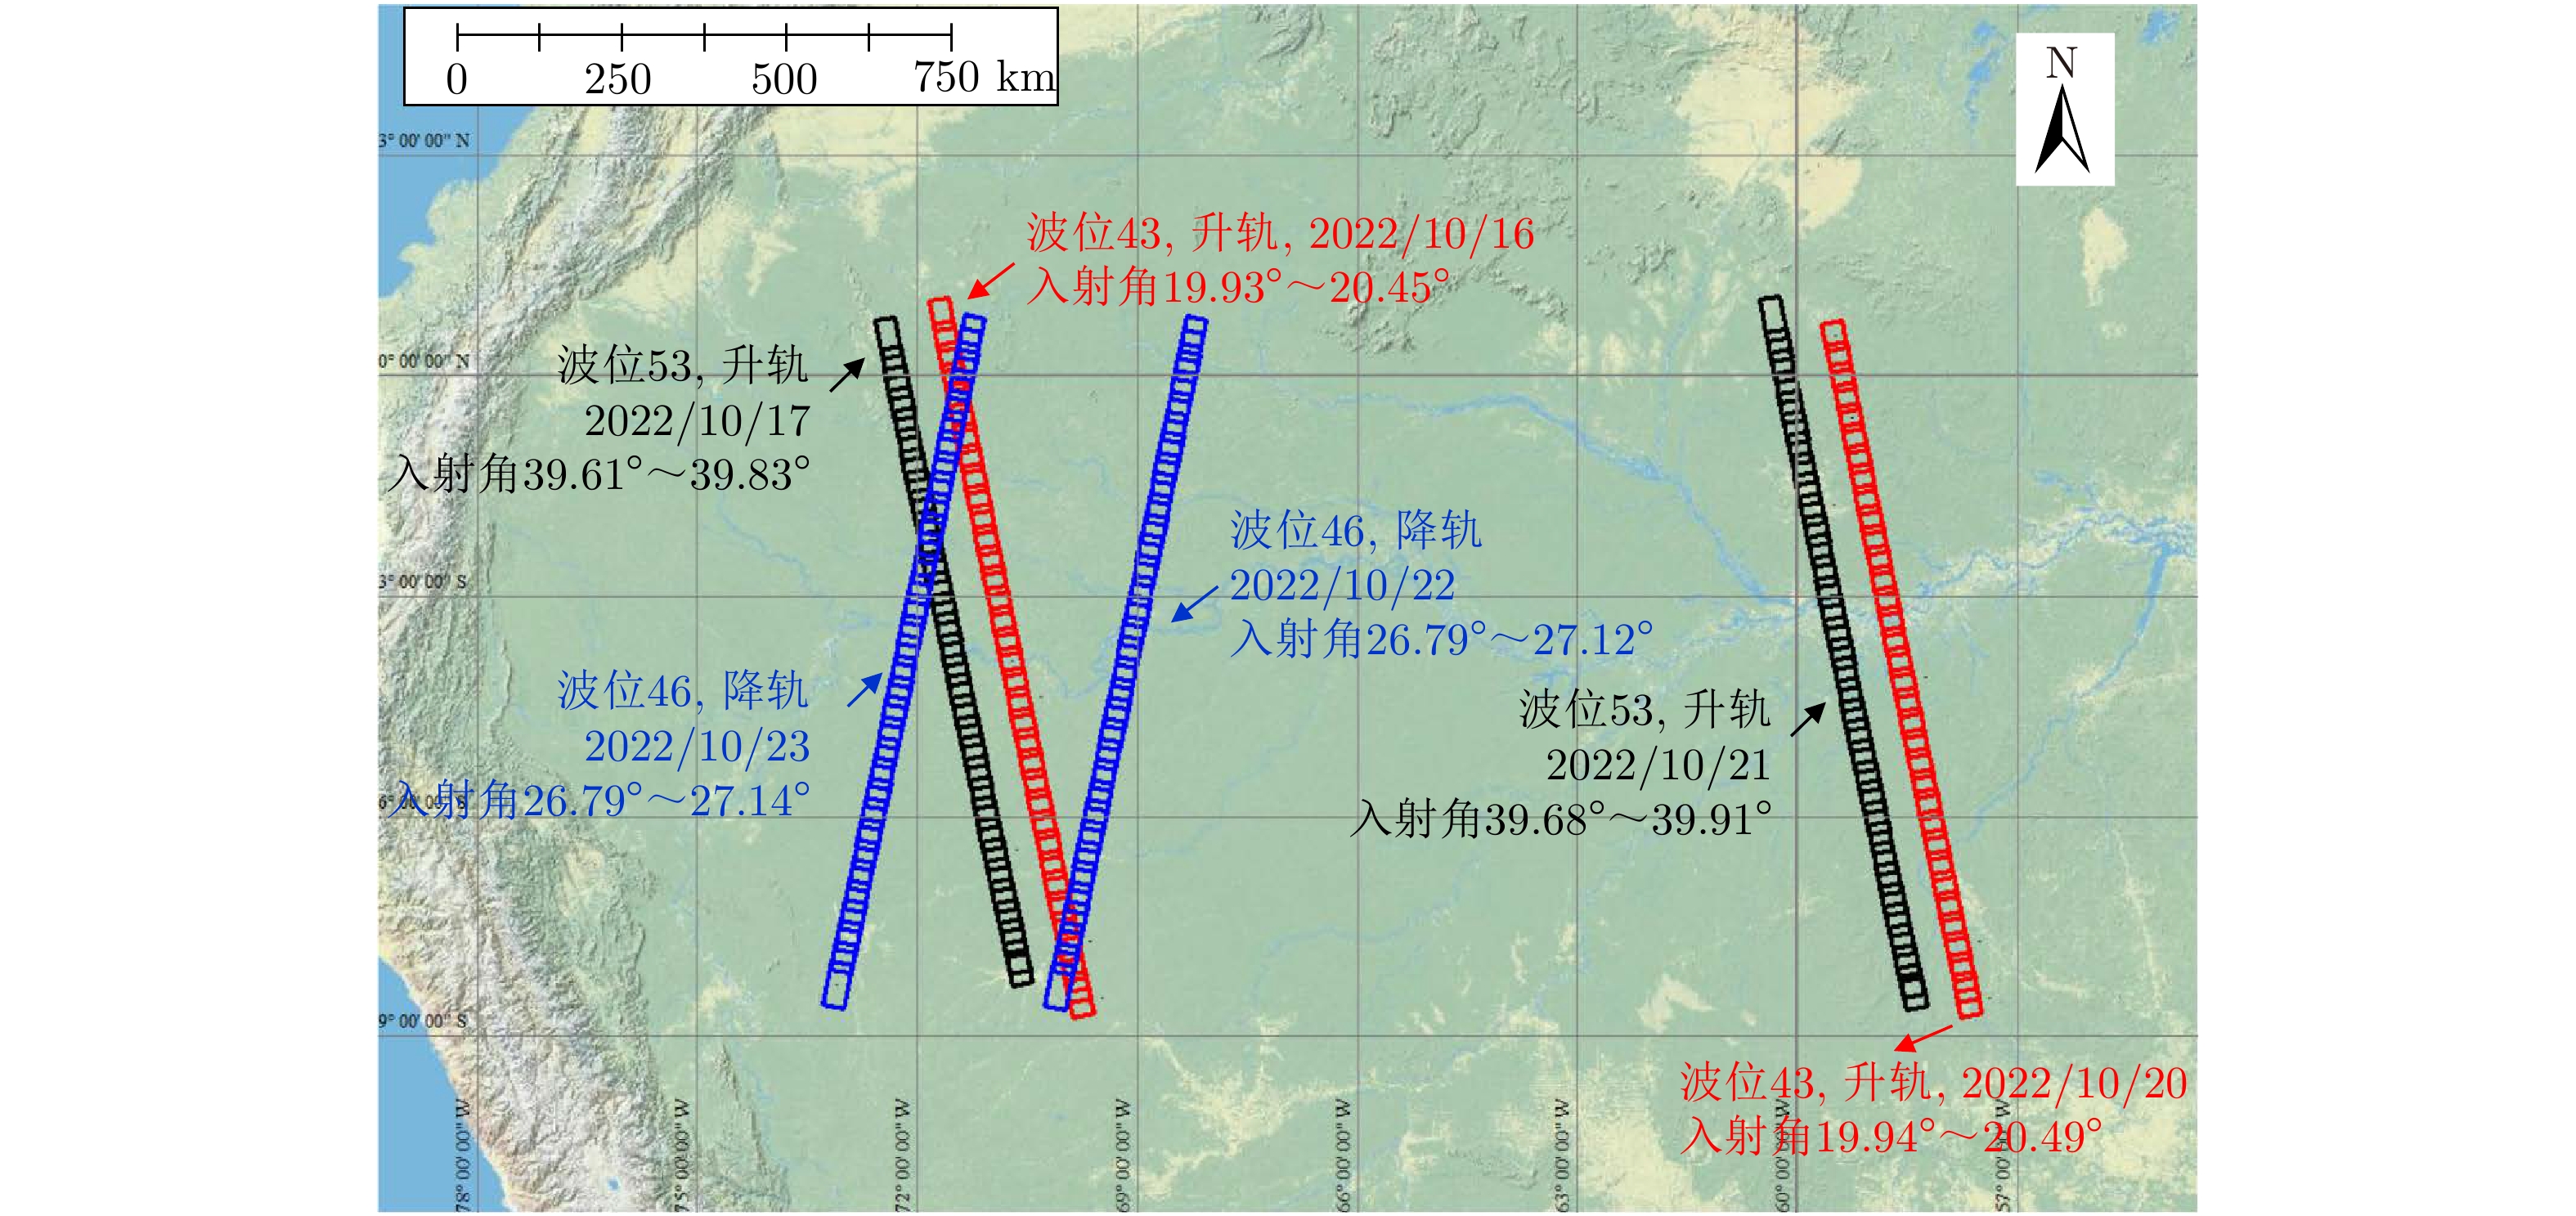
图 2 本文LT-1A热带雨林观测范围(共包含201景升轨、降轨全极化数据)
Figure 2. The LT-1A observation areas in the Amazon rainforest (including 201 images with full polarization of ascending and descending orbits)
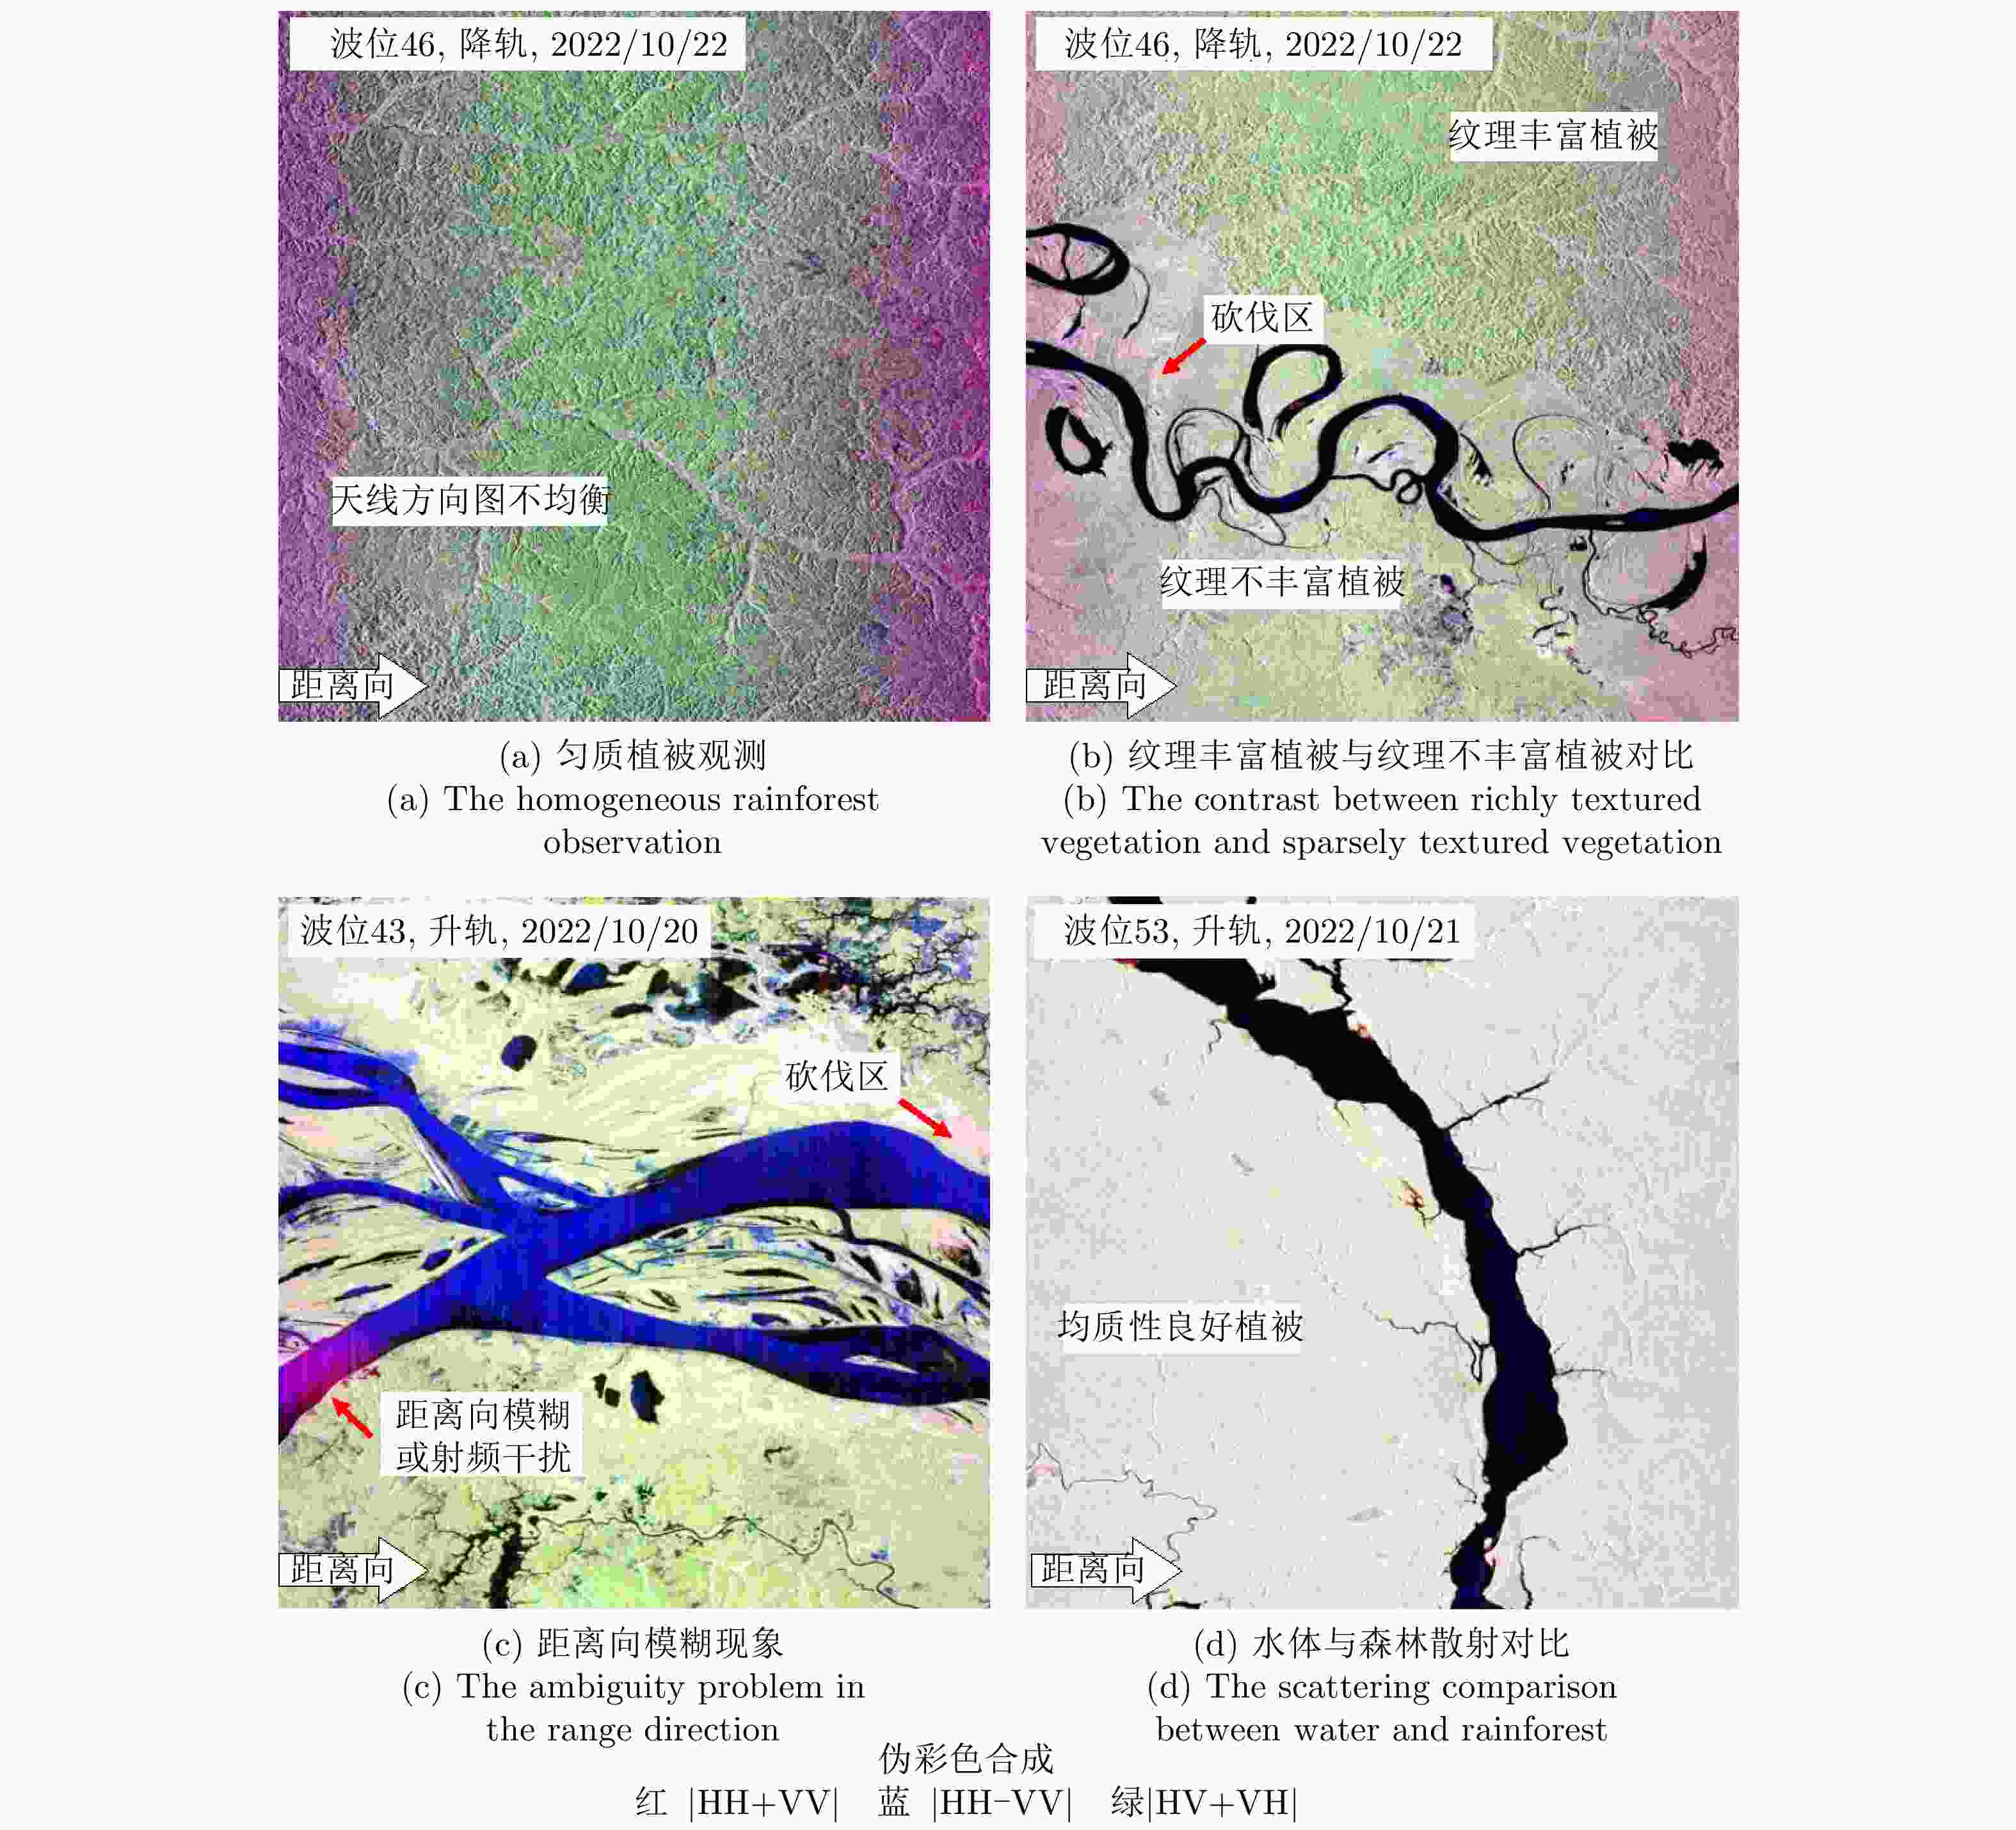
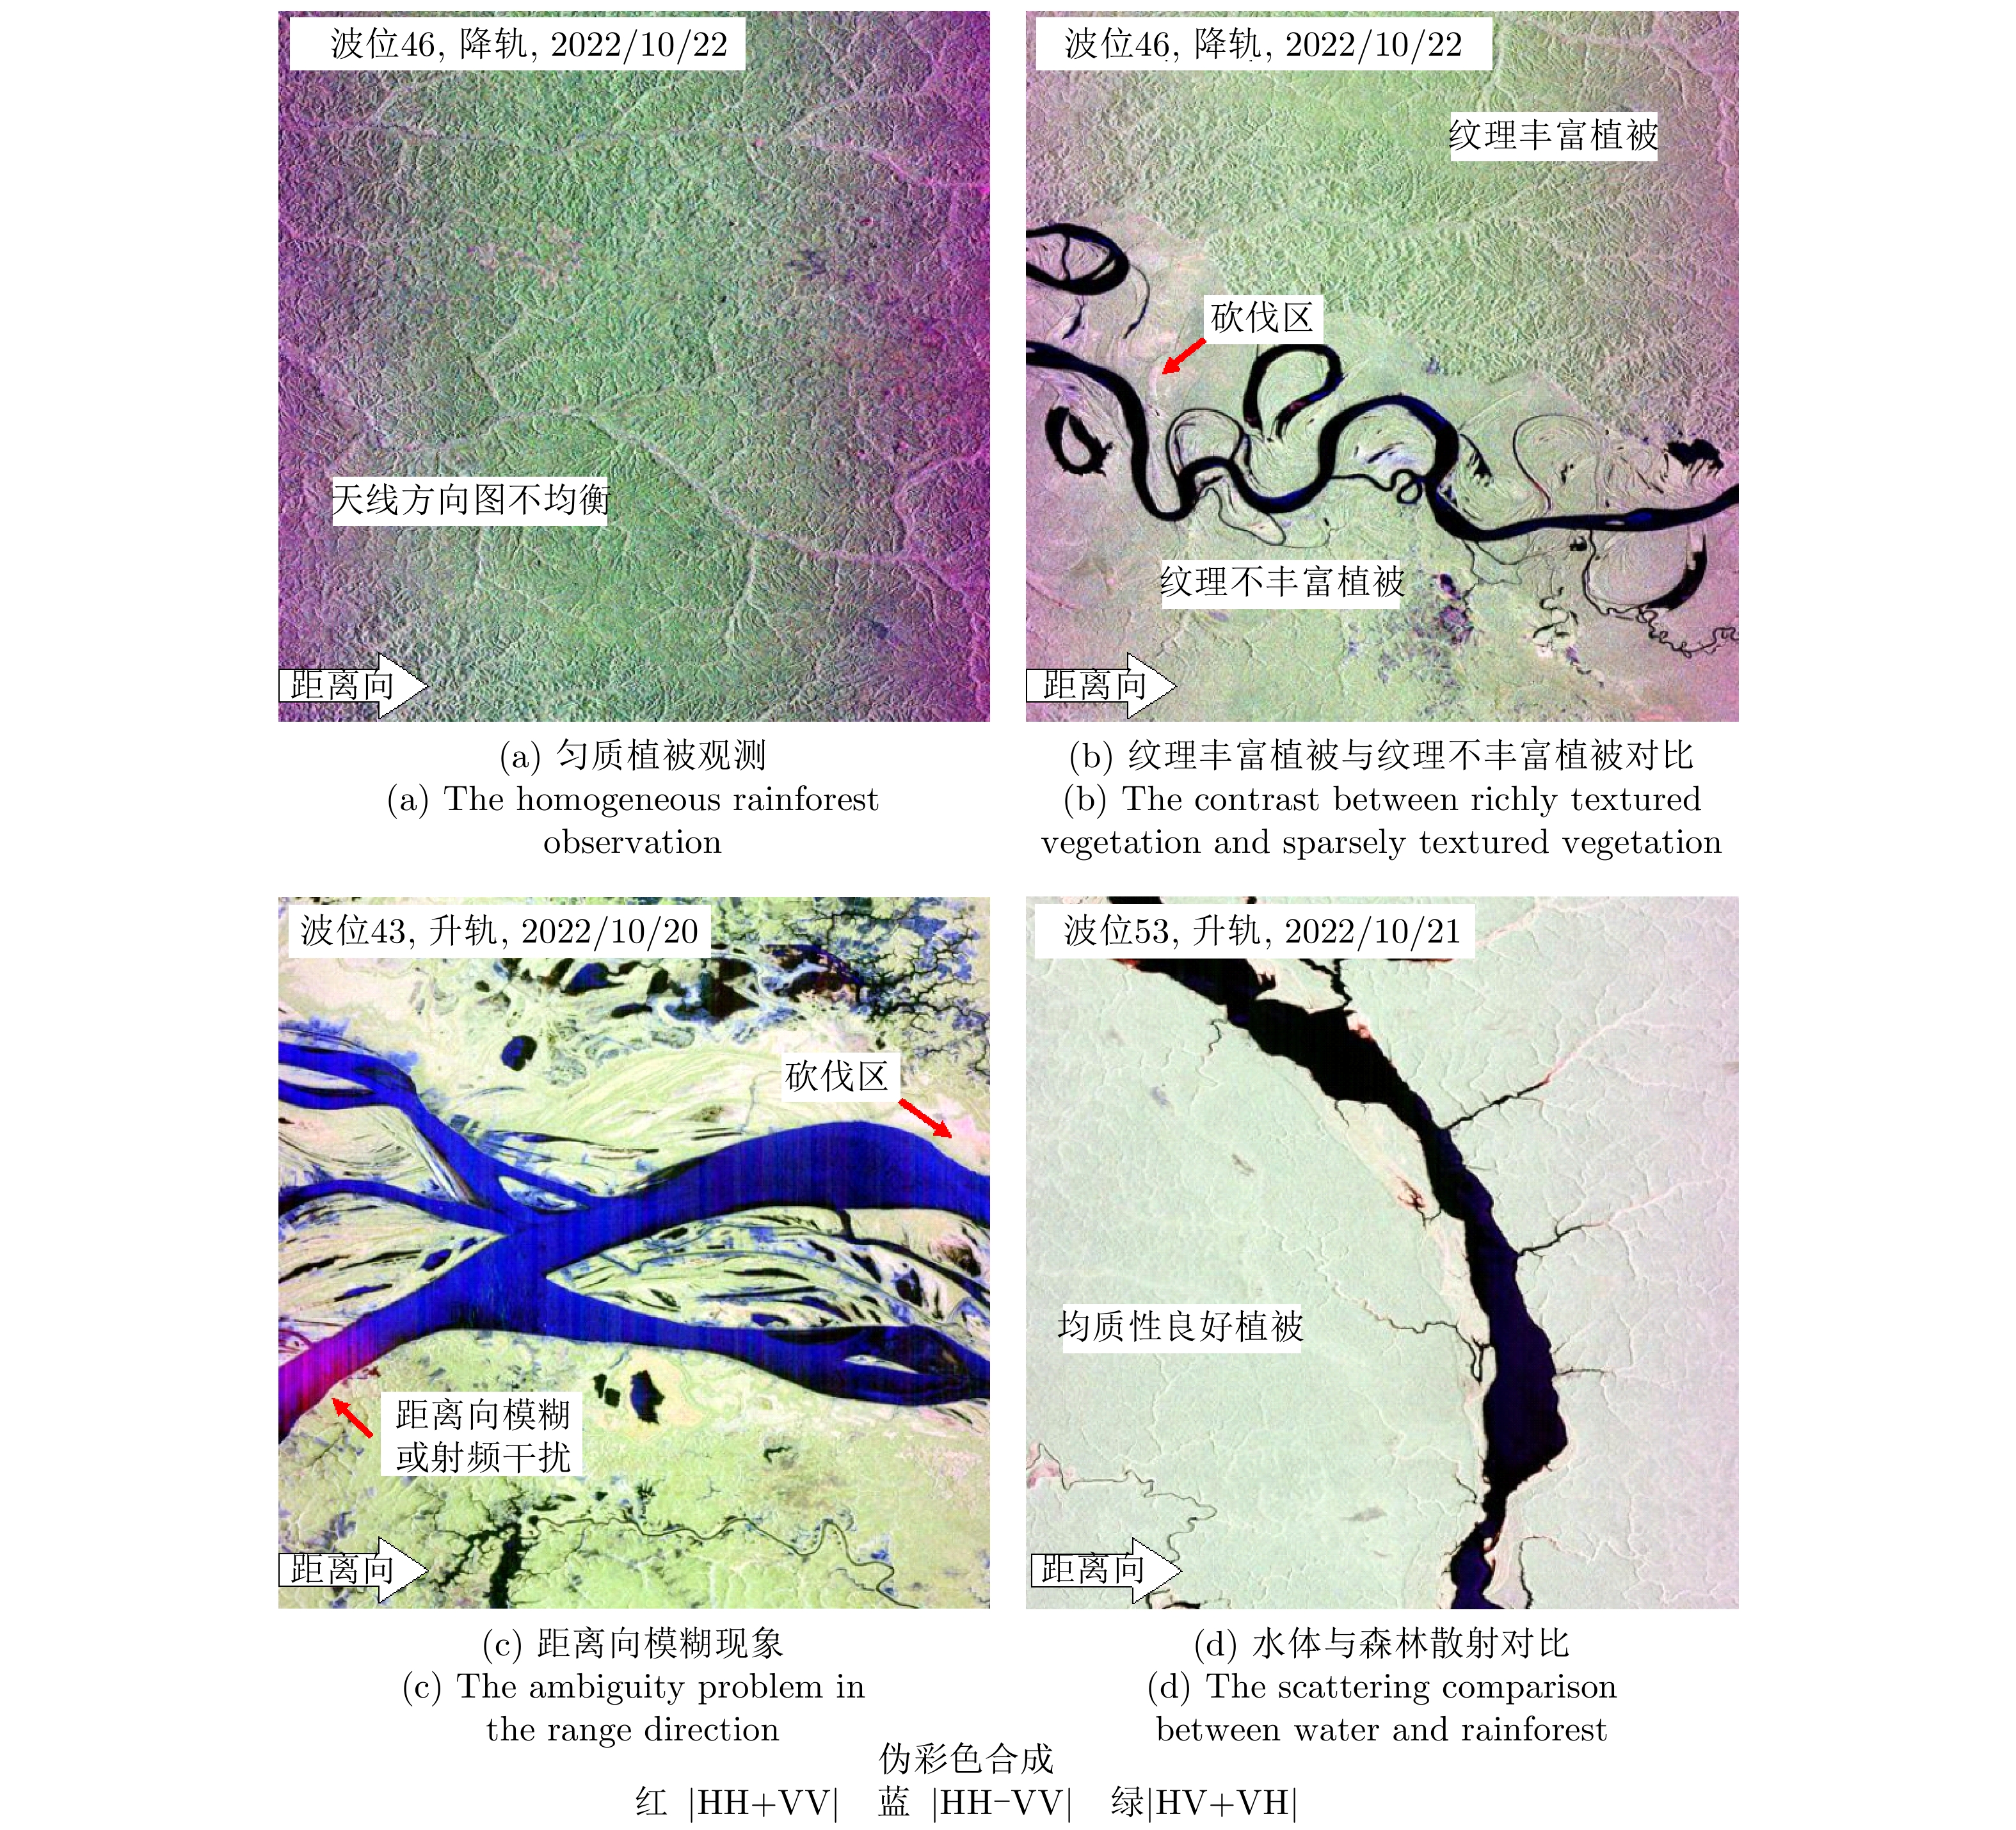
图 3 LT-1A热带雨林观测数据示例((a)—(d)为Pauli假彩色合成影像)
Figure 3. The LT-1A observations in the Amazon rainforest ((a)—(d) present the PauliRGB images)
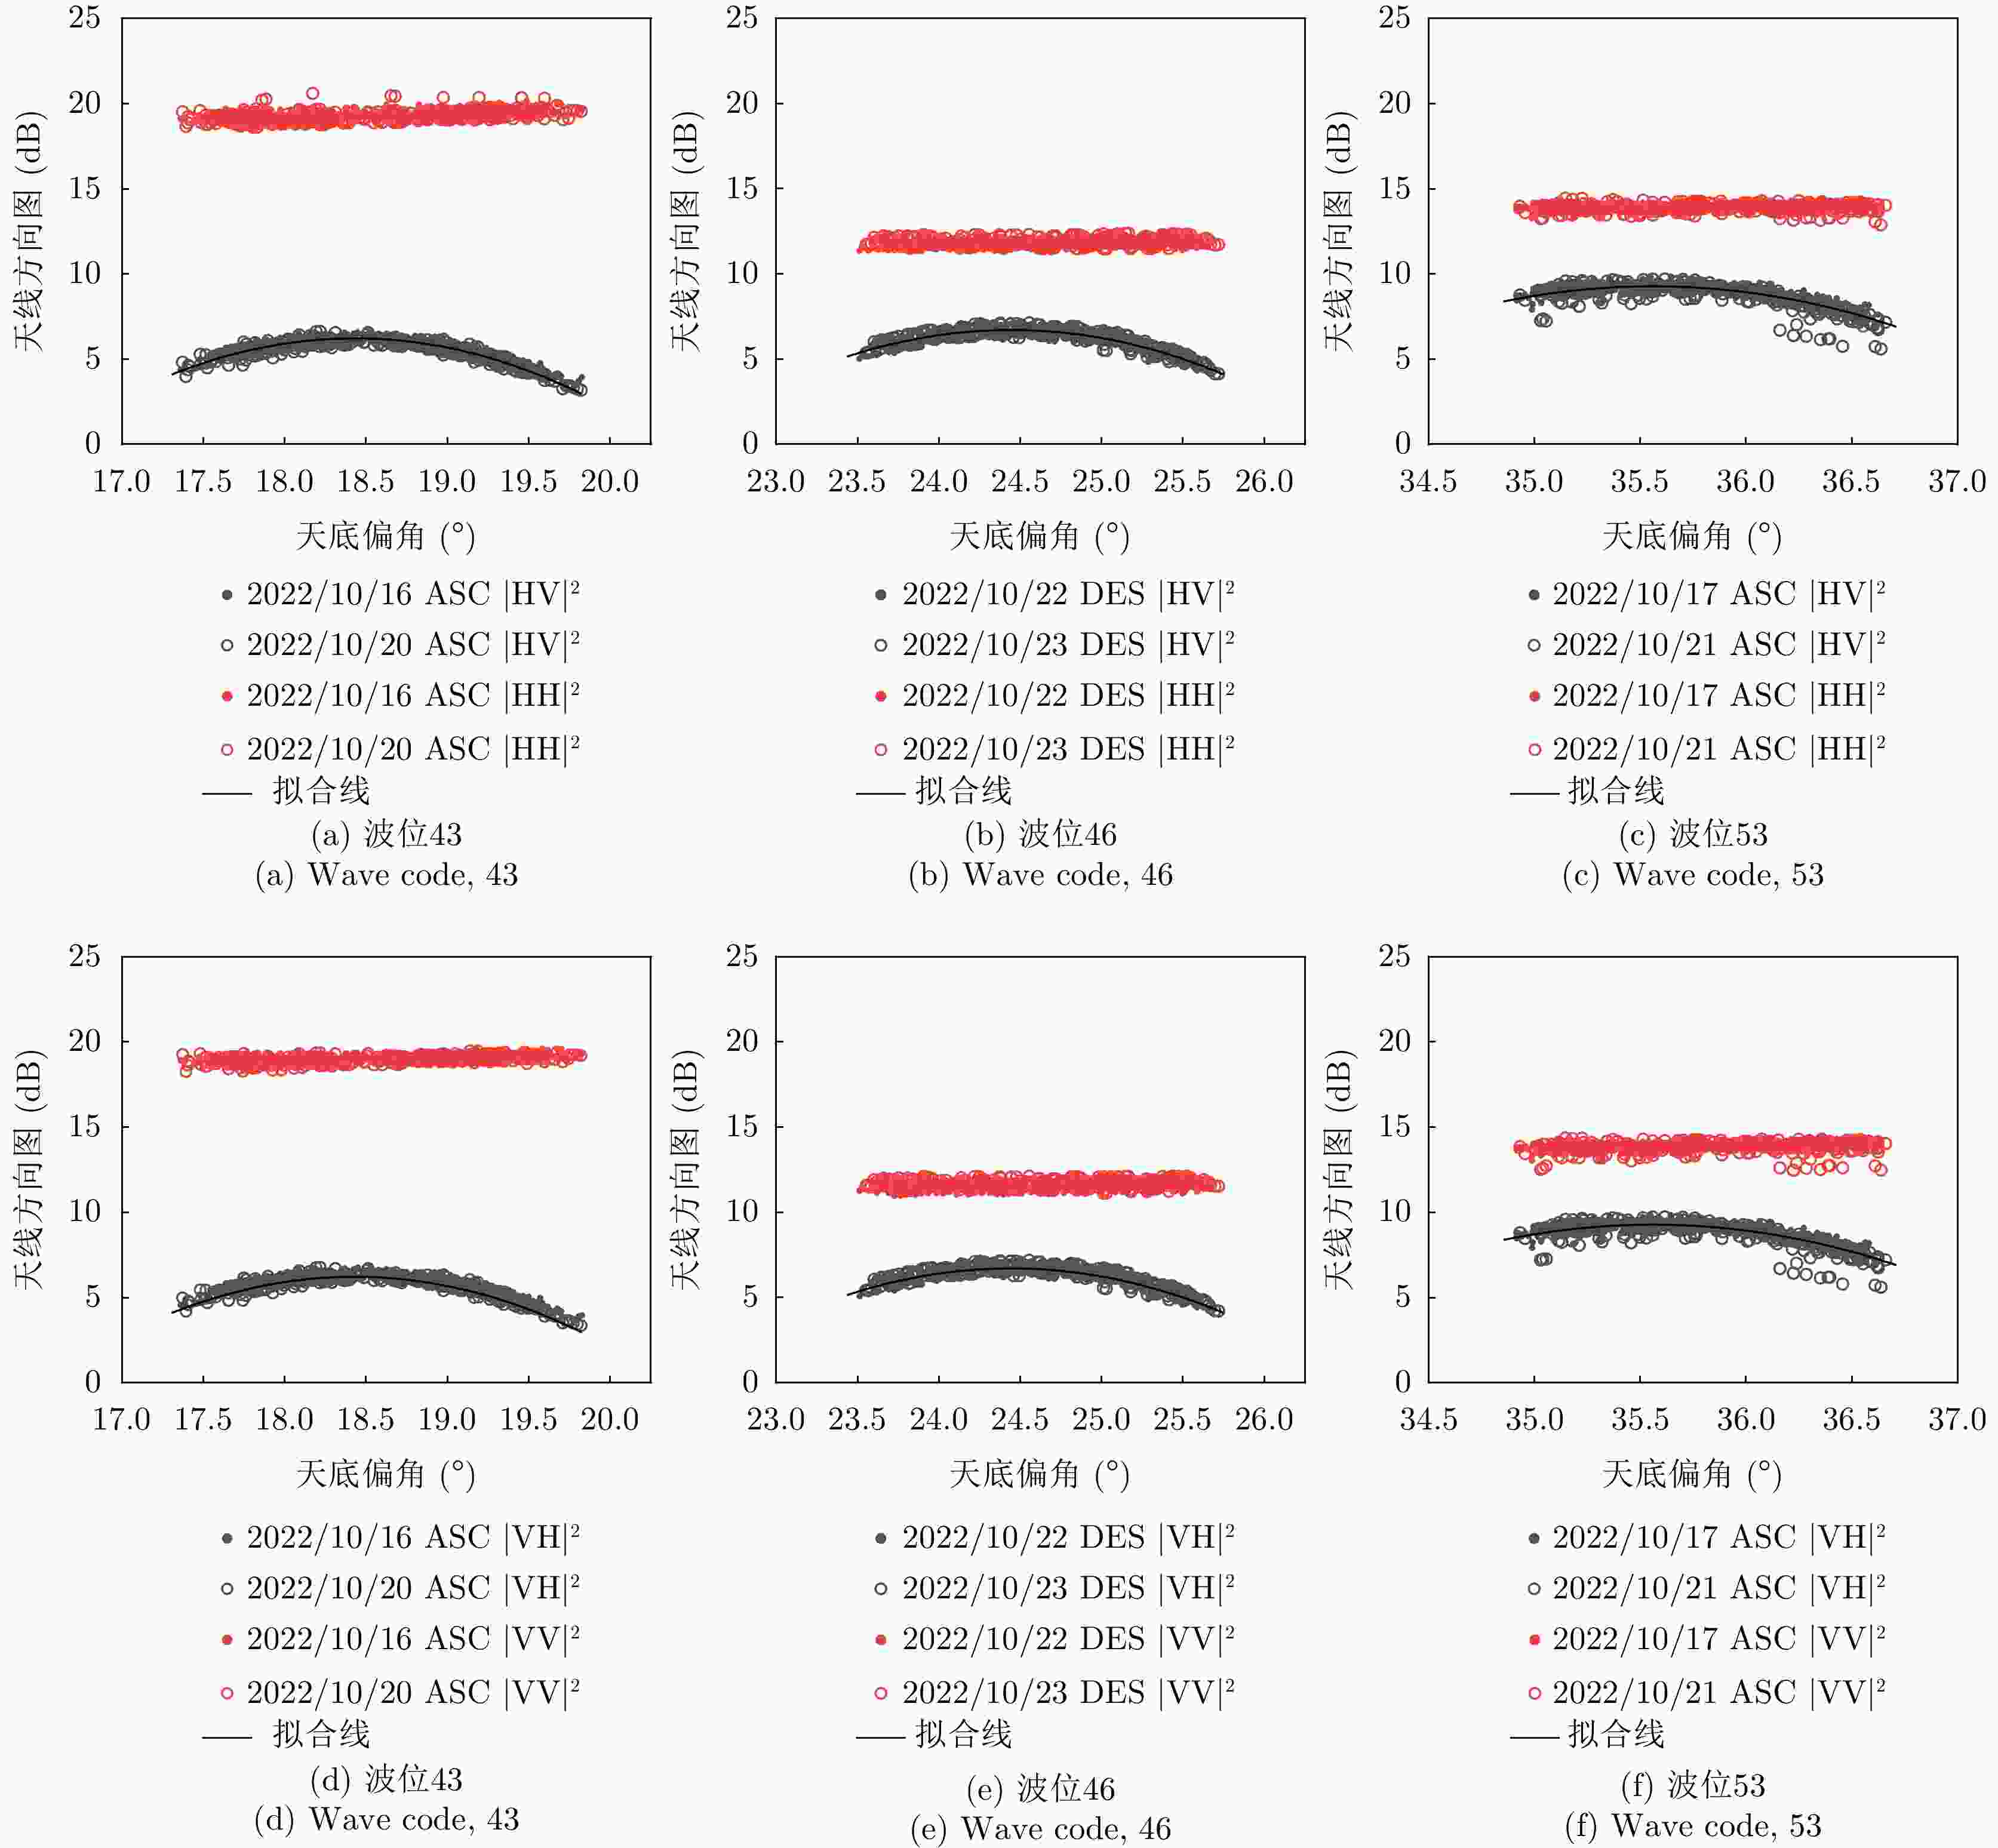
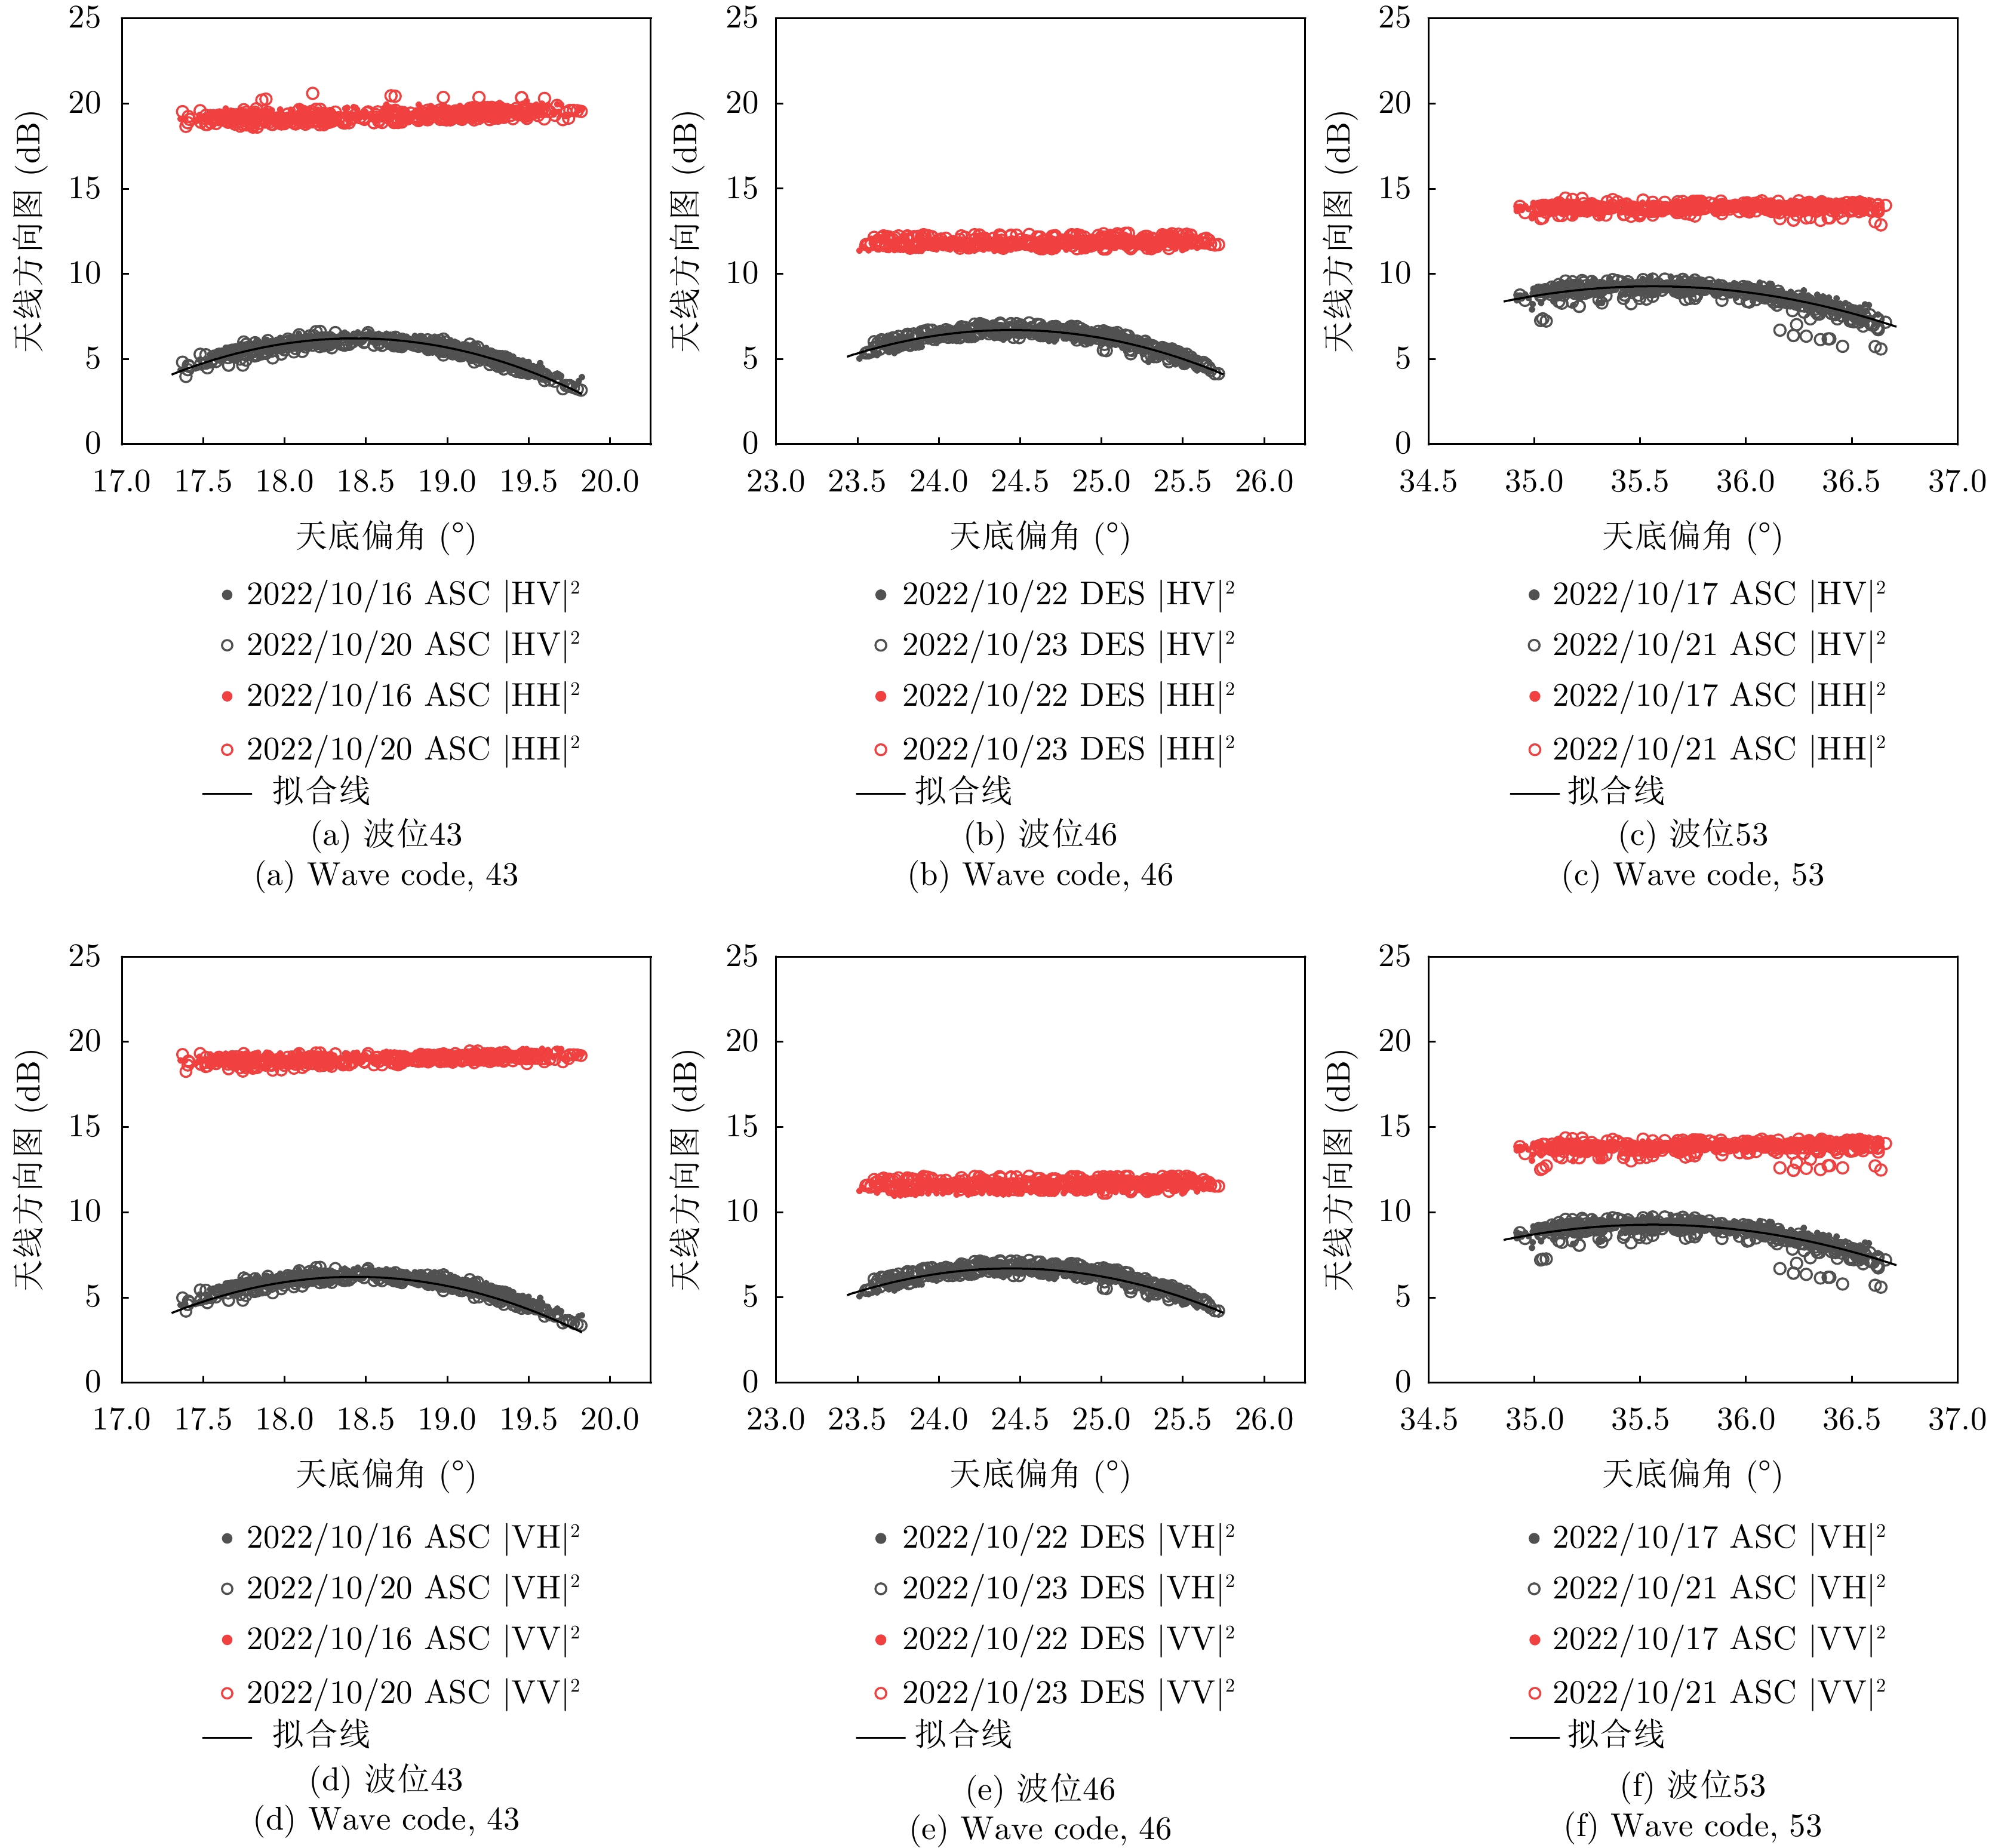
图 4 基于热带雨林的LT-1A天线方向图估计结果
Figure 4. The antenna pattern estimation results based on the Amazon rainforest observations
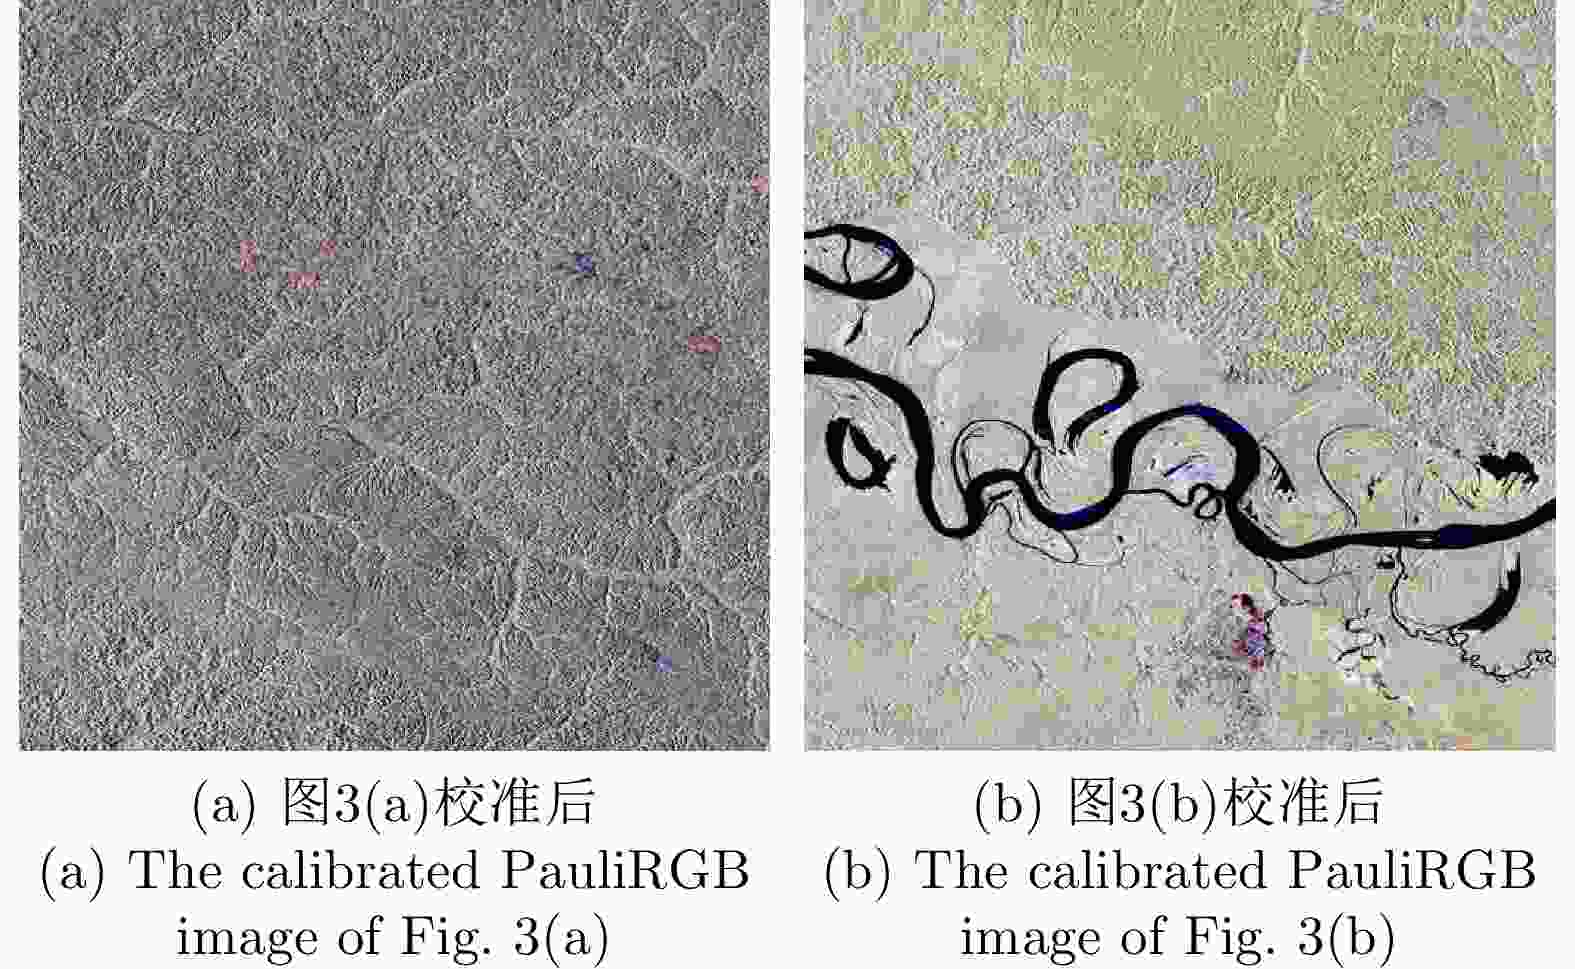
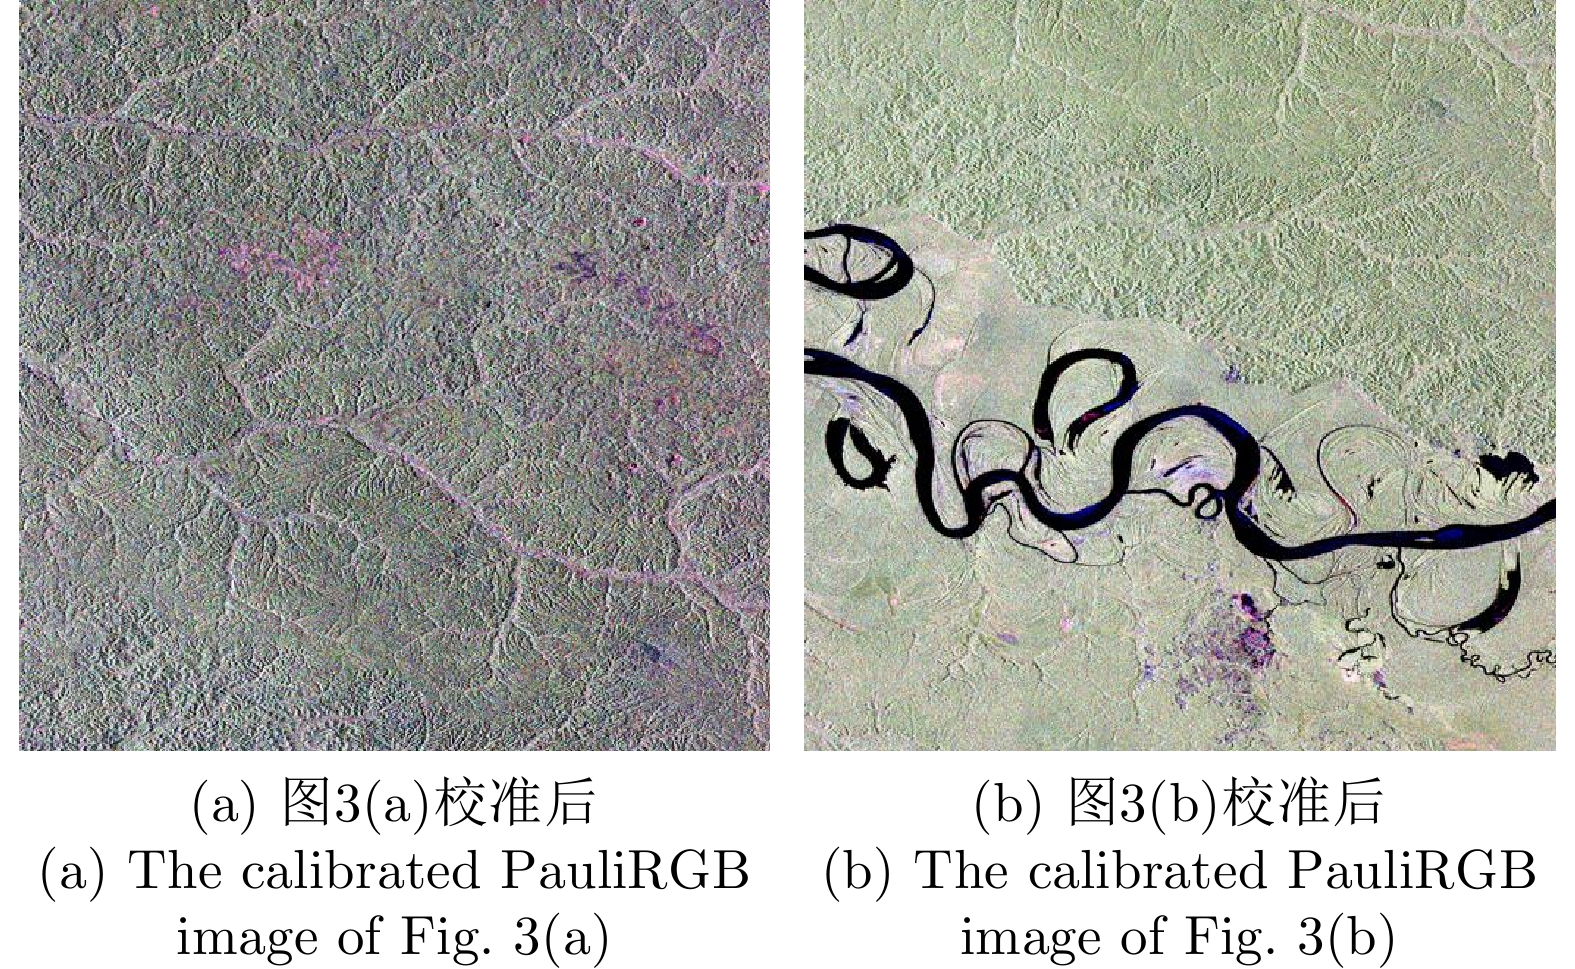
图 5 天线方向图校准后LT-1A数据示例
Figure 5. The LT-1A samples after calibrating the antenna pattern
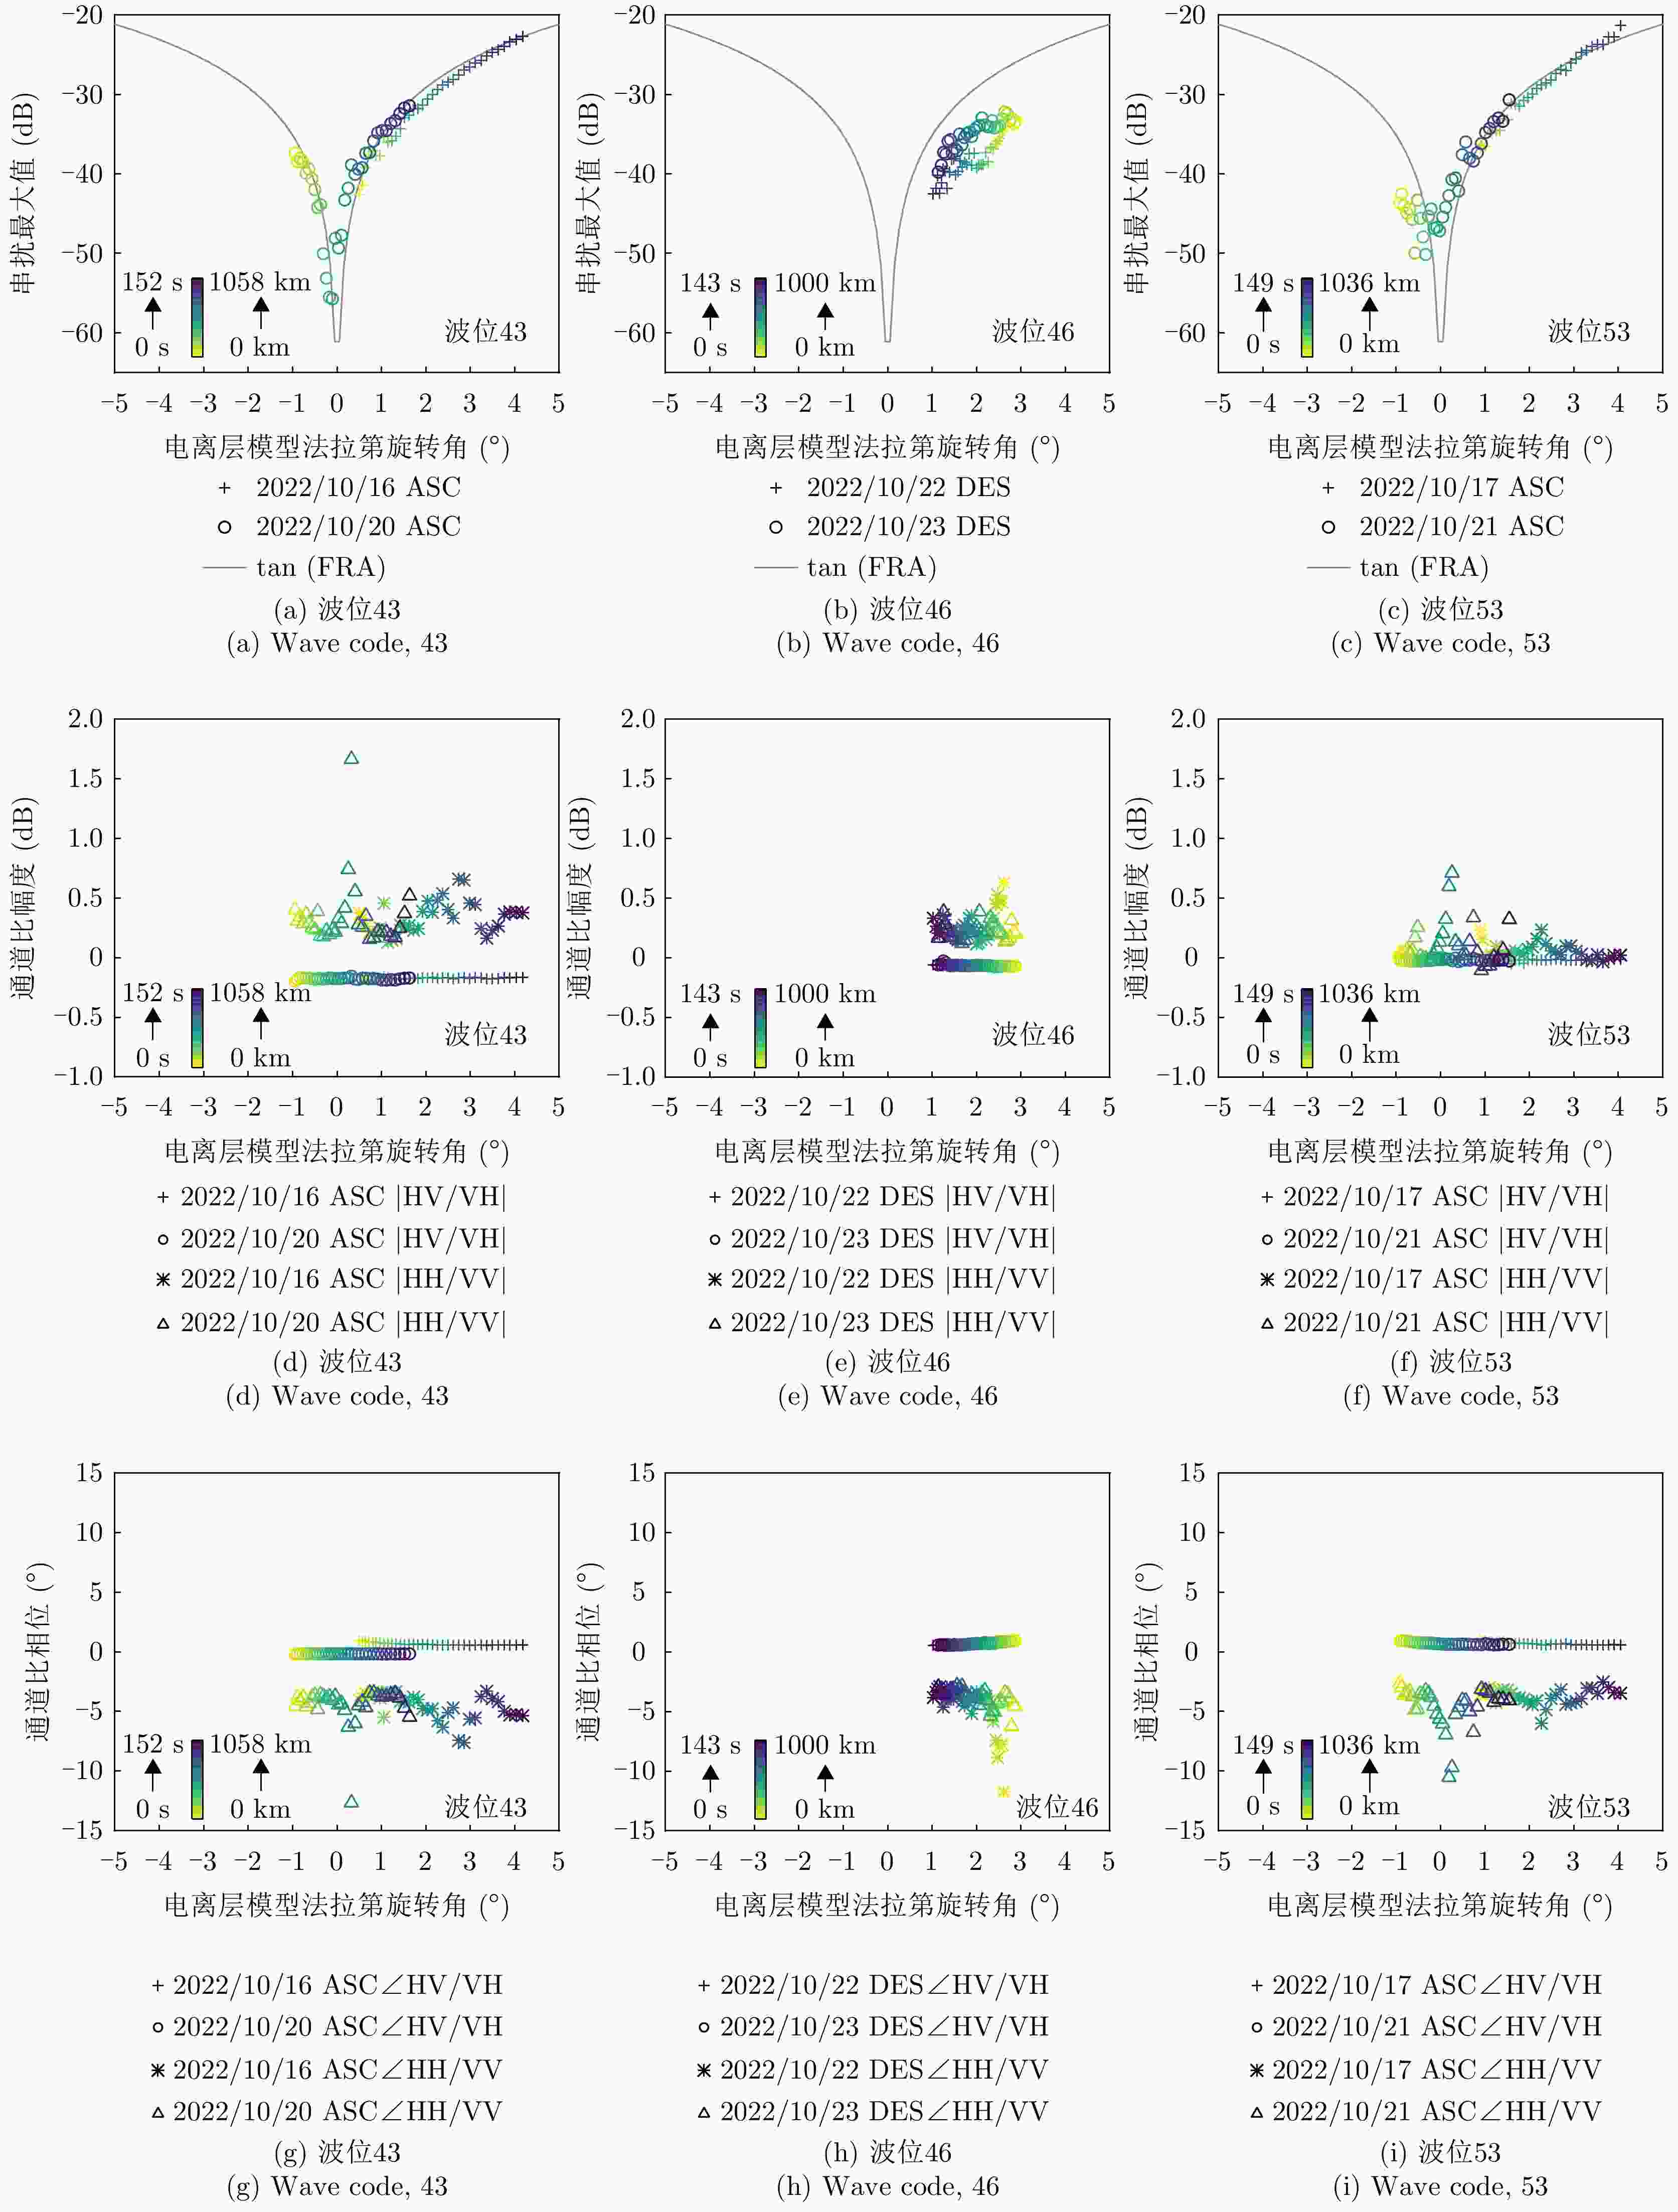
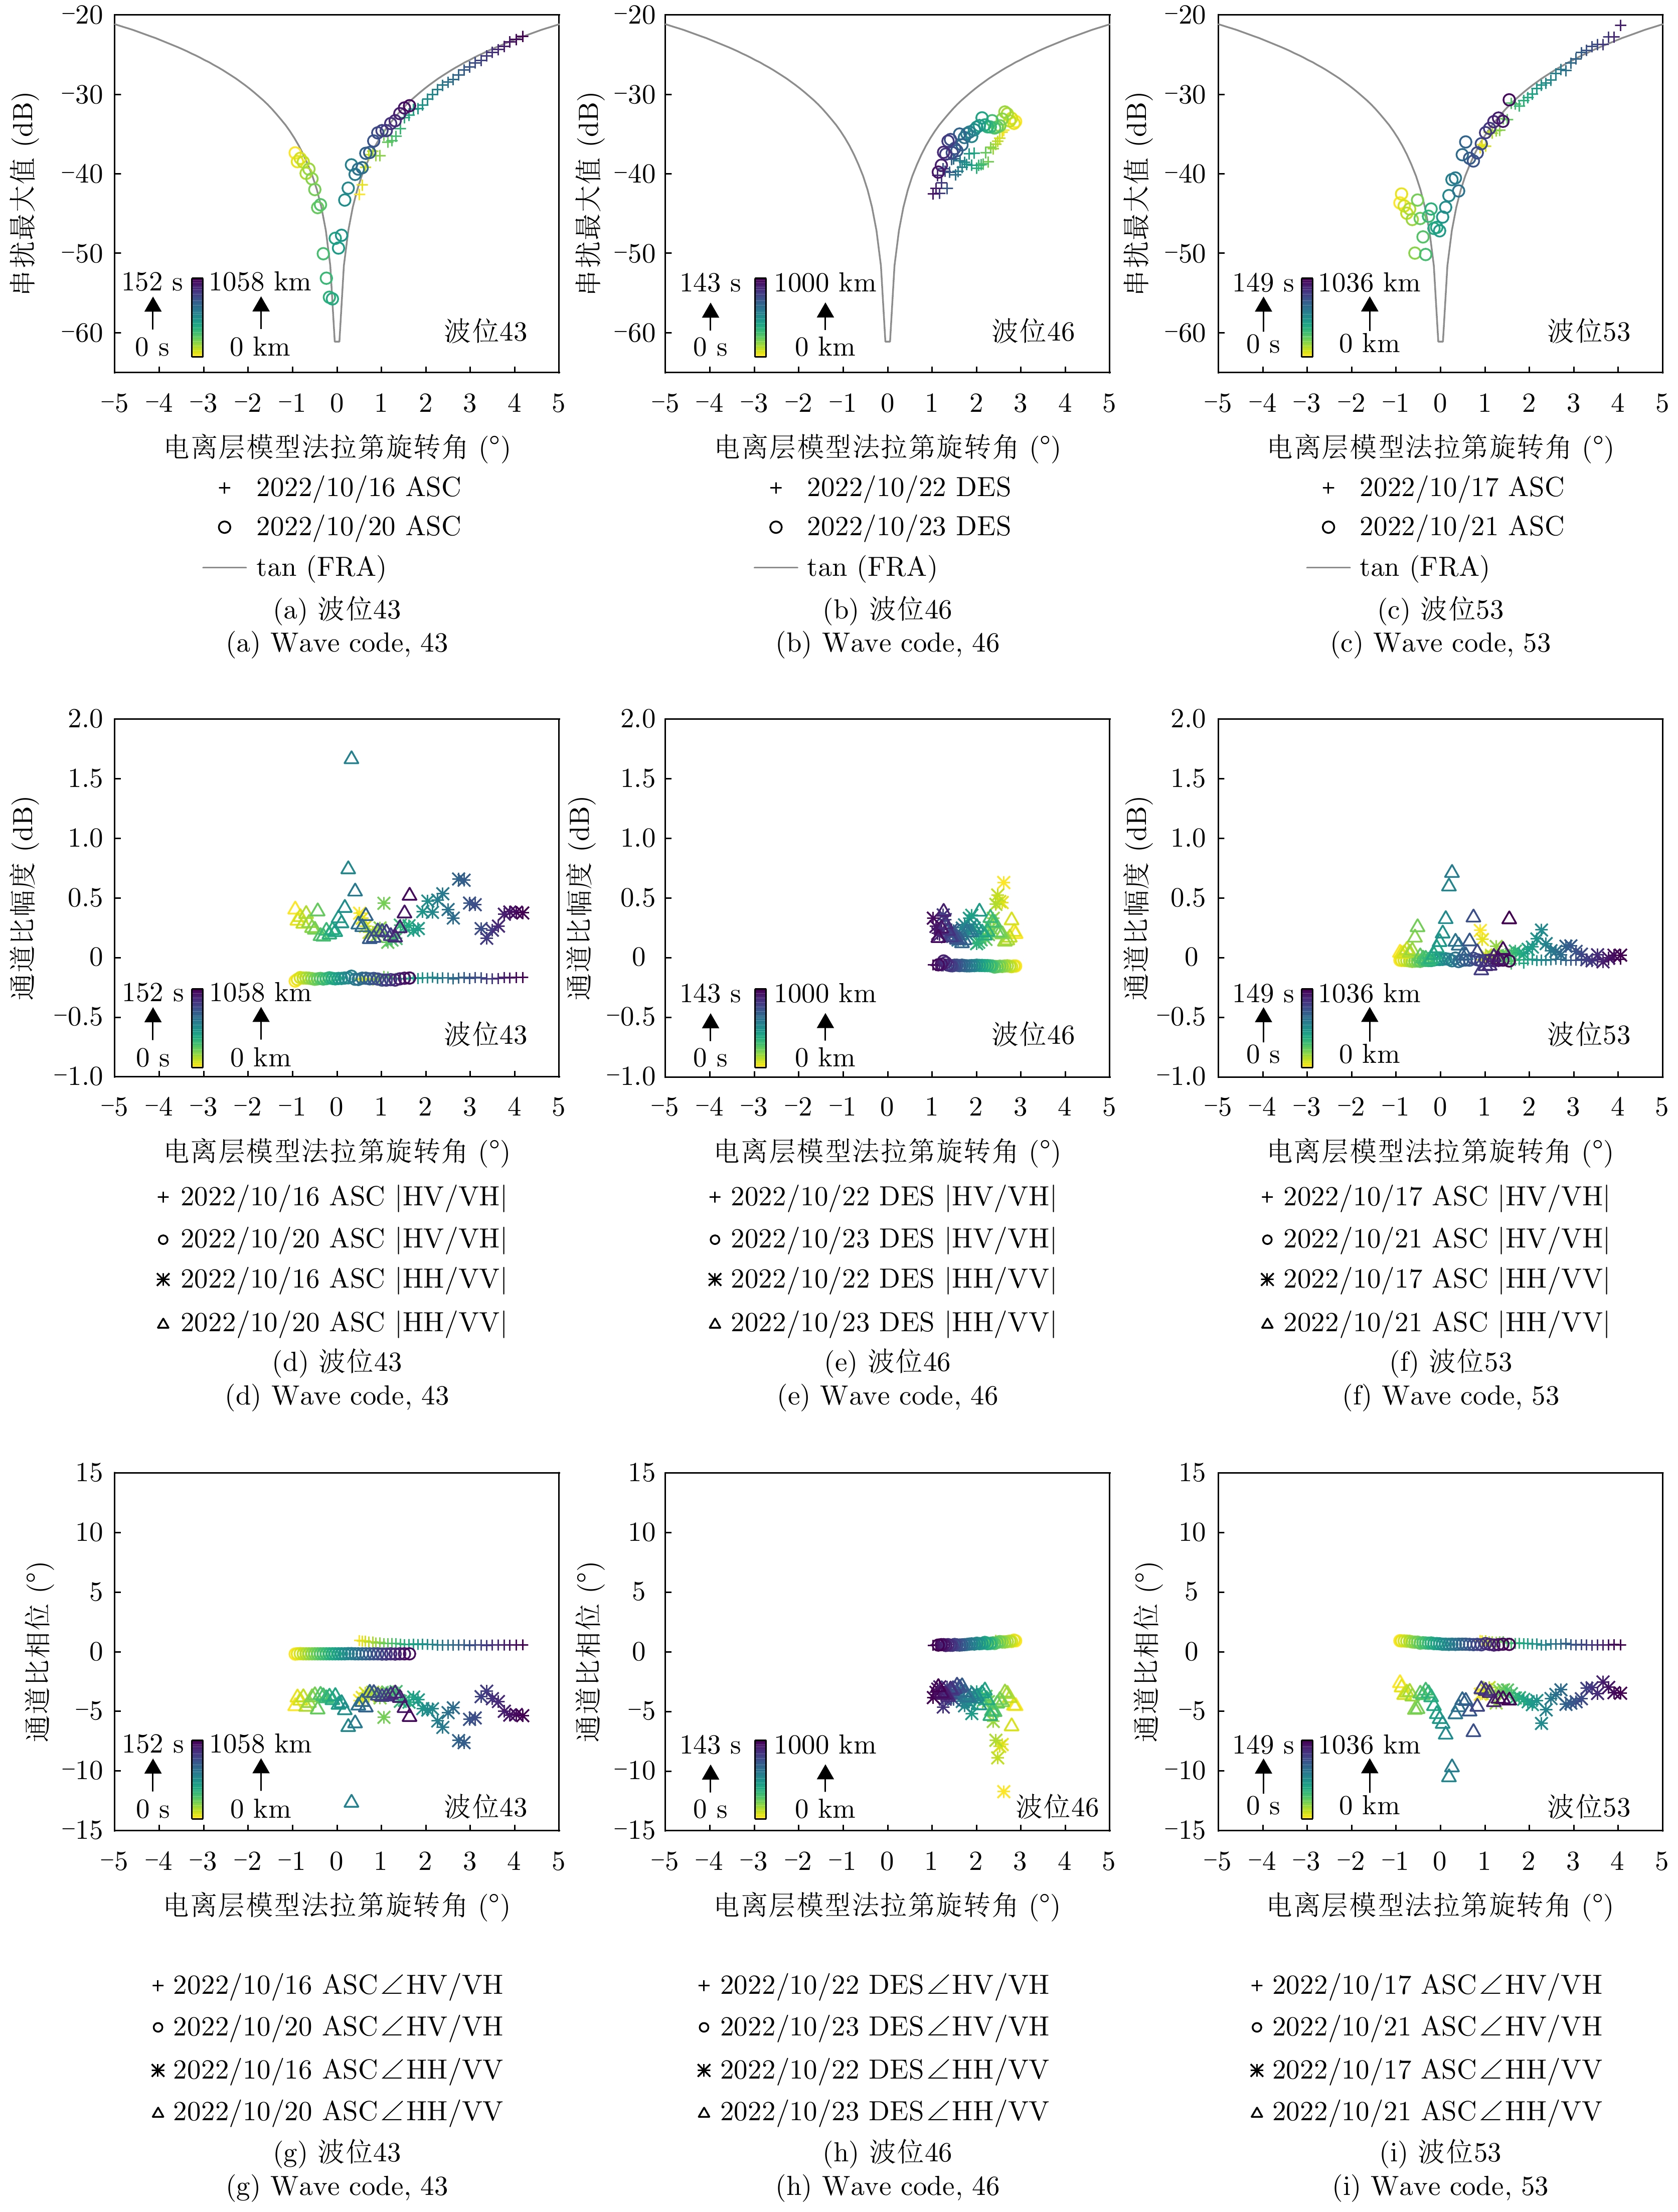
图 6 雨林地区LT-1A影像“总体极化畸变”与电离层模型获取的法拉第旋转角先验(横轴)。ASC表示升轨、DES表示降轨。
Figure 6. The contrast between the theoretical faraday rotation angle determined by the Ion. Model and the polarimetric distortions of the LT-1A data in the Amazon rainforest. ASC and DES represent the ascending and descending orbits, respectively.

图 7 基于雨林地区的系统等效热噪声估计
Figure 7. The equivalent thermal noise estimation based on the rainforest observations
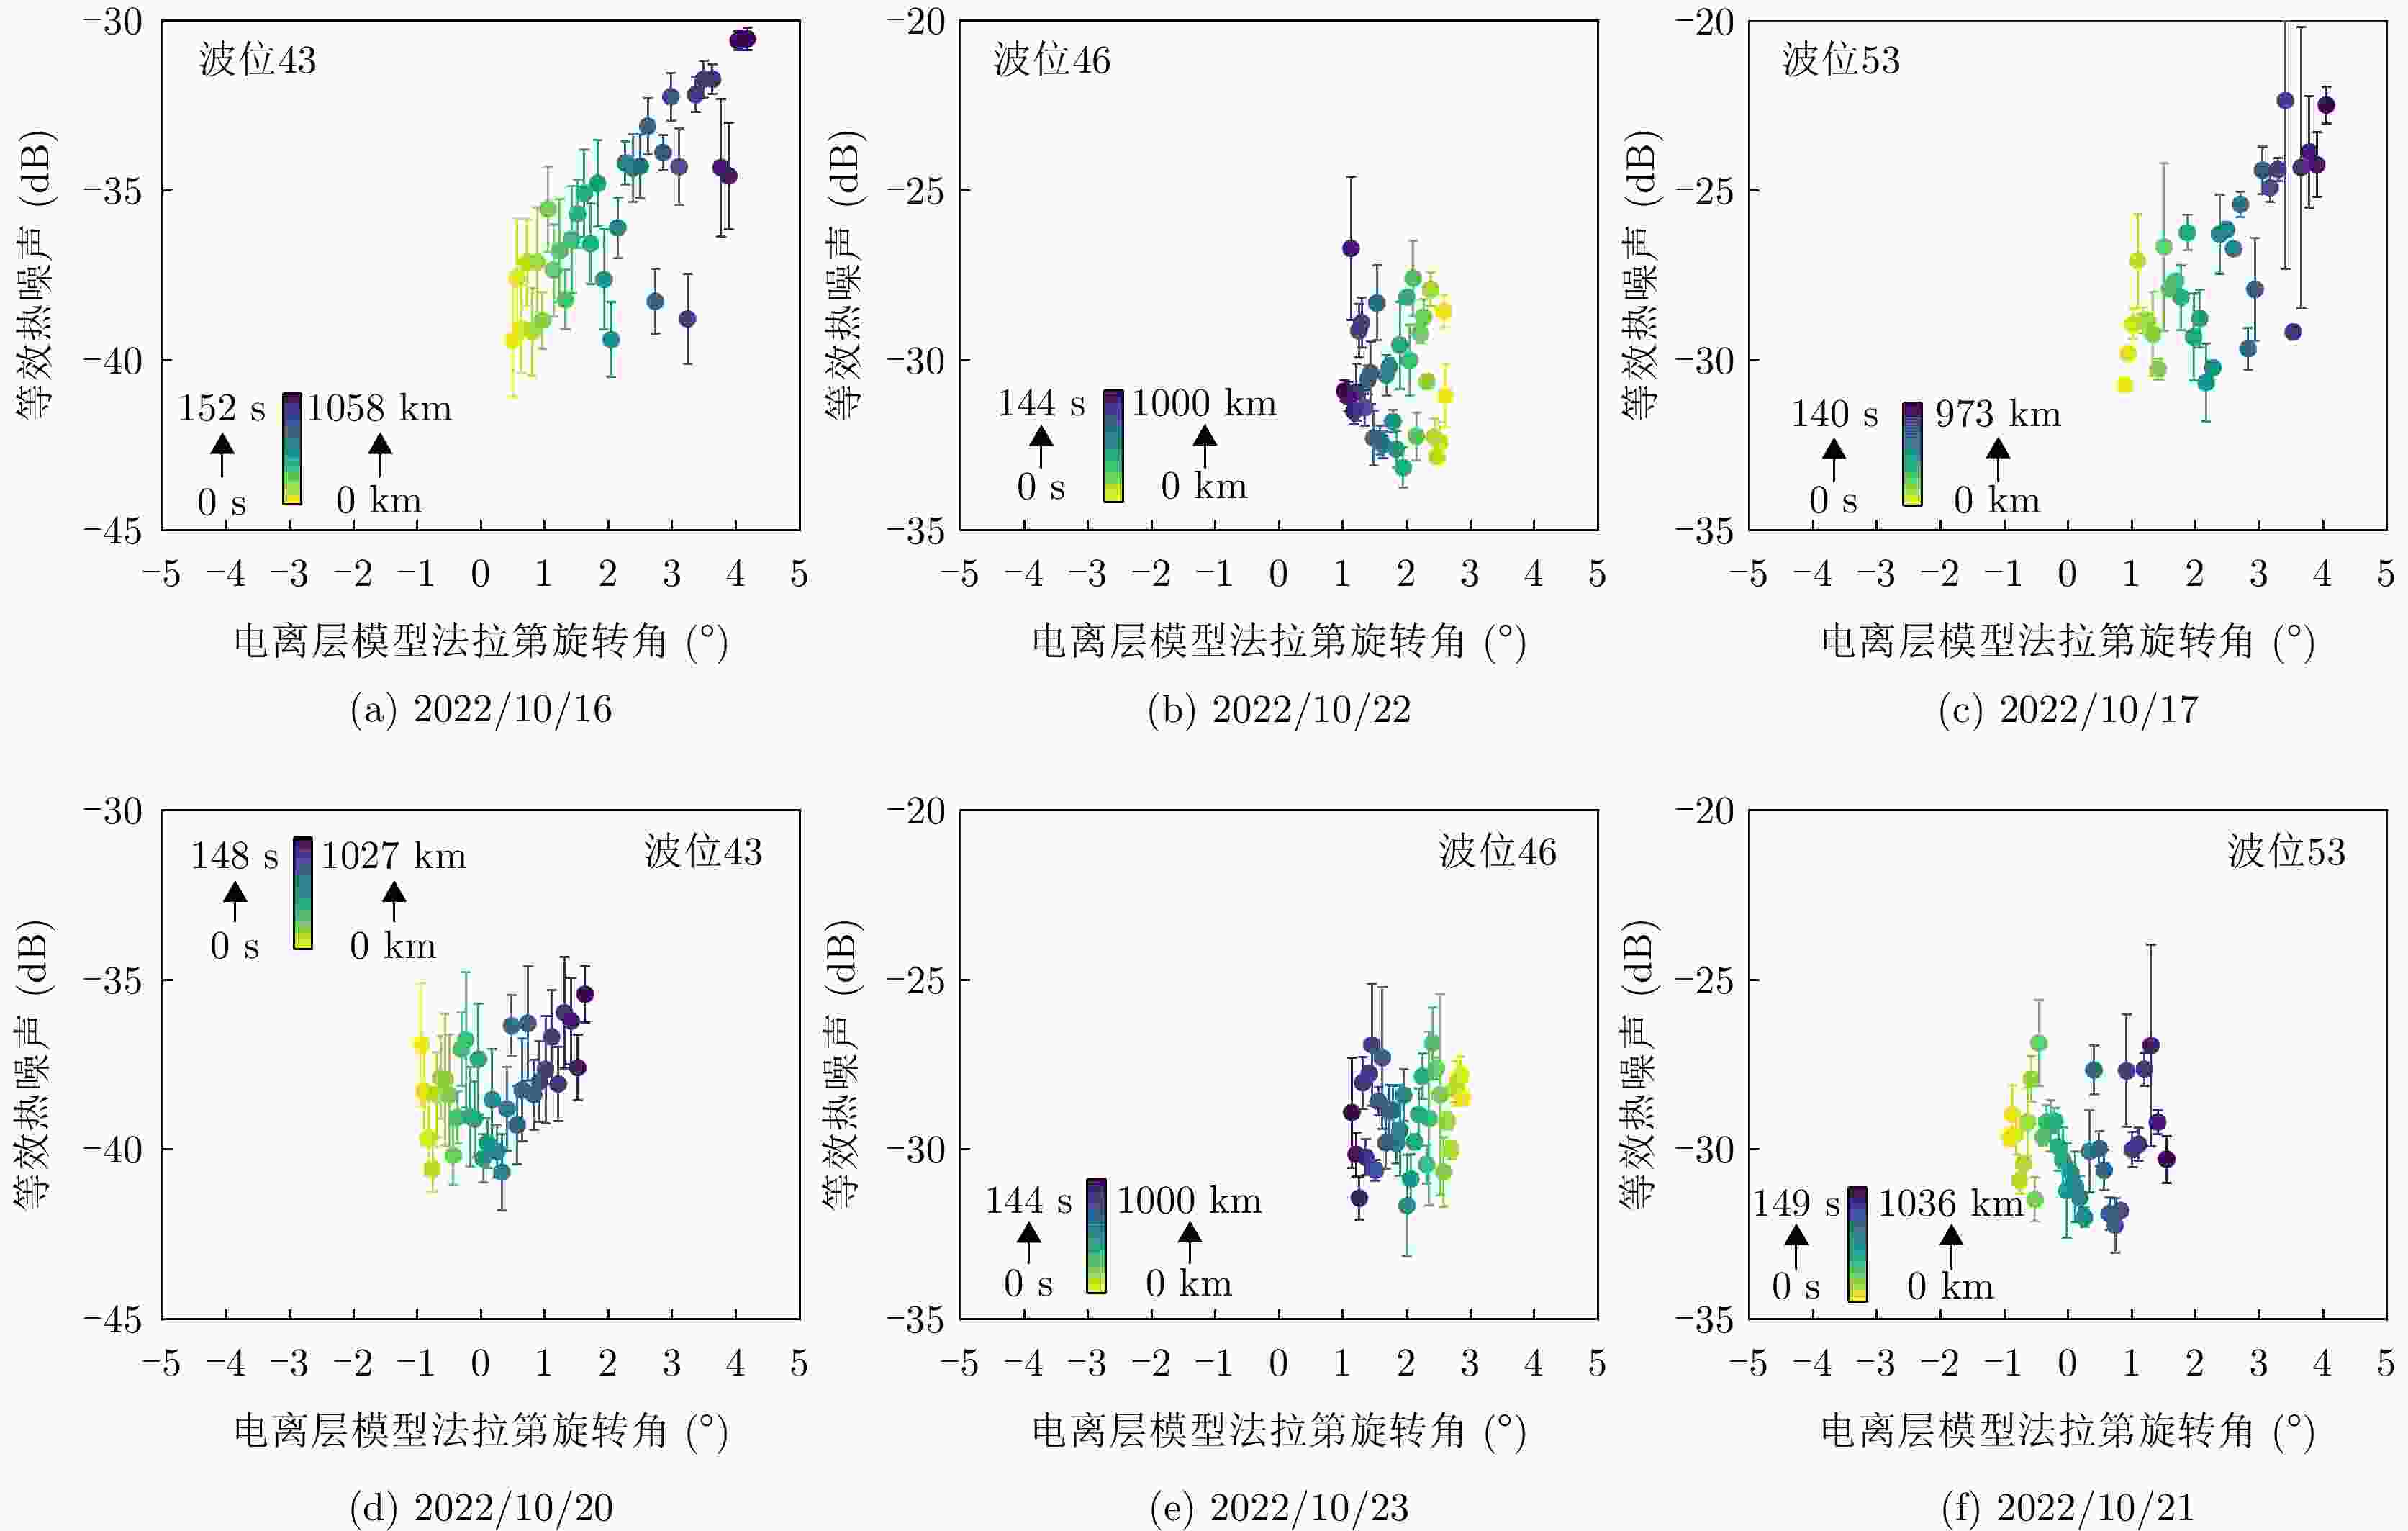
图 8 基于雨林地区的LT-1A影像系统等效热噪声均值与1倍标准差
Figure 8. The statistical levels of LT-1A equivalent thermal noise estimated by the rainforest observations
表 1 天线方向图校准后不同极化影像雨林像素均值(Mean)与三倍标准差(Std)
Table 1. The Mean and 3 times Std level of the Amazon rainforest observations after calibrating the antenna pattern
极化
通道波位43 (dB) Mean±3$* $Std 波位 46 (dB) Mean±3$* $Std 波位53 (dB) Mean±3$* $Std 2022/10/16 2022/10/20 2022/10/22 2022/10/23 2022/10/17 2022/10/21 HH 19.43±0.80 19.26±0.95 11.70±0.61 11.91±0.63 13.96±0.56 13.87±0.69 HV 6.34±0.72 6.13±0.63 6.63±0.67 6.80±0.62 9.36±0.77 9.18±1.20 VH 6.51±0.72 6.30±0.63 6.69±0.68 6.86±0.63 9.38±0.76 9.20±1.23 VV 19.15±0.61 18.95±0.62 11.47±0.70 11.71±0.61 13.92±0.60 13.81±0.98  下载: 导出CSV
-
[1] PAPATHANASSIOU K and KIM J S. Pol-InSAR calibration of ALOS-2: Analysis and results from the calval phase[C]. 2016 IEEE International Geoscience and Remote Sensing Symposium, Beijing, China, 2016: 3853–3854. doi: 10.1109/IGARSS.2016.7729999. [2] BORDONI F, YOUNIS M, RODRIGUEZ-CASSOLA M, et al. SAOCOM-CS SAR imaging performance evaluation in large baseline bistatic configuration[C]. 2015 IEEE International Geoscience and Remote Sensing Symposium, Milan, Italy, 2015: 2107–2110. doi: 10.1109/IGARSS.2015.7326218. [3] HUBER S, DE ALMEIDA F Q, VILLANO M, et al. Tandem-L: A technical perspective on future spaceborne sar sensors for earth observation[J]. IEEE Transactions on Geoscience and Remote Sensing, 2018, 56(8): 4792–4807. doi: 10.1109/TGRS.2018.2837673. [4] FRULLA L A, MILOVICH J A, KARSZENBAUM H, et al. Radiometric corrections and calibration of SAR images[C]. Sensing and Managing the Environment. 1998 IEEE International Geoscience and Remote Sensing, Seattle, USA, 1998: 1147–1149. doi: 10.1109/IGARSS.1998.699700. [5] SHIMADA M and FREEMAN A. A technique for measurement of spaceborne SAR antenna patterns using distributed targets[J]. IEEE Transactions on Geoscience and Remote Sensing, 1995, 33(1): 100–114. doi: 10.1109/36.368217. [6] SHI Lei, YANG Le, SUN Weidong, et al. Amplitude-optimized UZH for polarimetric channel imbalance calibration in PolSAR data[J]. IEEE Transactions on Geoscience and Remote Sensing, 2023, 61: 5217523. doi: 10.1109/TGRS.2023.3321046. [7] SHI Lei, LI Pingxiang, YANG Jie, et al. Polarimetric SAR calibration and residual error estimation when corner reflectors are unavailable[J]. IEEE Transactions on Geoscience and Remote Sensing, 2020, 58(6): 4454–4471. doi: 10.1109/TGRS.2020.2964732. [8] FREEMAN A. SAR calibration: An overview[J]. IEEE Transactions on Geoscience and Remote Sensing, 1992, 30(6): 1107–1121. doi: 10.1109/36.193786. [9] YANG Le, SHI Lei, YANG Jie, et al. PolSAR additive noise estimation based on shadow regions[J]. International Journal of Remote Sensing, 2021, 42(1): 259–273. doi: 10.1080/01431161.2020.1805135. [10] SHI Lei, YANG Le, ZHAO Lingli, et al. NESZ estimation and calibration for gaofen-3 polarimetric products by the minimum noise envelope estimator[J]. IEEE Transactions on Geoscience and Remote Sensing, 2021, 59(9): 7517–7534. doi: 10.1109/TGRS.2020.3033534. [11] YANG Junxin, HAN Bing, ZHONG Lihua, et al. First assessment of GF3-02 SAR ocean wind retrieval[J]. Remote Sensing, 2022, 14(8): 1880. doi: 10.3390/rs14081880. [12] ESPESETH M M, BREKKE C, JONES C E, et al. The impact of system noise in polarimetric SAR imagery on oil spill observations[J]. IEEE Transactions on Geoscience and Remote Sensing, 2020, 58(6): 4194–4214. doi: 10.1109/TGRS.2019.2961684. [13] ZHOU Xiao, ZENG Qiming, JIAO Jian, et al. Field calibration and validation of radarsat-2[C]. 2013 IEEE International Geoscience and Remote Sensing Symposium, Melbourne, Australia, 2013: 4451–4454. doi: 10.1109/IGARSS.2013.6723823. [14] SCHWERDT M, SCHMIDT K, KLENK P, et al. Radiometric performance of the TerraSAR-X mission over more than ten years of operation[J]. Remote Sensing, 2018, 10(5): 754. doi: 10.3390/rs10050754. [15] SCHWERDT M, SCHMIDT K, RAMON N T, et al. Independent verification of the sentinel-1A system calibration[J]. IEEE Journal of Selected Topics in Applied Earth Observations and Remote Sensing, 2016, 9(3): 994–1007. doi: 10.1109/JSTARS.2015.2449239. [16] EL HAJJ M, BAGHDADI N, ZRIBI M, et al. Analysis of sentinel-1 radiometric stability and quality for land surface applications[J]. Remote Sensing, 2016, 8(5): 406. doi: 10.3390/rs8050406. [17] FREEMAN A. Calibration of linearly polarized polarimetric SAR data subject to Faraday rotation[J]. IEEE Transactions on Geoscience and Remote Sensing, 2004, 42(8): 1617–1624. doi: 10.1109/TGRS.2004.830161. [18] TOUZI R and SHIMADA M. Polarimetric PALSAR calibration[J]. IEEE Transactions on Geoscience and Remote Sensing, 2009, 47(12): 3951–3959. doi: 10.1109/TGRS.2009.2032176. [19] SHIMADA M, ISOGUCHI O, TADONO T, et al. PALSAR radiometric and geometric calibration[J]. IEEE Transactions on Geoscience and Remote Sensing, 2009, 47(12): 3915–3932. doi: 10.1109/TGRS.2009.2023909. [20] SATAKE M, MATSUOKA T, UMEHARA T, et al. Polarimetric calibration experiment of ALOS PALSAR with polarization-selective dihedrals[C]. 2007 IEEE International Geoscience and Remote Sensing Symposium, Barcelona, Spain, 2007: 1596–1598. doi: 10.1109/IGARSS.2007.4423117. [21] TOUZI R, SHIMADA M, MOTOHKA T, et al. Assessment of PALSAR-2 compact non-circularity using amazonian rainforests[J]. IEEE Transactions on Geoscience and Remote Sensing, 2020, 58(10): 7472–7482. doi: 10.1109/TGRS.2020.2983008. [22] TAN Hong and HONG Jun. Calibration of compact polarimetric SAR images using distributed targets and one corner reflector[J]. IEEE Transactions on Geoscience and Remote Sensing, 2016, 54(8): 4433–4444. doi: 10.1109/TGRS.2016.2541666. [23] SHIMADA M. Model-based polarimetric SAR calibration method using forest and surface-scattering targets[J]. IEEE Transactions on Geoscience and Remote Sensing, 2011, 49(5): 1712–1733. doi: 10.1109/TGRS.2010.2090046. [24] LI T, TANG X, GAO X, et al. Lu TAN-1 SAR satellite characteristics and productions in the phase of in-orbit test[J]. The International Archives of the Photogrammetry , Remote Sensing and Spatial Information Sciences, 2023, XLVIII-1/W2-2023: 1251–1256. doi: 10.5194/isprs-archives-XLVIII-1-W2-2023-1251-2023. [25] LIU Kaiyu, WANG R, ZHANG Heng, et al. LuTan-1: An innovative L-band spaceborne SAR mission[C]. 14th European Conference on Synthetic Aperture Radar, Leipzig, Germany, 2022: 1–5. [26] LI Tao, TANG Xinming, ZHOU Xiaoqing, et al. LuTan-1 SAR main applications and products[C]. 14th European Conference on Synthetic Aperture Radar, Leipzig, Germany, 2022: 1–4. [27] JIANG Sha, QIU Xiaolan, HAN Bing, et al. Error source analysis and correction of GF-3 polarimetric data[J]. Remote Sensing, 2018, 10(11): 1685. doi: 10.3390/rs10111685. [28] WRIGHT P A, QUEGAN S, WHEADON N S, et al. Faraday rotation effects on L-band spaceborne SAR data[J]. IEEE Transactions on Geoscience and Remote Sensing, 2003, 41(12): 2735–2744. doi: 10.1109/TGRS.2003.815399. [29] MEYER F J and NICOLL J B. Prediction, detection, and correction of faraday rotation in full-polarimetric L-band SAR data[J]. IEEE Transactions on Geoscience and Remote Sensing, 2008, 46(10): 3076–3086. doi: 10.1109/TGRS.2008.2003002. [30] ROGERS N C and QUEGAN S. The accuracy of faraday rotation estimation in satellite synthetic aperture radar images[J]. IEEE Transactions on Geoscience and Remote Sensing, 2014, 52(8): 4799–4807. doi: 10.1109/TGRS.2013.2284635. [31] WOODHOUSE I H. Introduction to Microwave Remote Sensing[M]. Boca Raton: CRC Press, 2017. [32] LUKOWSKI T I, HAWKINS R K, CLOUTIER C, et al. RADARSAT elevation antenna pattern determination[C]. 1997 IEEE International Geoscience and Remote Sensing Symposium Proceedings. Remote Sensing - A Scientific Vision for Sustainable Development, Singapore, 1997: 1382–1384. doi: 10.1109/IGARSS.1997.606453. [33] 史磊, 杨杰, 李平湘, 等. 不依赖人工定标器的全极化SAR定标研究进展[J]. 遥感学报, 2021, 25(11): 2211–2219. doi: 10.11834/jrs.20219310.SHI Lei, YANG Jie, LI Pingxiang, et al. Research process of full-polarimetric SAR calibration without using corner reflectors[J]. National Remote Sensing Bulletin, 2021, 25(11): 2211–2219. doi: 10.11834/jrs.20219310. [34] QUEGAN S. A unified algorithm for phase and cross-talk calibration of polarimetric data-theory and observations[J]. IEEE Transactions on Geoscience and Remote Sensing, 1994, 32(1): 89–99. doi: 10.1109/36.285192. [35] VAN ZYL J J. Calibration of polarimetric radar images using only image parameters and trihedral corner reflector responses[J]. IEEE Transactions on Geoscience and Remote Sensing, 1990, 28(3): 337–348. doi: 10.1109/36.54360. [36] AINSWORTH T L, FERRO-FAMIL L, and LEE J S. Orientation angle preserving a posteriori polarimetric SAR calibration[J]. IEEE Transactions on Geoscience and Remote Sensing, 2006, 44(4): 994–1003. doi: 10.1109/TGRS.2005.862508. [37] SHI Lei, LI Pingxiang, YANG Jie, et al. Polarimetric calibration for the distributed Gaofen-3 product by an improved unitary zero helix framework[J]. ISPRS Journal of Photogrammetry and Remote Sensing, 2020, 160: 229–243. doi: 10.1016/j.isprsjprs.2019.12.003. [38] SUN Guangde, LI Zhen, HUANG Lei, et al. Quality analysis and improvement of polarimetric synthetic aperture radar (SAR) images from the GaoFen-3 satellite using the Amazon rainforest as an example[J]. International Journal of Remote Sensing, 2021, 42(6): 2131–2154. doi: 10.1080/01431161.2020.1851798. [39] JIANG Sha, QIU Xiaolan, HAN Bing, et al. A quality assessment method based on common distributed targets for GF-3 polarimetric SAR data[J]. Sensors, 2018, 18(3): 807. doi: 10.3390/s18030807. [40] BUESO-BELLO J L, MARTONE M, PRATS-IRAOLA P, et al. First characterization and performance evaluation of bistatic TanDEM-X experimental products[J]. IEEE Journal of Selected Topics in Applied Earth Observations and Remote Sensing, 2016, 9(3): 1058–1071. doi: 10.1109/JSTARS.2015.2430454. [41] BUESO-BELLO J L, MARTONE M, PRATS-IRAOLA P, et al. Performance analysis of TanDEM-X quad-polarization products in pursuit monostatic mode[J]. IEEE Journal of Selected Topics in Applied Earth Observations and Remote Sensing, 2017, 10(5): 1853–1869. doi: 10.1109/JSTARS.2017.2663323. [42] MOUCHE A and CHAPRON B. Global C-band envisat, RADARSAT-2 and sentinel-1 SAR measurements in copolarization and cross-polarization[J]. Journal of Geophysical Research: Oceans, 2015, 120(11): 7195–7207. doi: 10.1002/2015JC011149. [43] REN Lin, YANG Jingsong, MOUCHE A, et al. Preliminary analysis of Chinese GF-3 SAR Quad-polarization measurements to extract winds in each polarization[J]. Remote Sensing, 2017, 9(12): 1215. doi: 10.3390/rs9121215. [44] VILLANO M. SNR and noise variance estimation in polarimetric SAR data[J]. IEEE Geoscience and Remote Sensing Letters, 2014, 11(1): 278–282. doi: 10.1109/LGRS.2013.2255860. [45] HAJNSEK I, POTTIER E, and CLOUDE S R. Inversion of surface parameters from polarimetric SAR[J]. IEEE Transactions on Geoscience and Remote Sensing, 2003, 41(4): 727–744. doi: 10.1109/TGRS.2003.810702. [46] FREEMAN A and SAATCHI S S. On the detection of Faraday rotation in linearly polarized L-band SAR backscatter signatures[J]. IEEE Transactions on Geoscience and Remote Sensing, 2004, 42(8): 1607–1616. doi: 10.1109/TGRS.2004.830163. [47] QI Renyuan and JIN Yaqiu. Analysis of the effects of faraday rotation on spaceborne polarimetric SAR observations at P-band[J]. IEEE Transactions on Geoscience and Remote Sensing, 2007, 45(5): 1115–1122. doi: 10.1109/TGRS.2007.892583. -


计量
- 文章访问数:
- HTML全文浏览量:
- PDF下载量:
- 被引次数: 0

