
 作者中心
作者中心 专家审稿
专家审稿 责编办公
责编办公 编辑办公
编辑办公
Explainability of Deep Networks for SAR Target Recognition via Class Activation Mapping
-
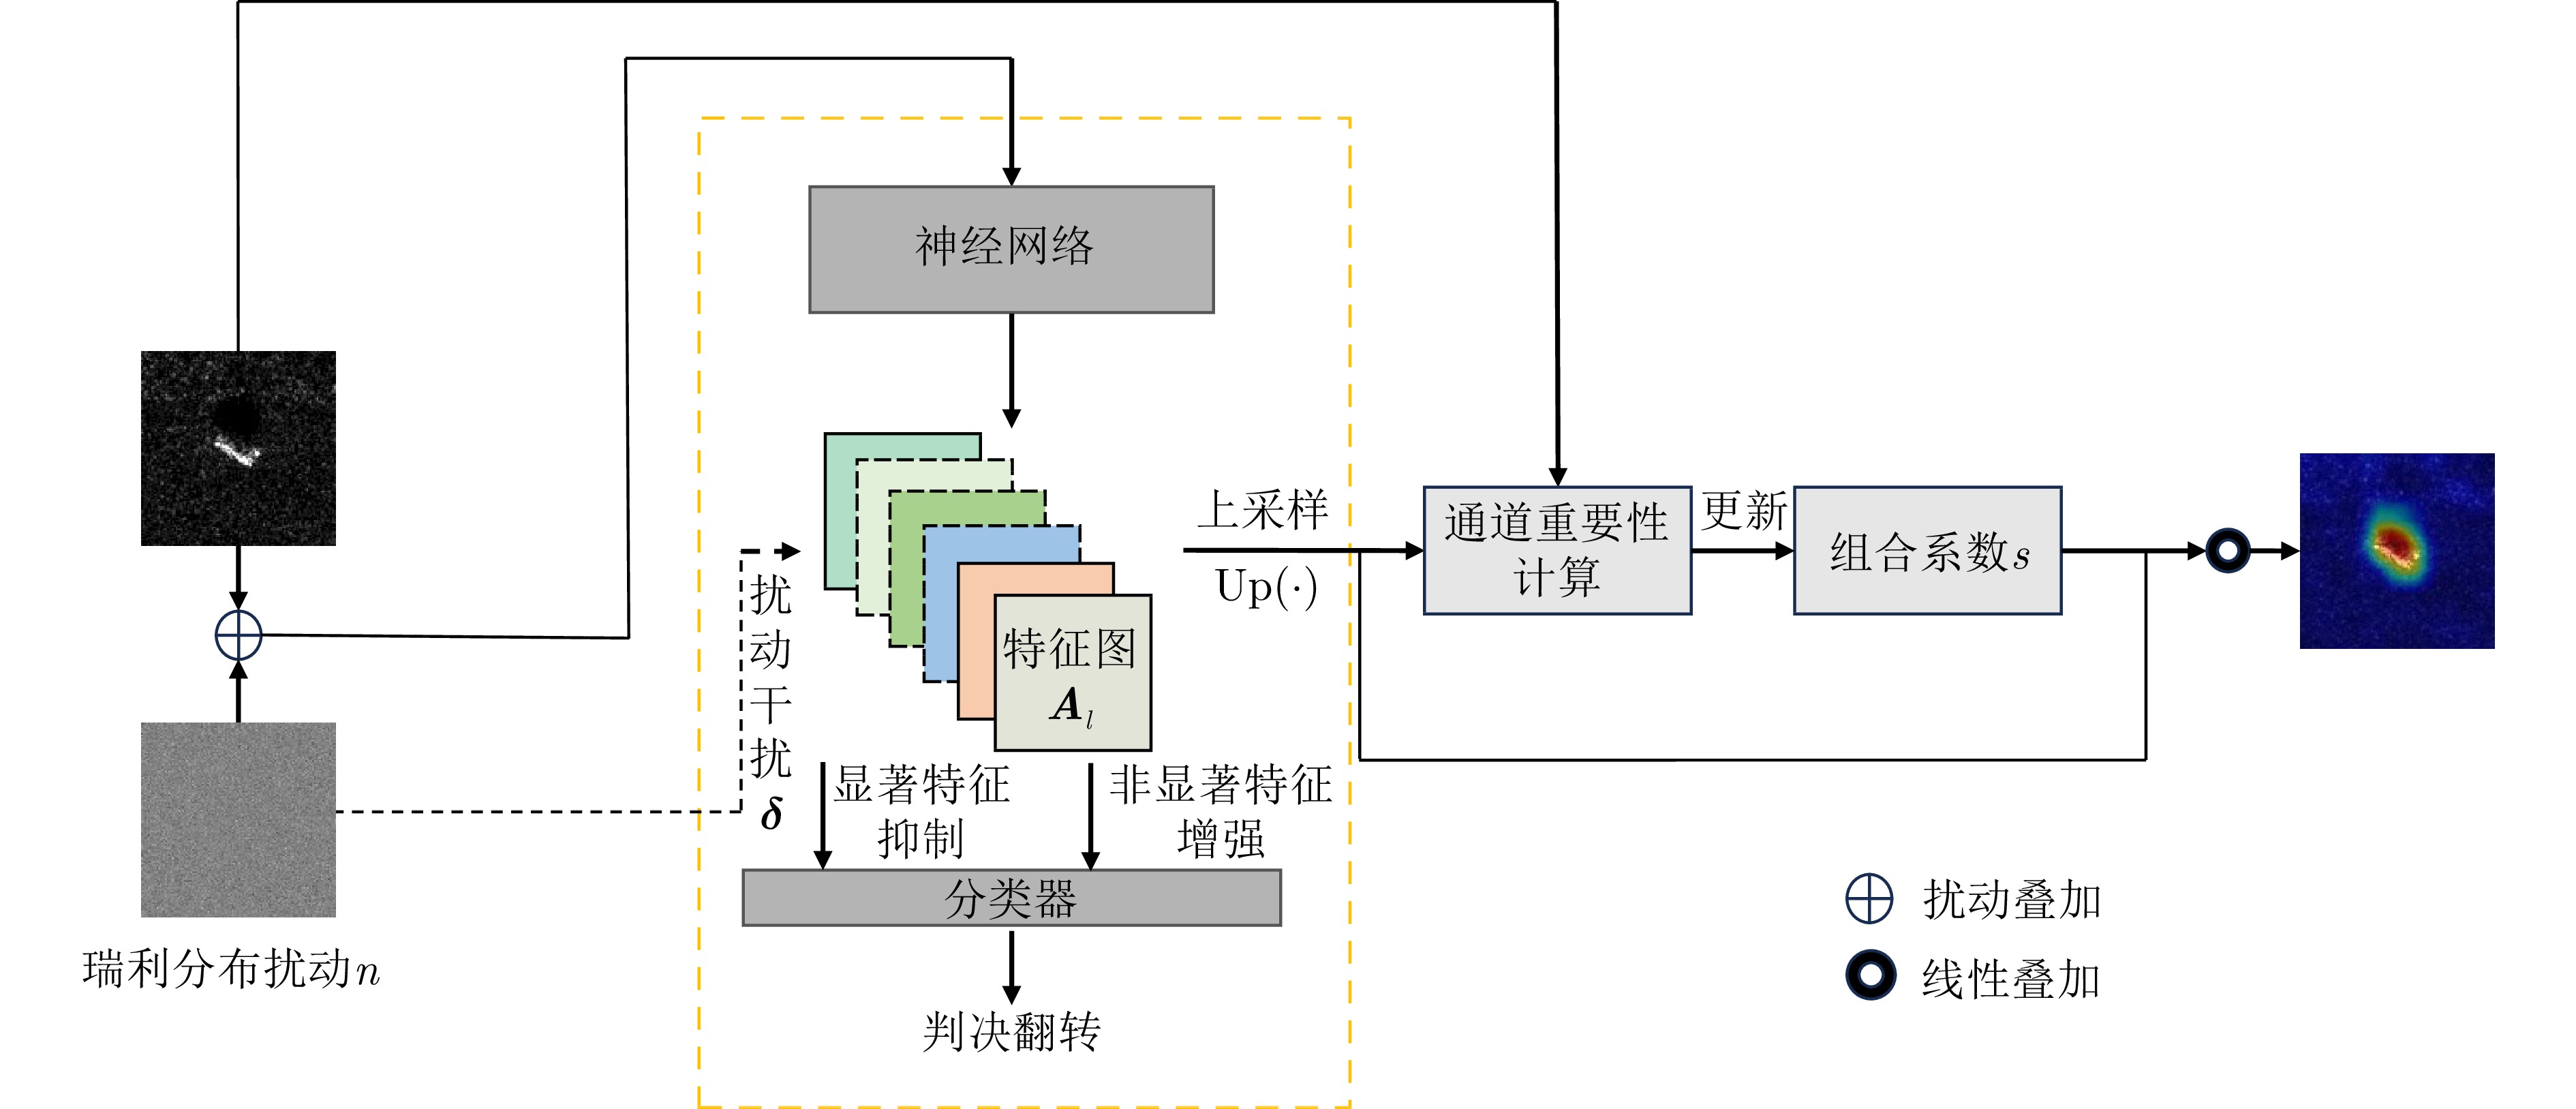
摘要: 随着深度学习方法在合成孔径雷达(SAR)图像解译领域的广泛应用,SAR目标识别深度网络可理解性问题逐渐受到学者的关注。类激活映射(CAM)作为常用的可理解性算法,能够通过热力图的方式,直观展示对识别任务起作用的显著性区域。然而作为一种事后解释的方法,其只能静态展示当次识别过程中的显著性区域,无法动态展示当输入发生变化时显著性区域的变化规律。该文将扰动的思想引入类激活映射,提出了一种基于SAR背景杂波特性类激活映射方法(SCC-CAM),通过对输入图像引入同分布的全局扰动,逐步向SAR识别深度网络施加干扰,使得网络判决发生翻转,并在此刻计算网络神经元输出激活值的变化程度。该方法既能解决添加扰动可能带来的扰动传染问题,又能够动态观察和度量目标识别网络在识别过程中显著性区域的变化规律,从而增强深度网络的可理解性。在MSTAR数据集和OpenSARShip-1.0数据集上的试验表明,该文提出的算法具有更加精确的定位显著性区域的能力,相比于传统方法,在平均置信度下降率、置信度上升比例、信息量等评估指标上,所提算法具有更强的可理解性,能够作为通用的增强网络可理解性的方法。
-
关键词:
- SAR目标识别 /
- 网络可理解性 /
- SAR杂波特性 /
- 类激活映射 /
- 面积约束置信度下降率
Abstract: With the widespread application of deep learning methods in Synthetic Aperture Radar (SAR) image interpretation, the explainability of SAR target recognition deep networks has gradually attracted the attention of scholars. Class Activation Mapping (CAM), a commonly used explainability algorithm, can visually display the salient regions influencing the recognition task through heatmaps. However, as a post hoc explanation method, CAM can only statically display the salient regions during the current recognition process and cannot dynamically show the variation patterns of the salient regions upon changing the input. This study introduces the concept of perturbation into CAM, proposing an algorithm called SAR Clutter Characteristics CAM (SCC-CAM). By introducing globally distributed perturbations to the input image, interference is gradually applied to deep SAR recognition networks, causing decision flips. The degree of change in the activation values of network neurons is also calculated. This method addresses the issue of perturbation propagation and allows for dynamic observation and measurement of variation patterns of salient regions during the recognition process. Thus, SCC-CAM enhances the explainability of deep networks. Experiments on the MSTAR and OpenSARShip-1.0 datasets demonstrate that the proposed algorithm can more accurately locate salient regions. Compared with traditional methods, the algorithm in this study shows stronger explainability in terms of average confidence degradation rates, confidence ascent ratios, information content, and other evaluation metrics. This algorithm can serve as a universal method for enhancing the explainability of networks. -

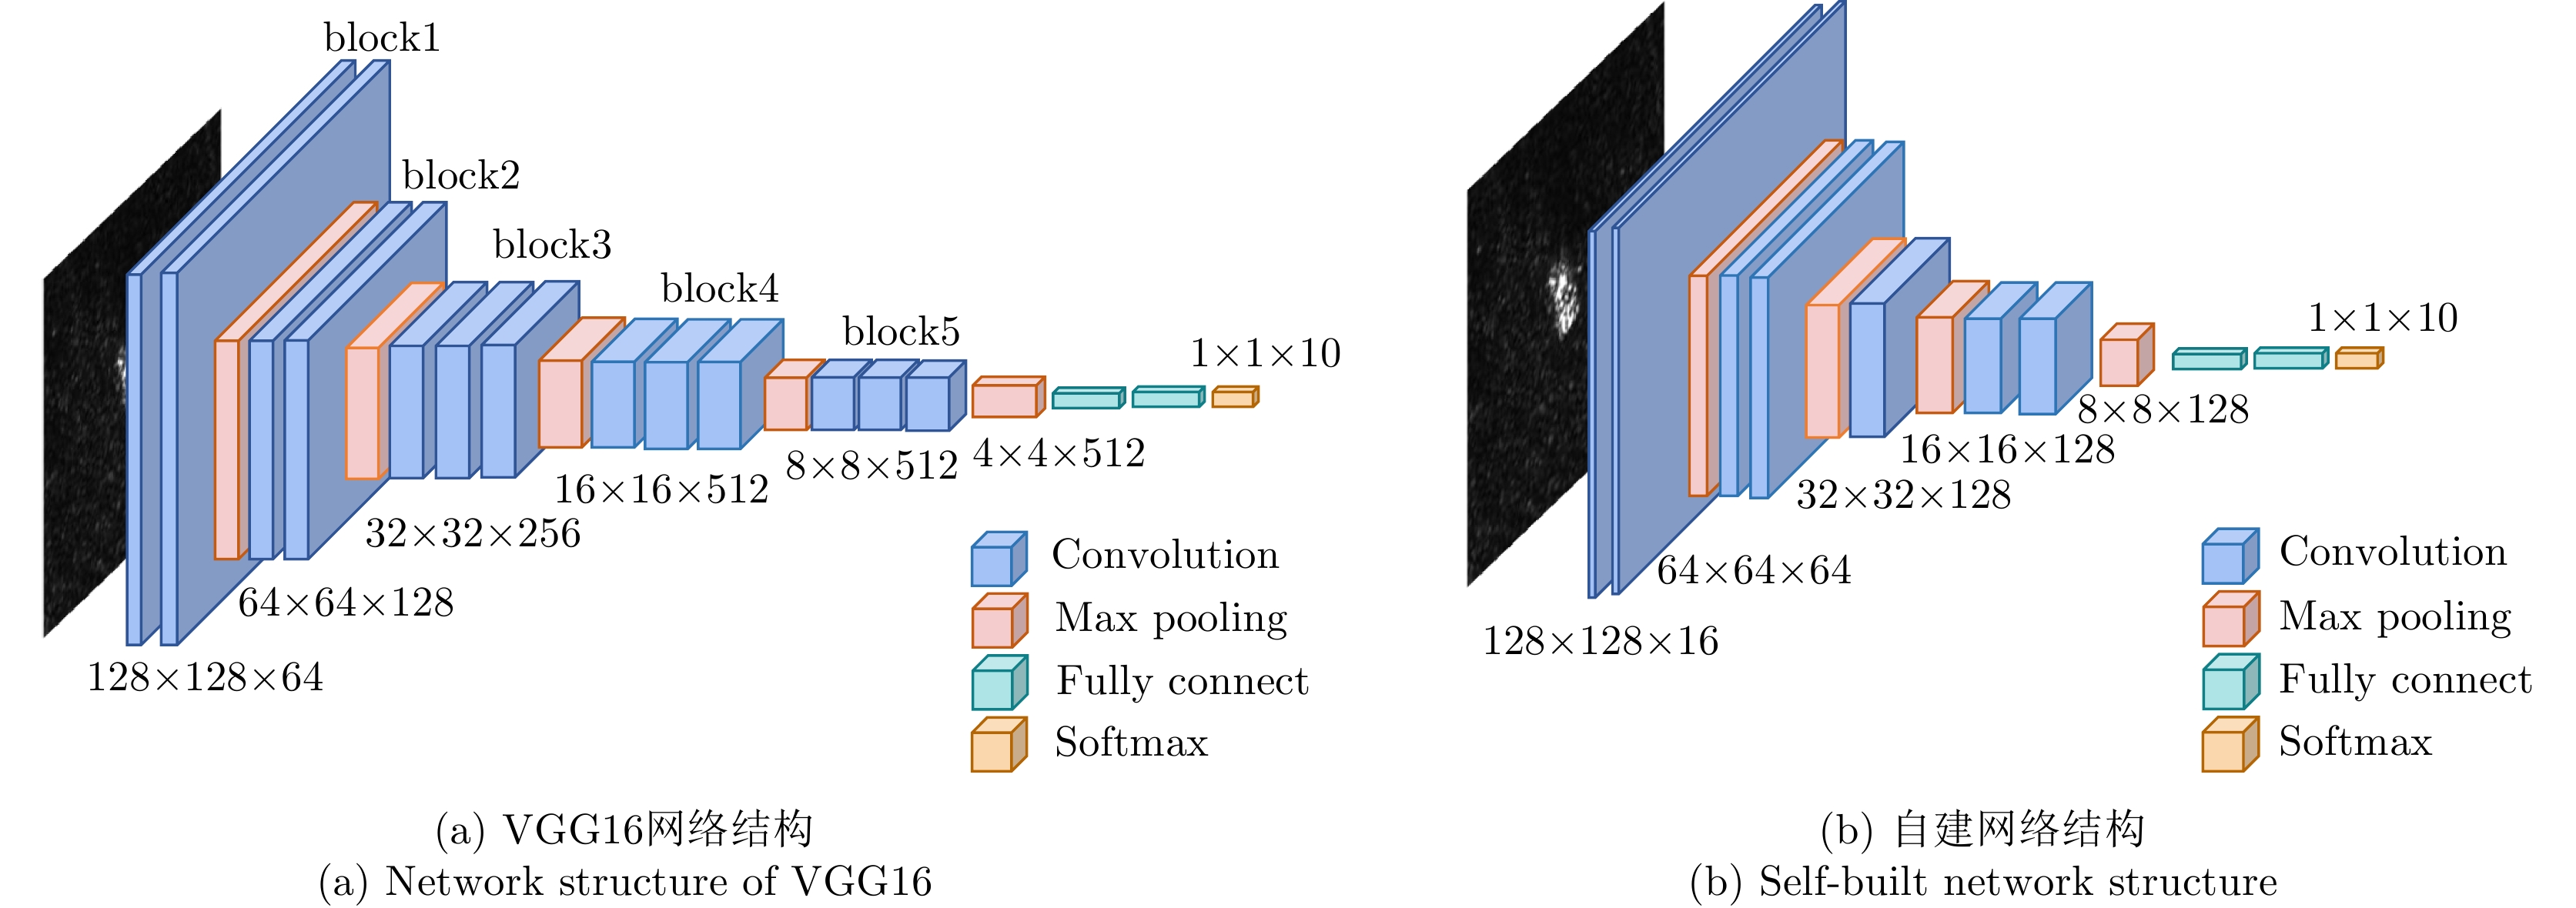
图 1 基于SAR背景杂波特性的类激活映射算法整体流程图
Figure 1. The flowchart of class activation mapping algorithm based on SAR background clutter characteristics
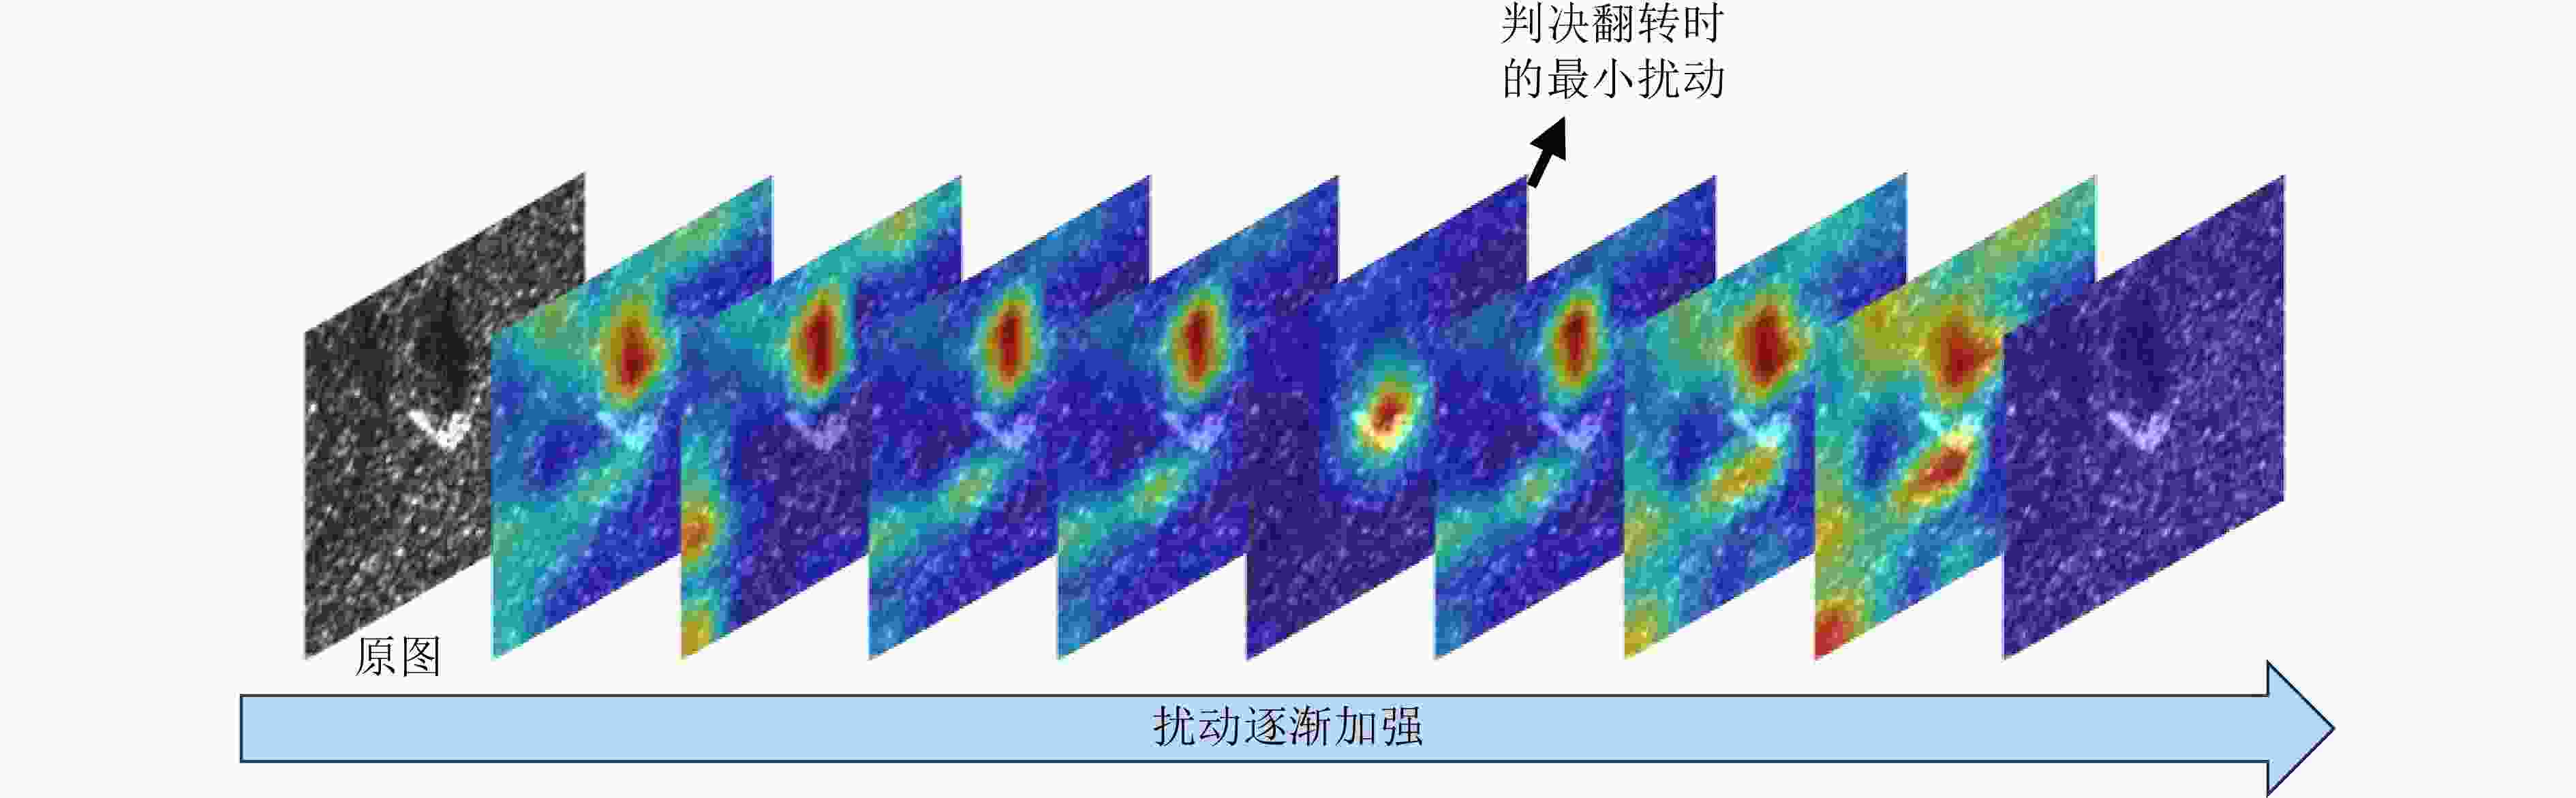
图 2 随着扰动强度增加,在VGG16网络的最后一个MaxPooling层上使用SCC-CAM展示显著性区域的变化
Figure 2. As the perturbation intensity increases, variations in the saliency regions displayed using SCC-CAM on the last MaxPooling layer of the VGG16 network
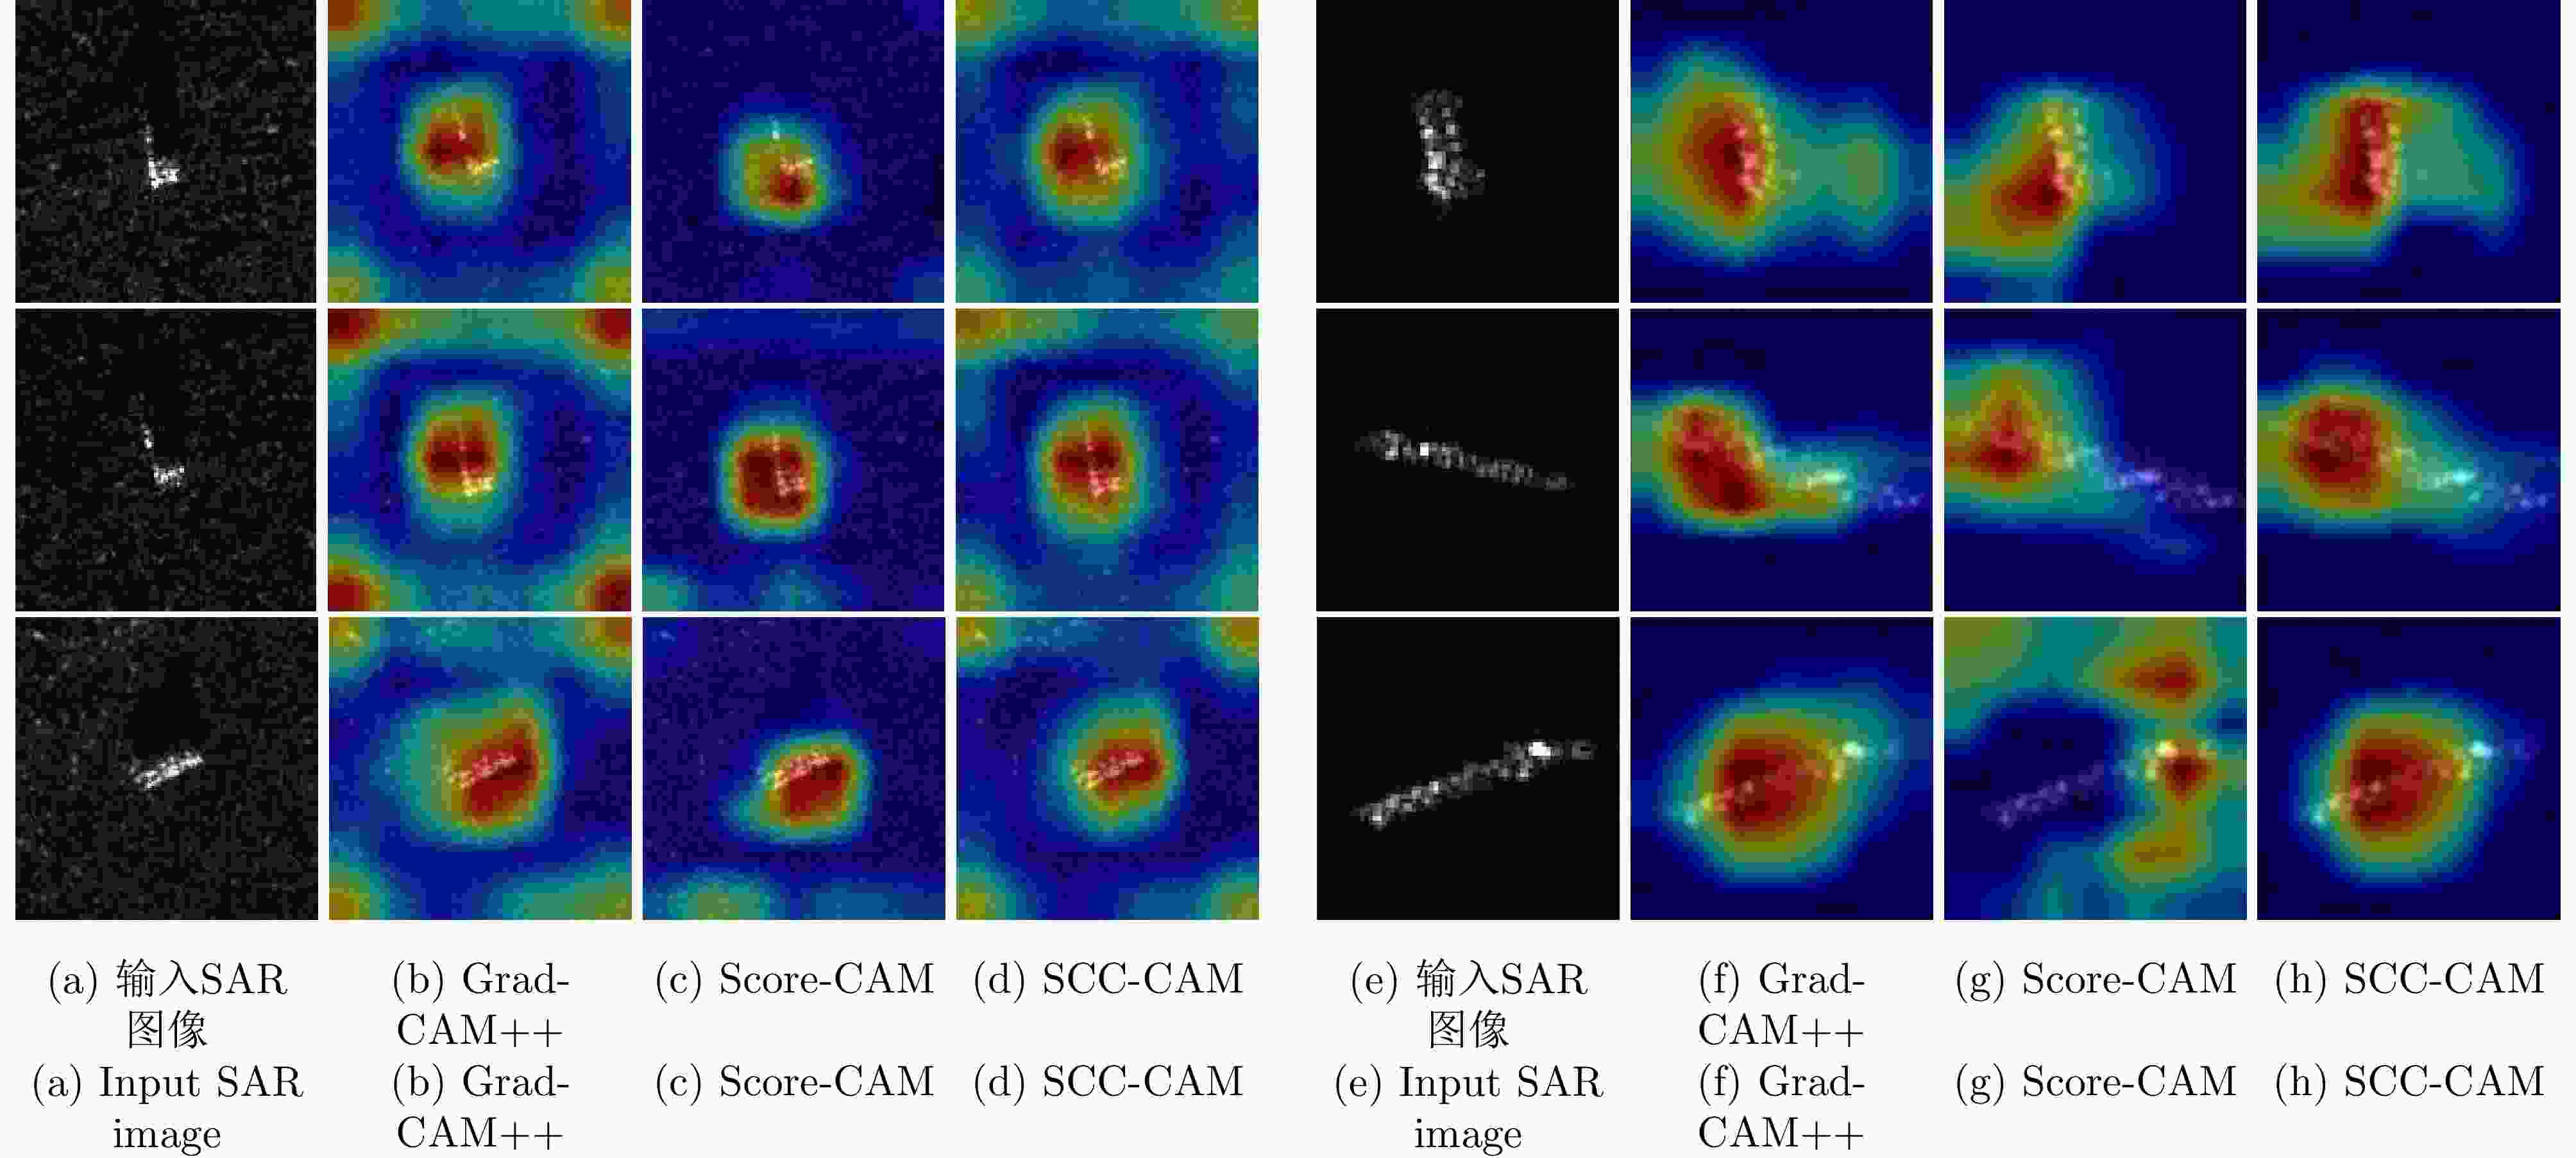
图 4 VGG16网络显著性区域对比(左侧为MSTAR,右侧为OpenSARShip-1.0)
Figure 4. Comparison of saliency area of VGG16 (the left is MSTAR, the right is OpenSARShip-1.0)
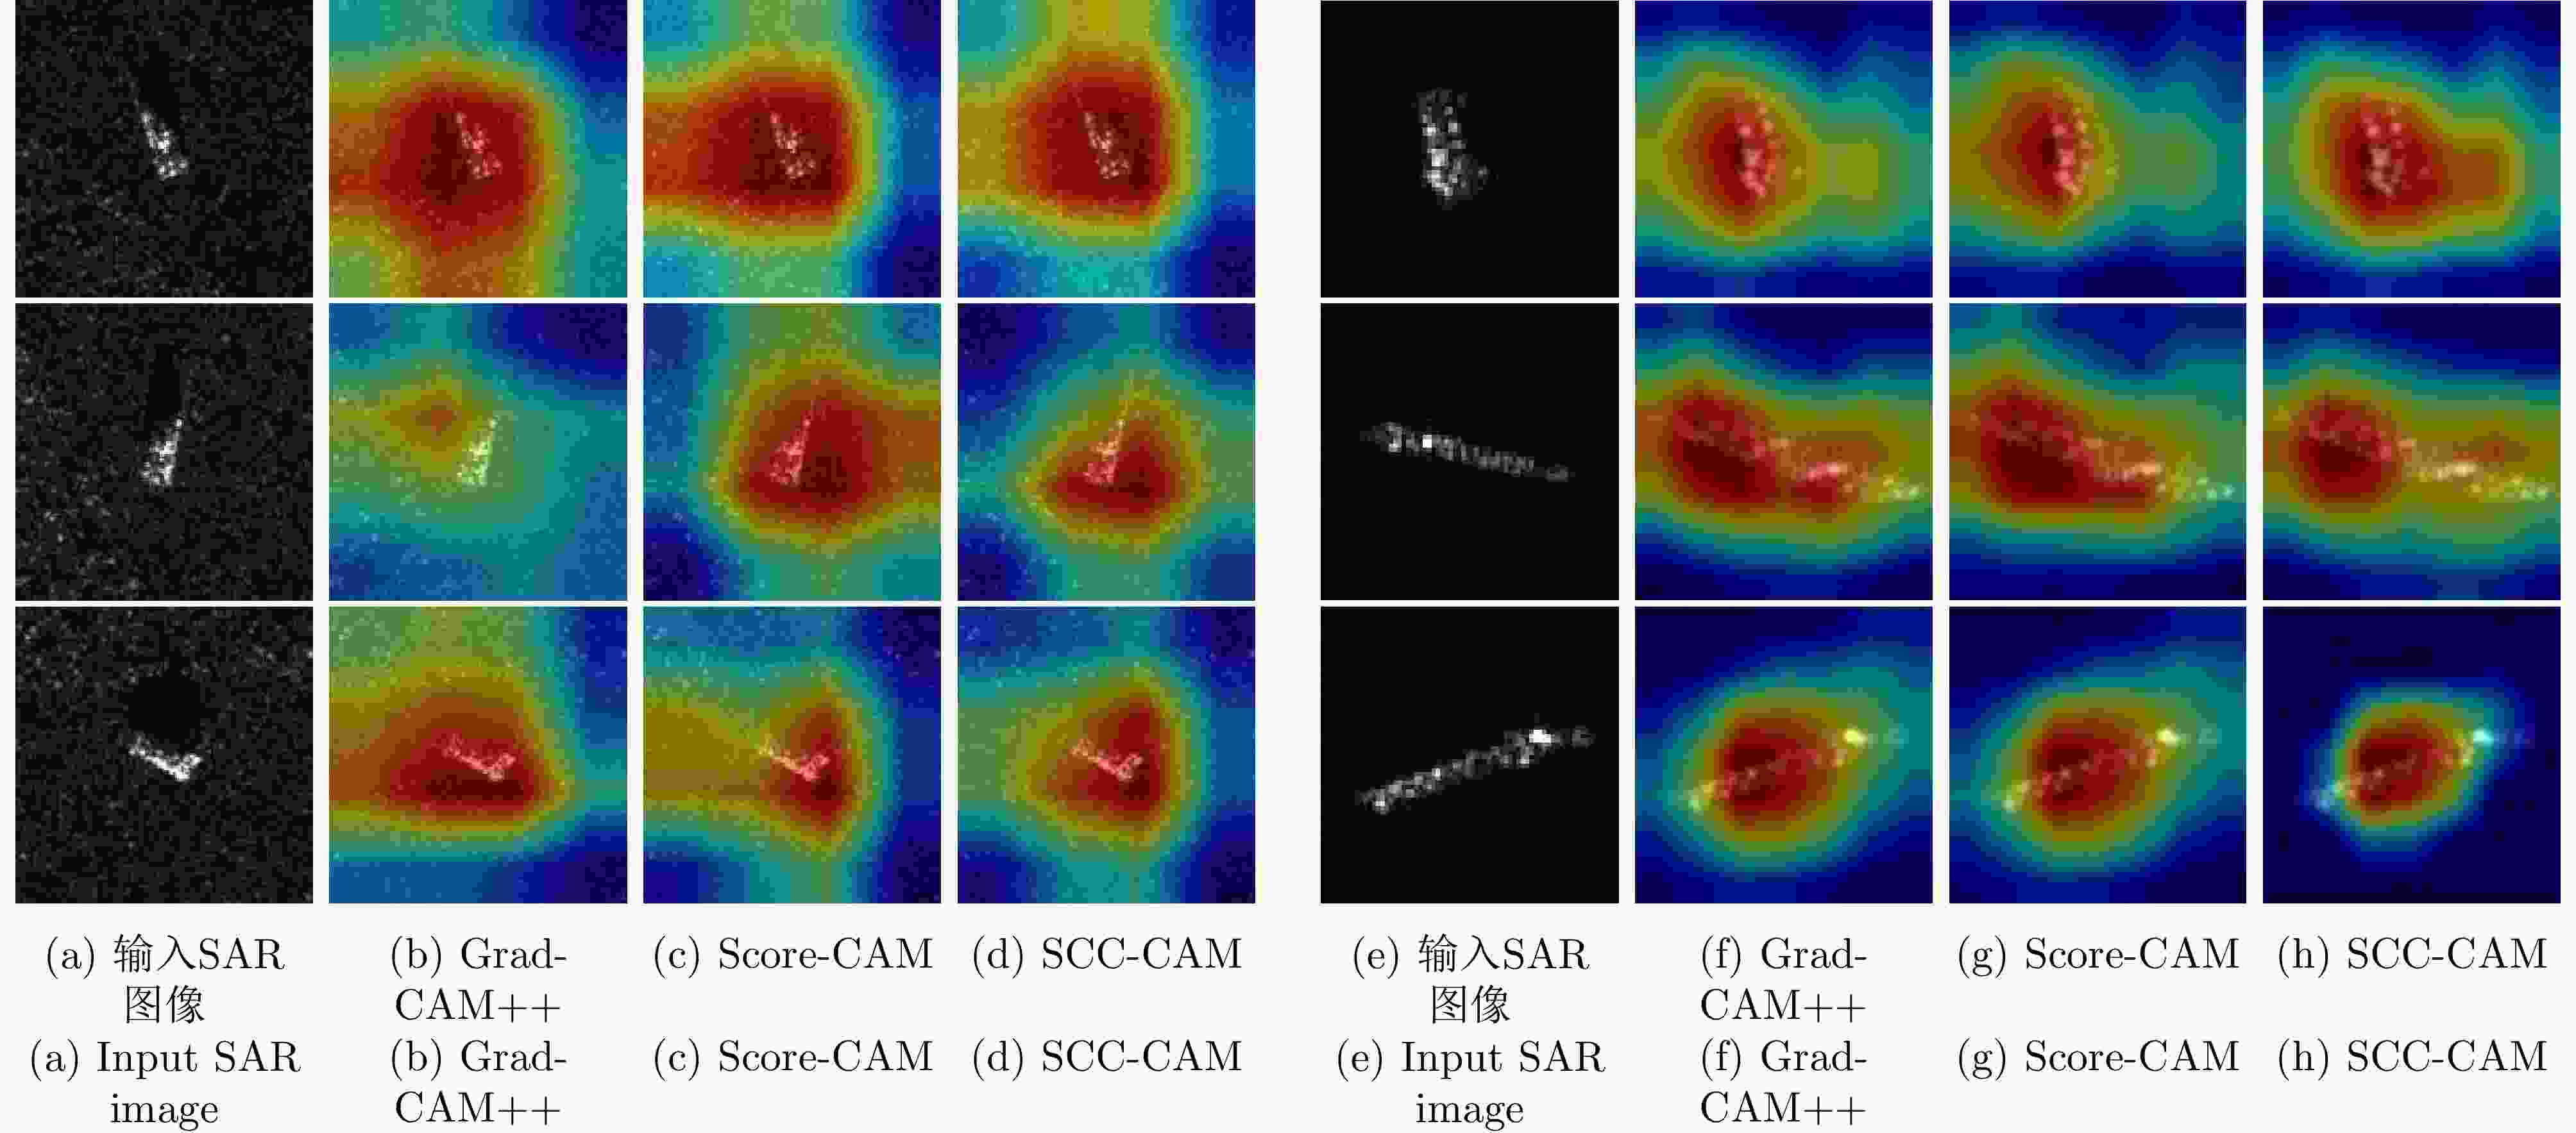
图 5 ResNet网络显著性区域对比(左侧为MSTAR,右侧为OpenSARShip-1.0)
Figure 5. Comparison of saliency area of ResNet (the left is MSTAR, the right is OpenSARShip-1.0)
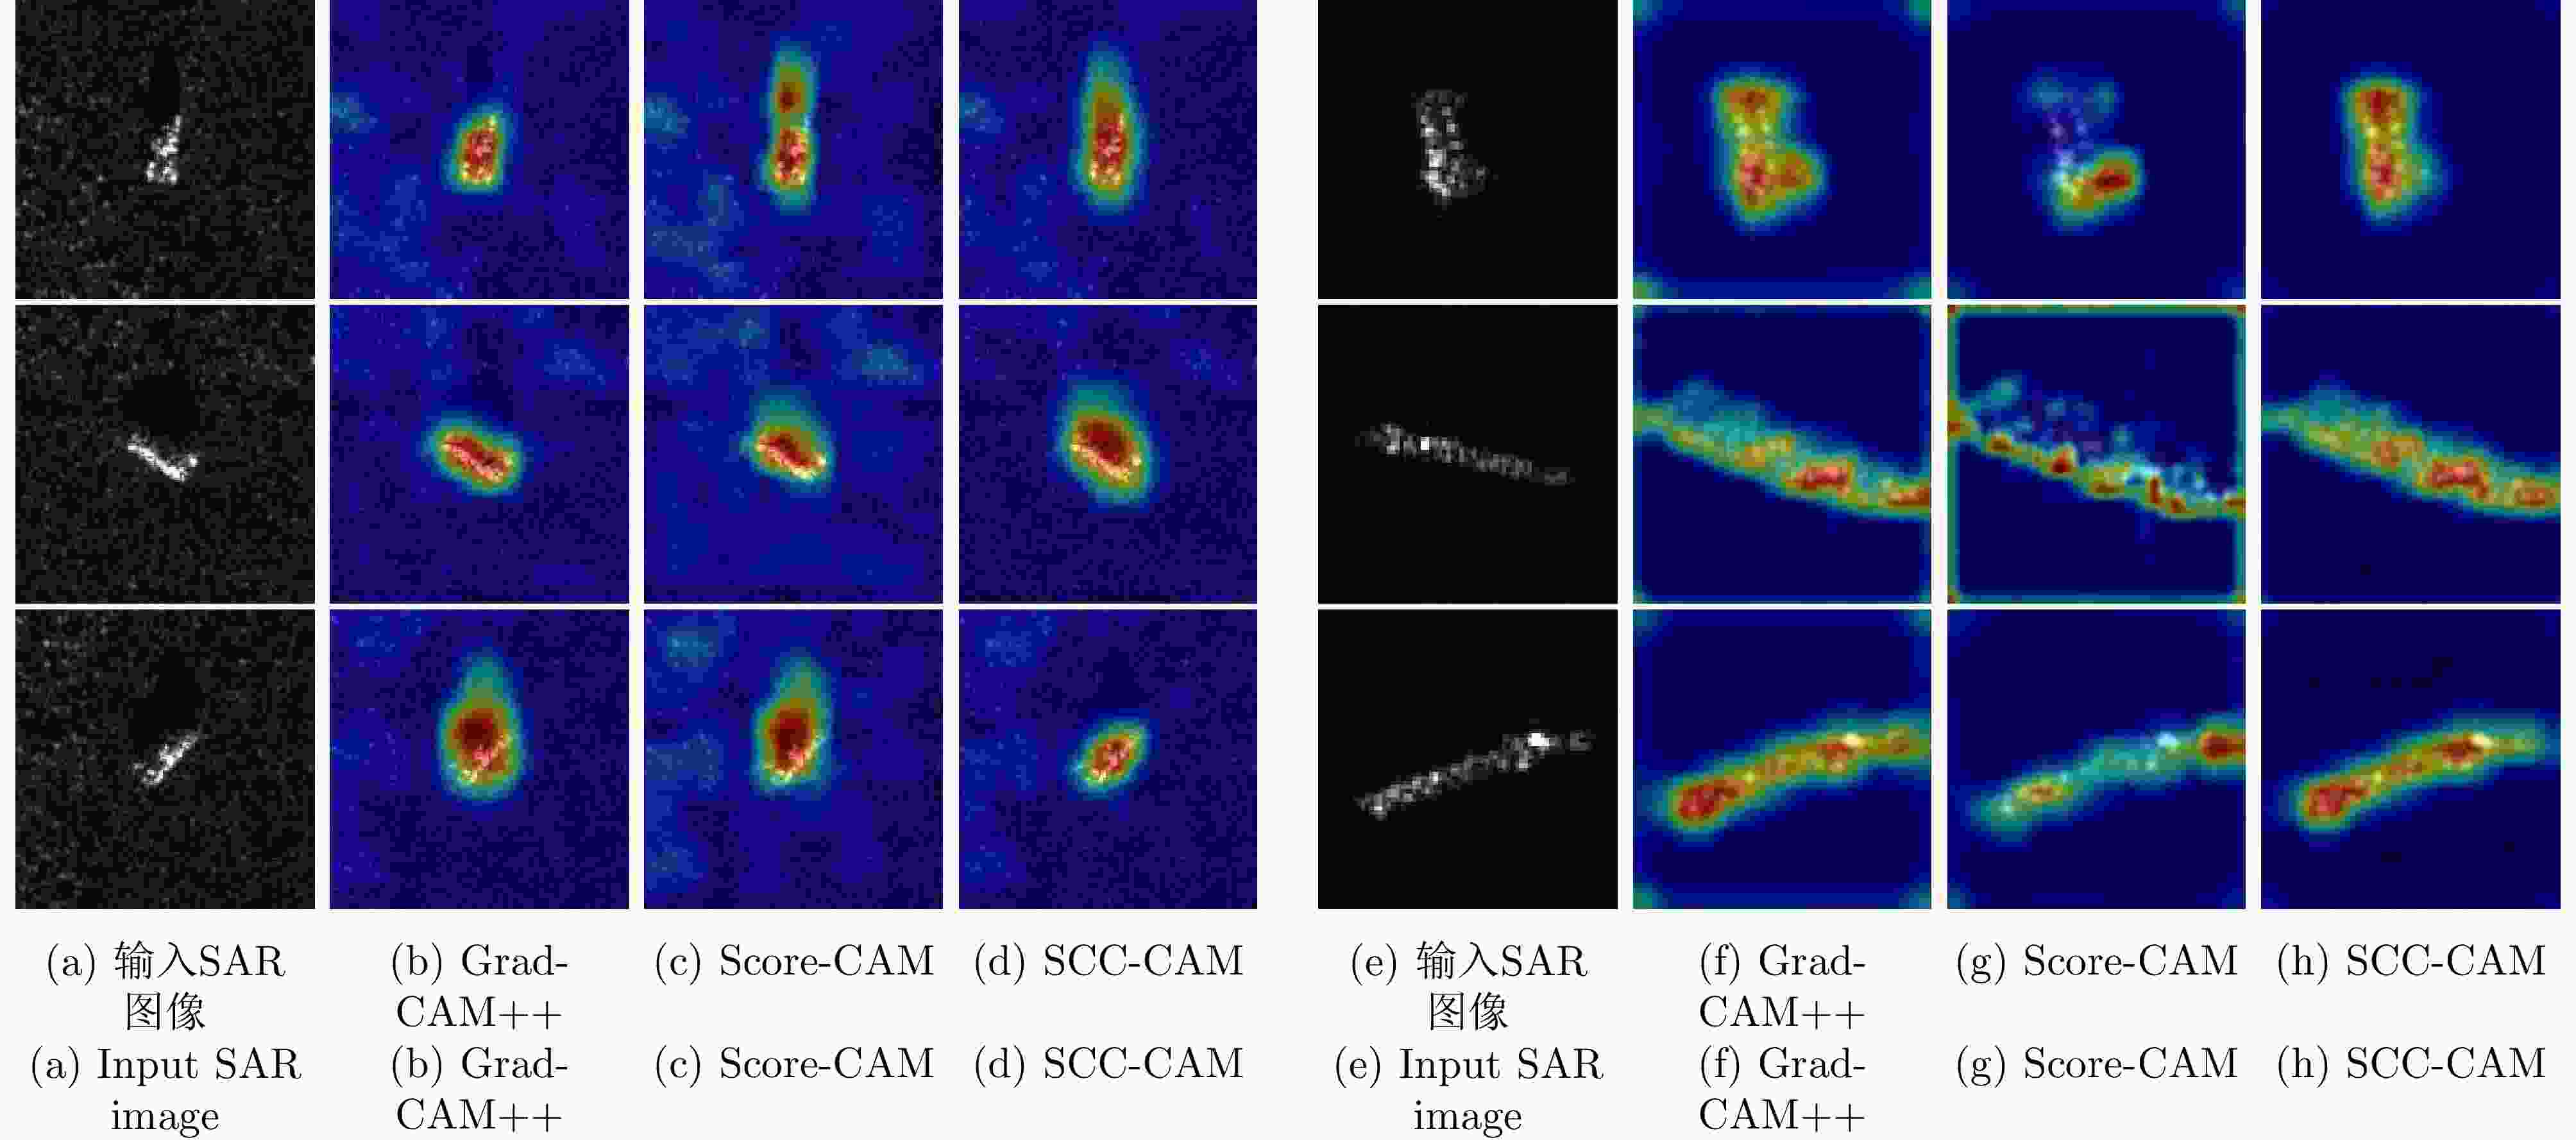
图 6 自建网络显著性区域对比(左侧为MSTAR,右侧为OpenSARShip-1.0)
Figure 6. Comparison of saliency area of self-built network (the left is MSTAR, the right is OpenSARShip-1.0)
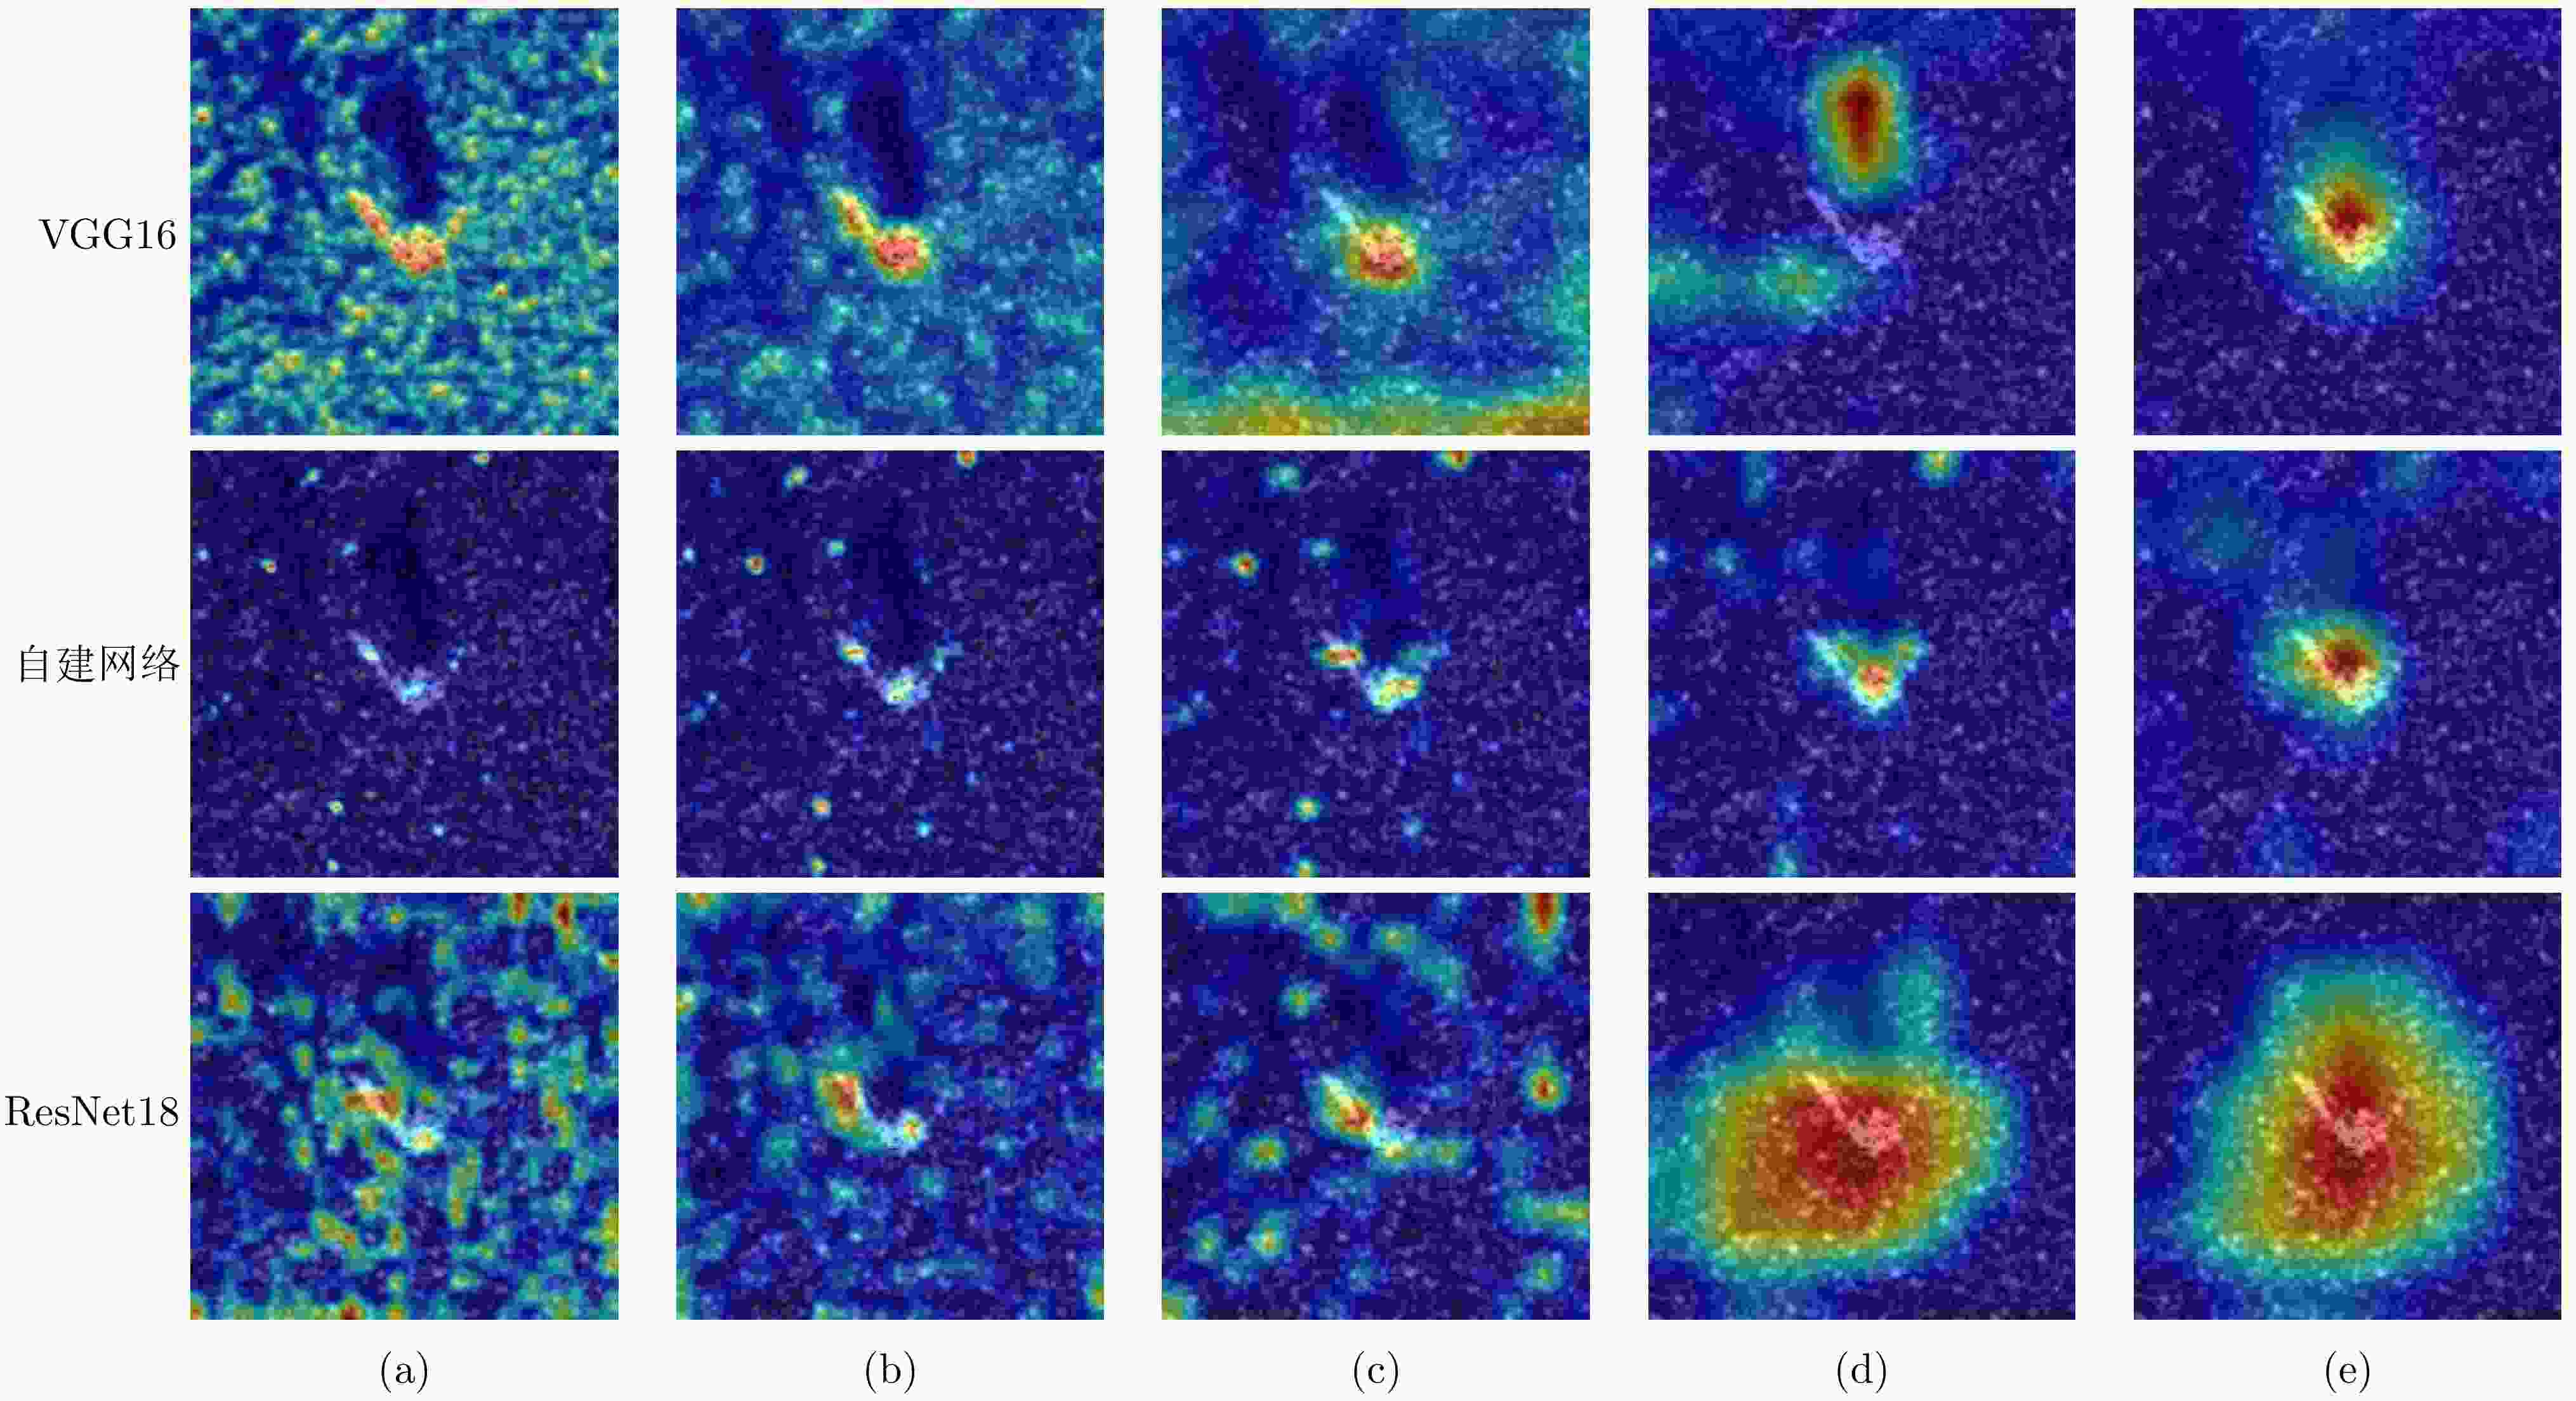
图 7 VGG16, ResNet18和自建网络发生判决翻转时采用SCC-CAM提取的不同层显著性区域(第1行和第2行的(a)~(e)分别对应VGG16和自建网络的第1到第5个最大池化层;第3行的(a)~(e)对应ResNet18的layer1到layer3的第4个卷积层以及layer4的第2和第4个卷积层)
Figure 7. When decision flipping occurs for VGG16, ResNet18, and the self-built network, different salient regions are extracted using SCC-CAM from various layers (for the first and second rows, (a)~(e) correspond to the first through fifth max-pooling layers ofVGG16 and the self-built network. In the third row, (a)~(e) correspond to the fourth convolutional layer of ResNet18’slayer1 to layer3, and the second and fourth convolutional layers of layer4)

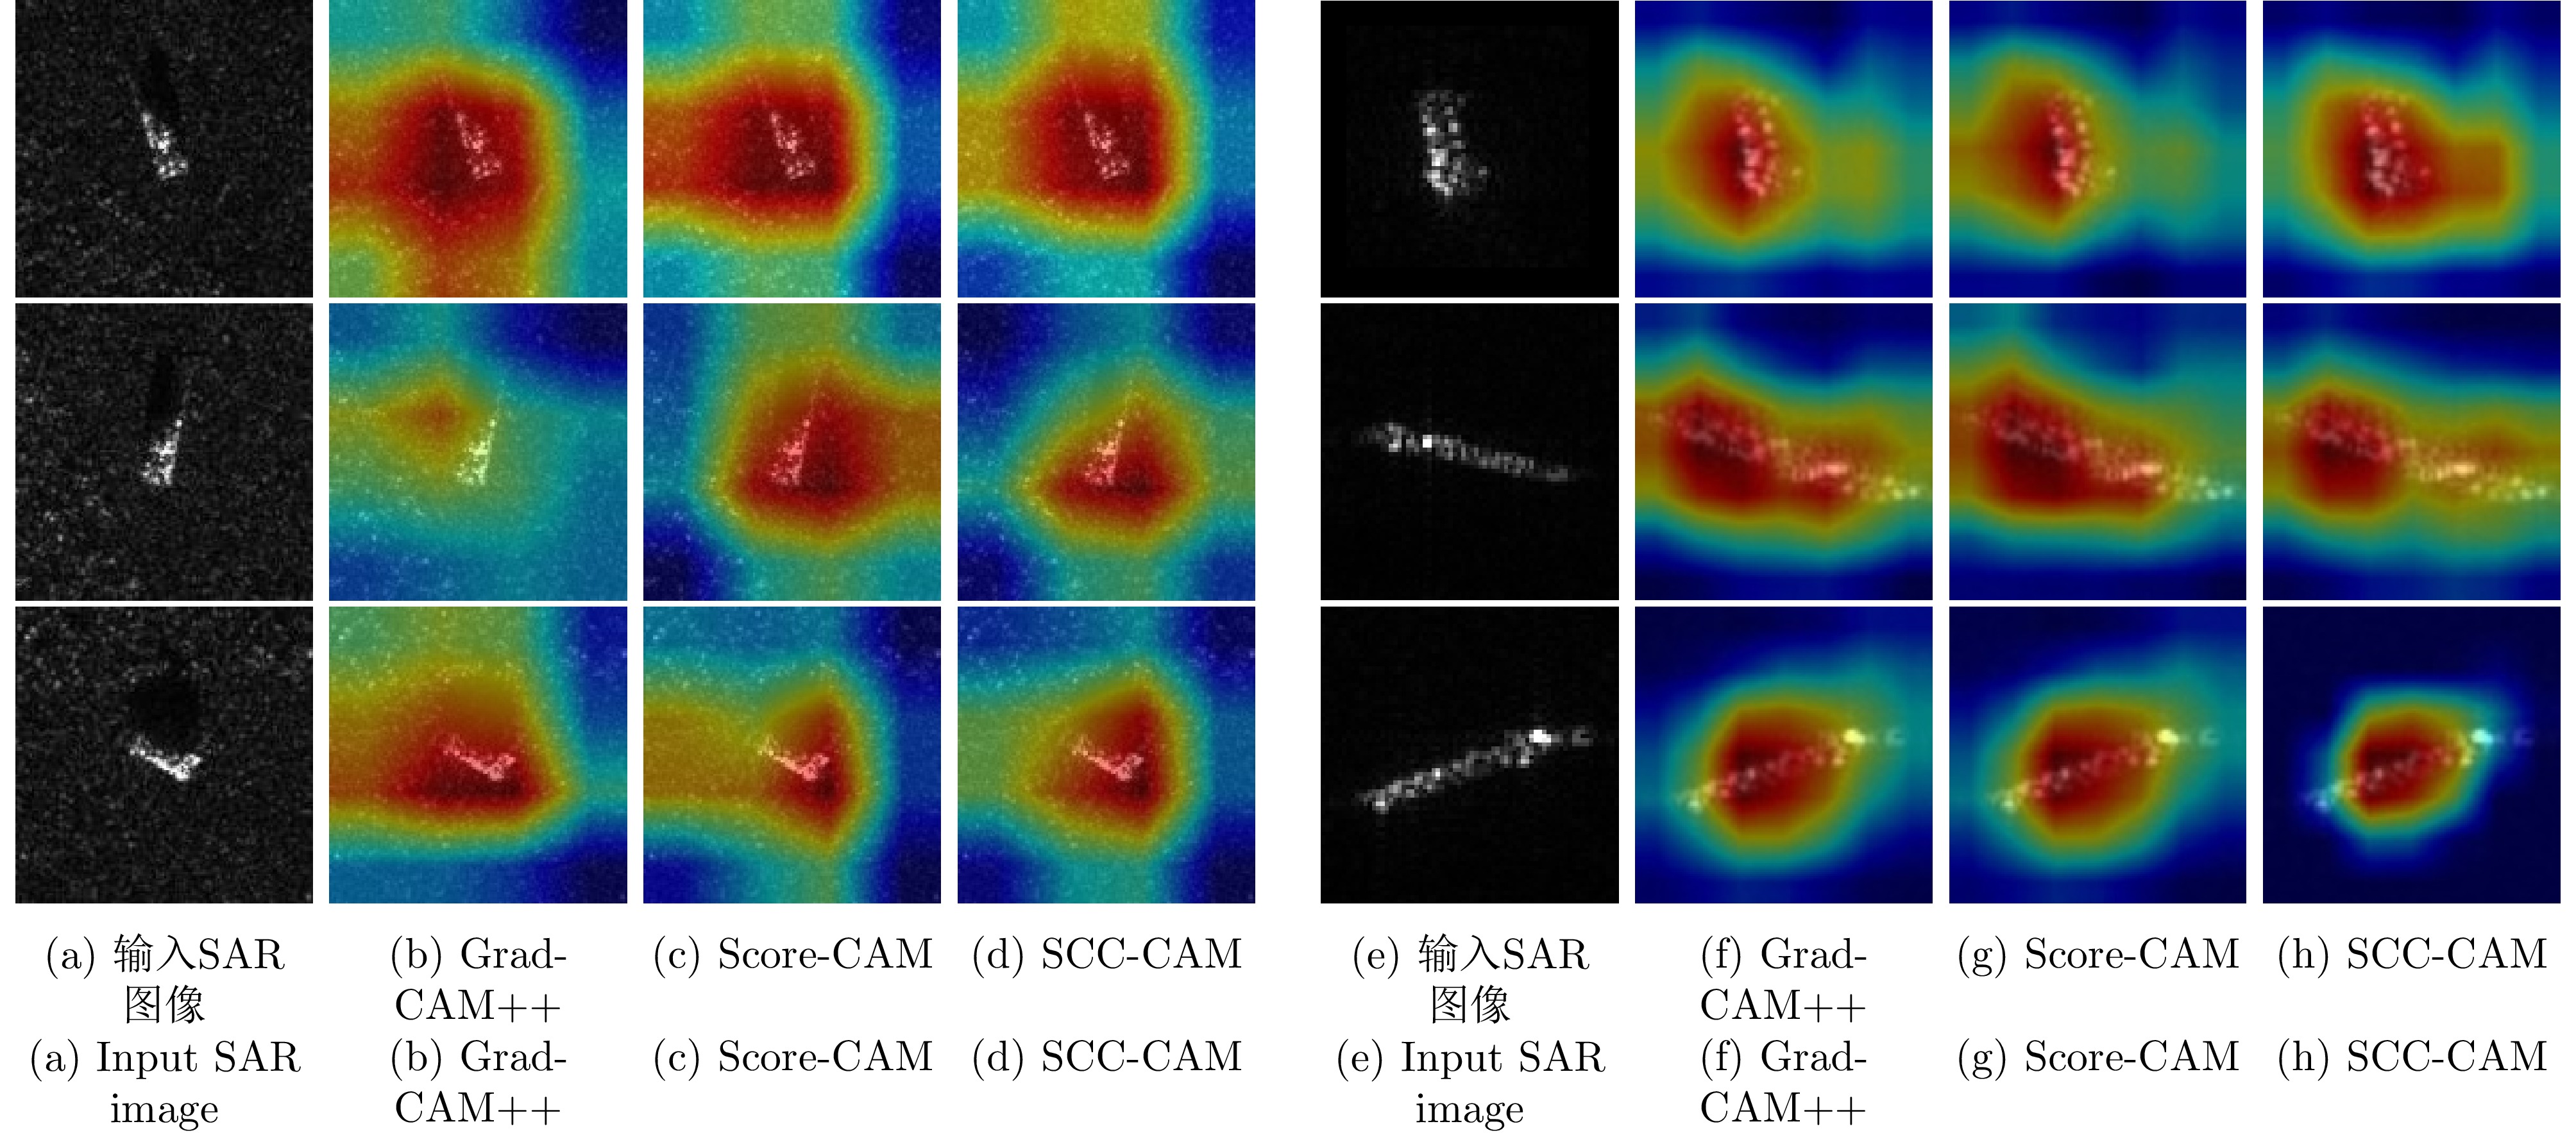
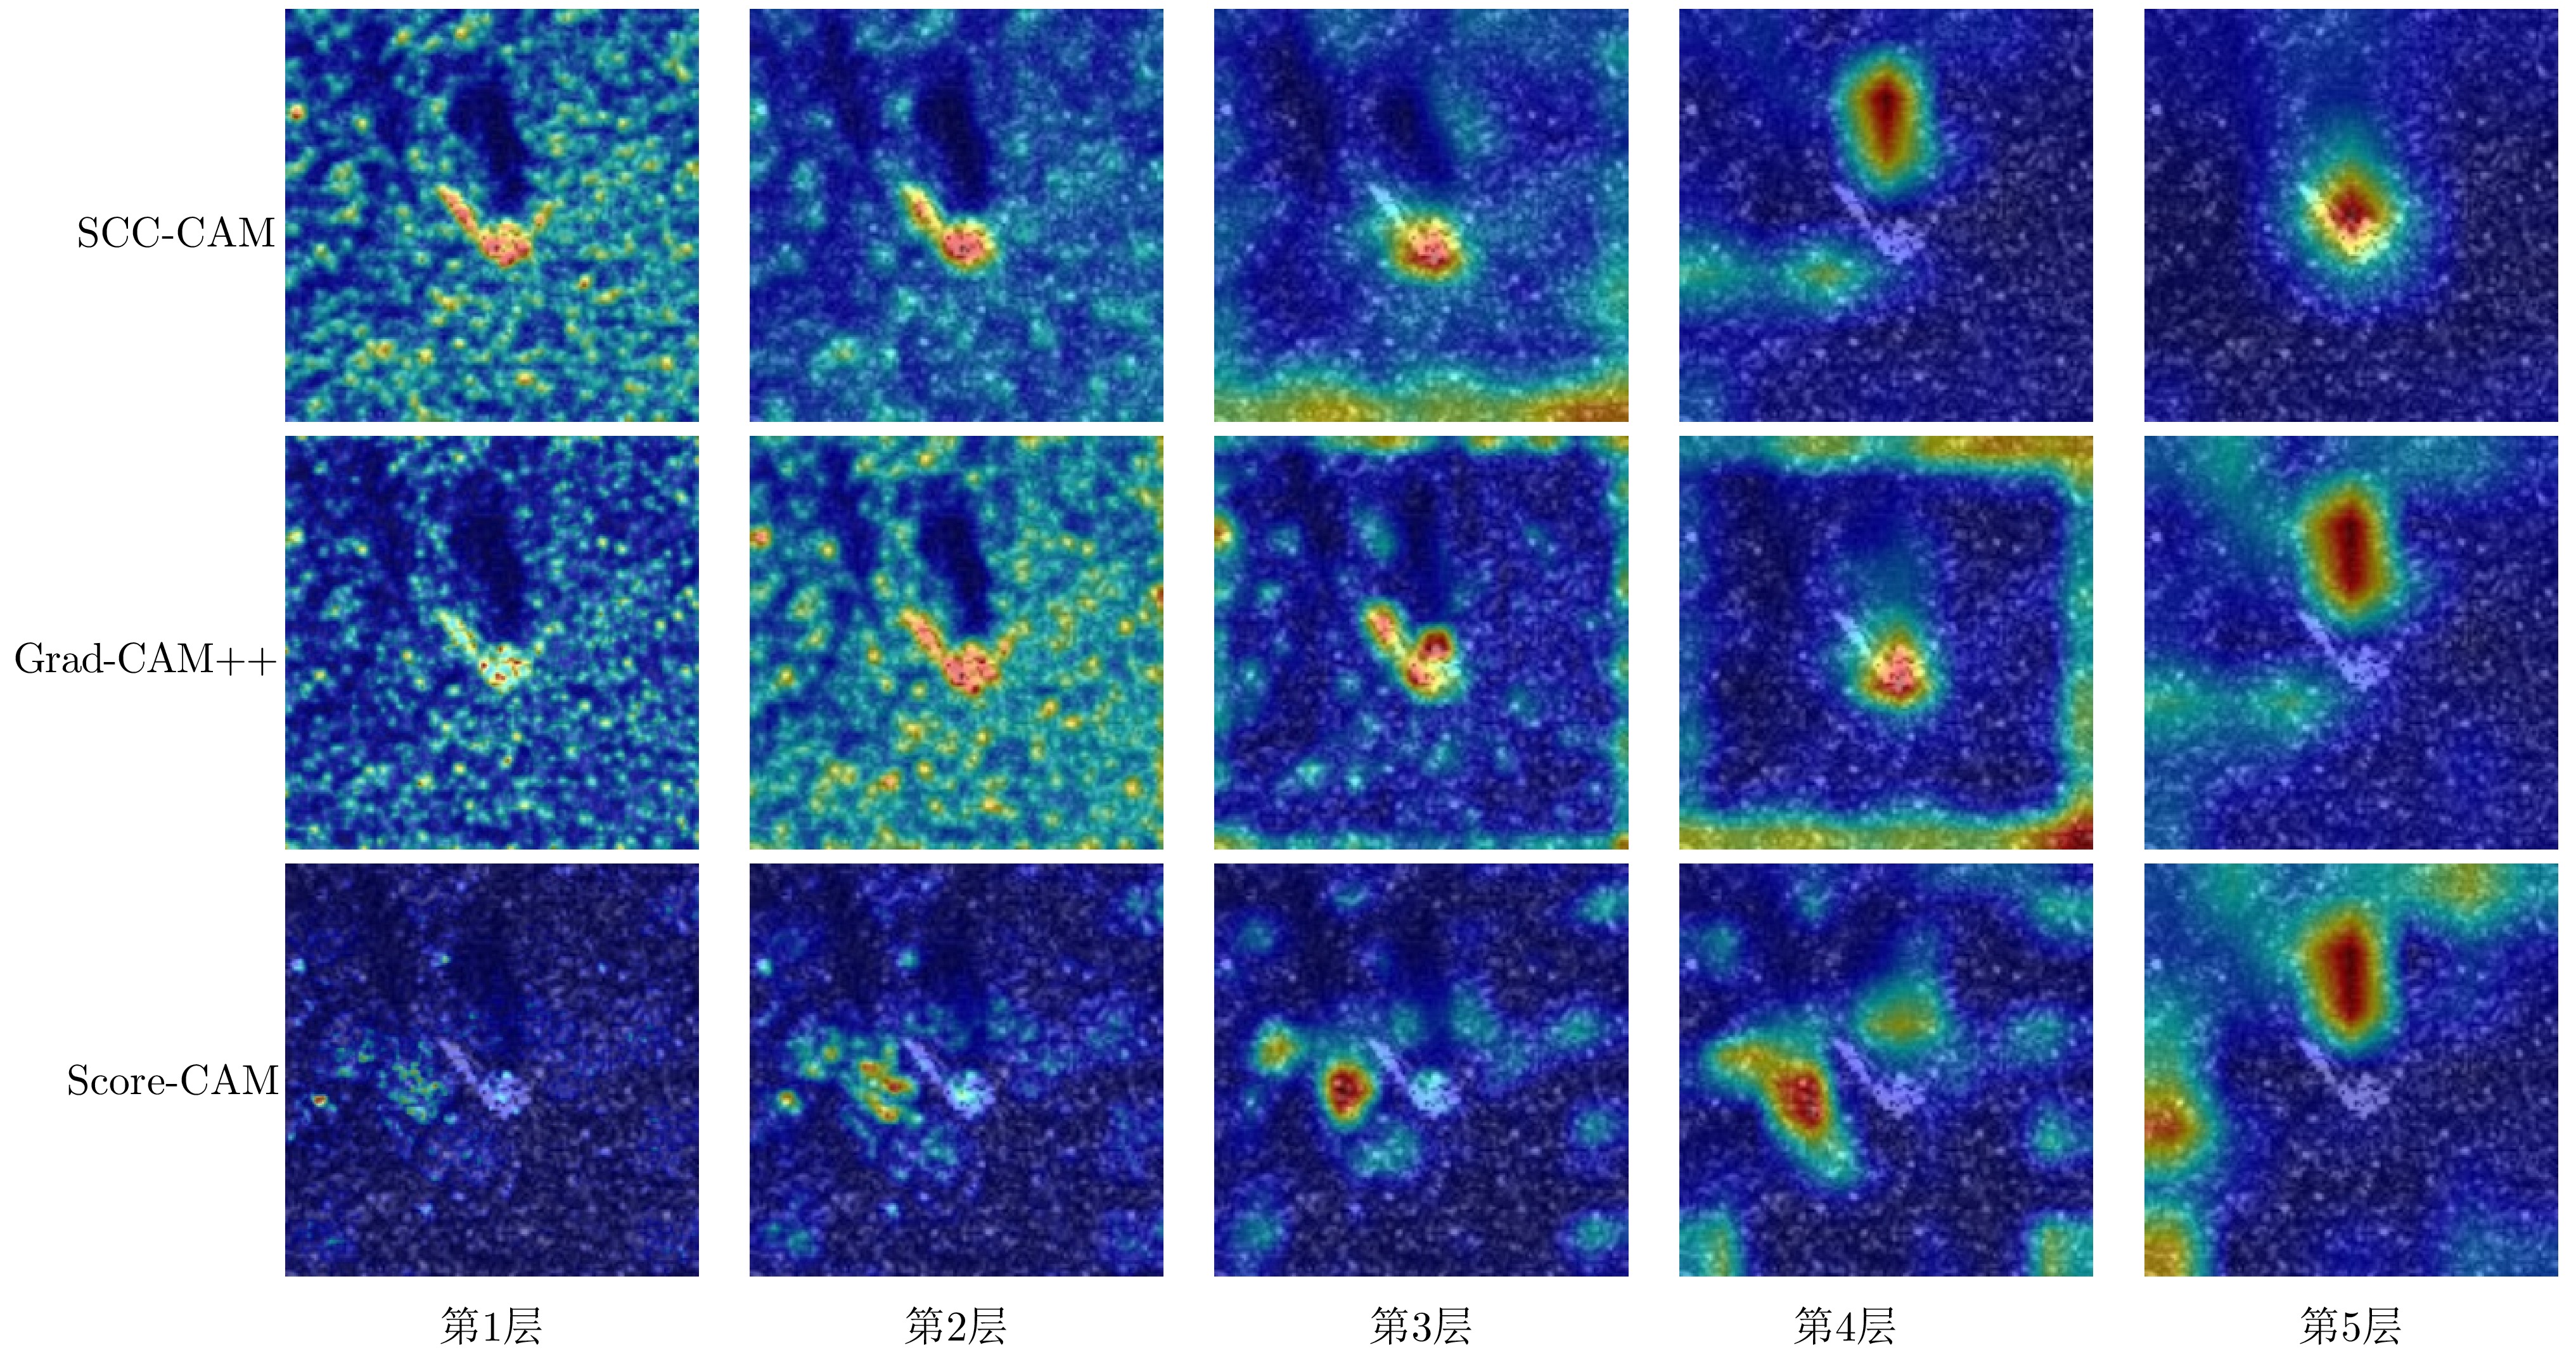
图 8 SCC-CAM, Grad-CAM++和Score-CAM在VGG16网络下提取的不同层显著性区域
Figure 8. Displays the salient regions extracted by SCC-CAM, Grad-CAM++, and Score-CAM
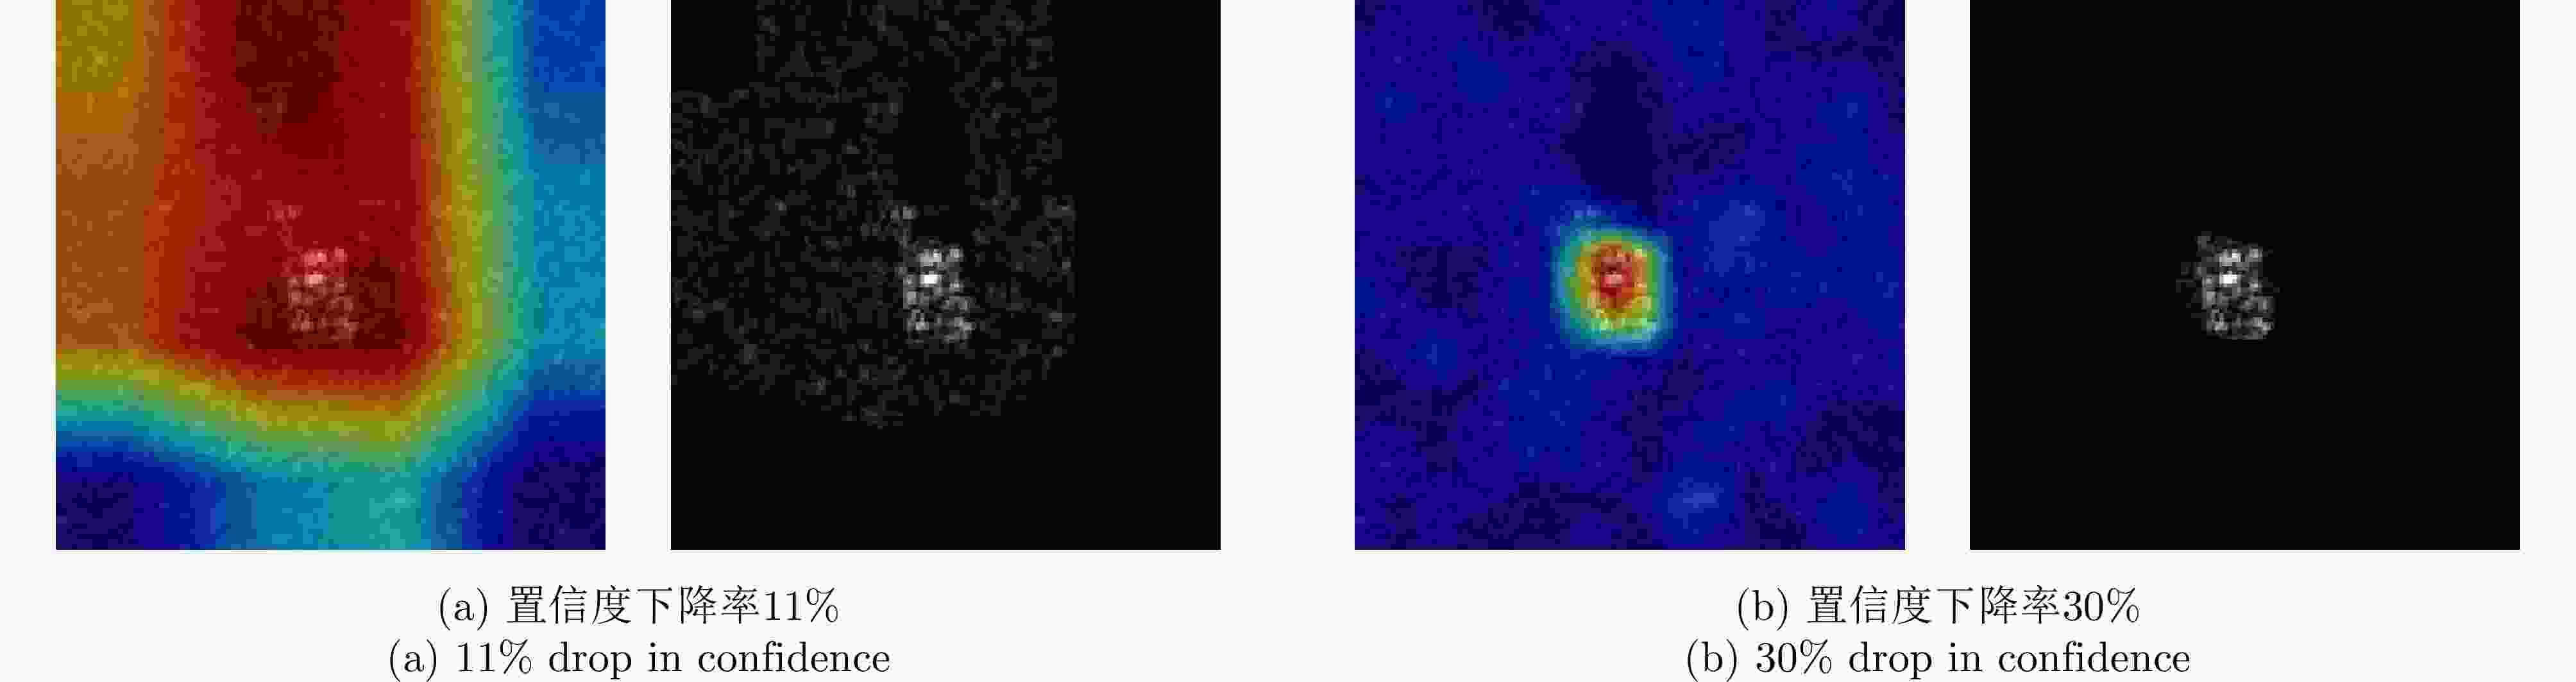
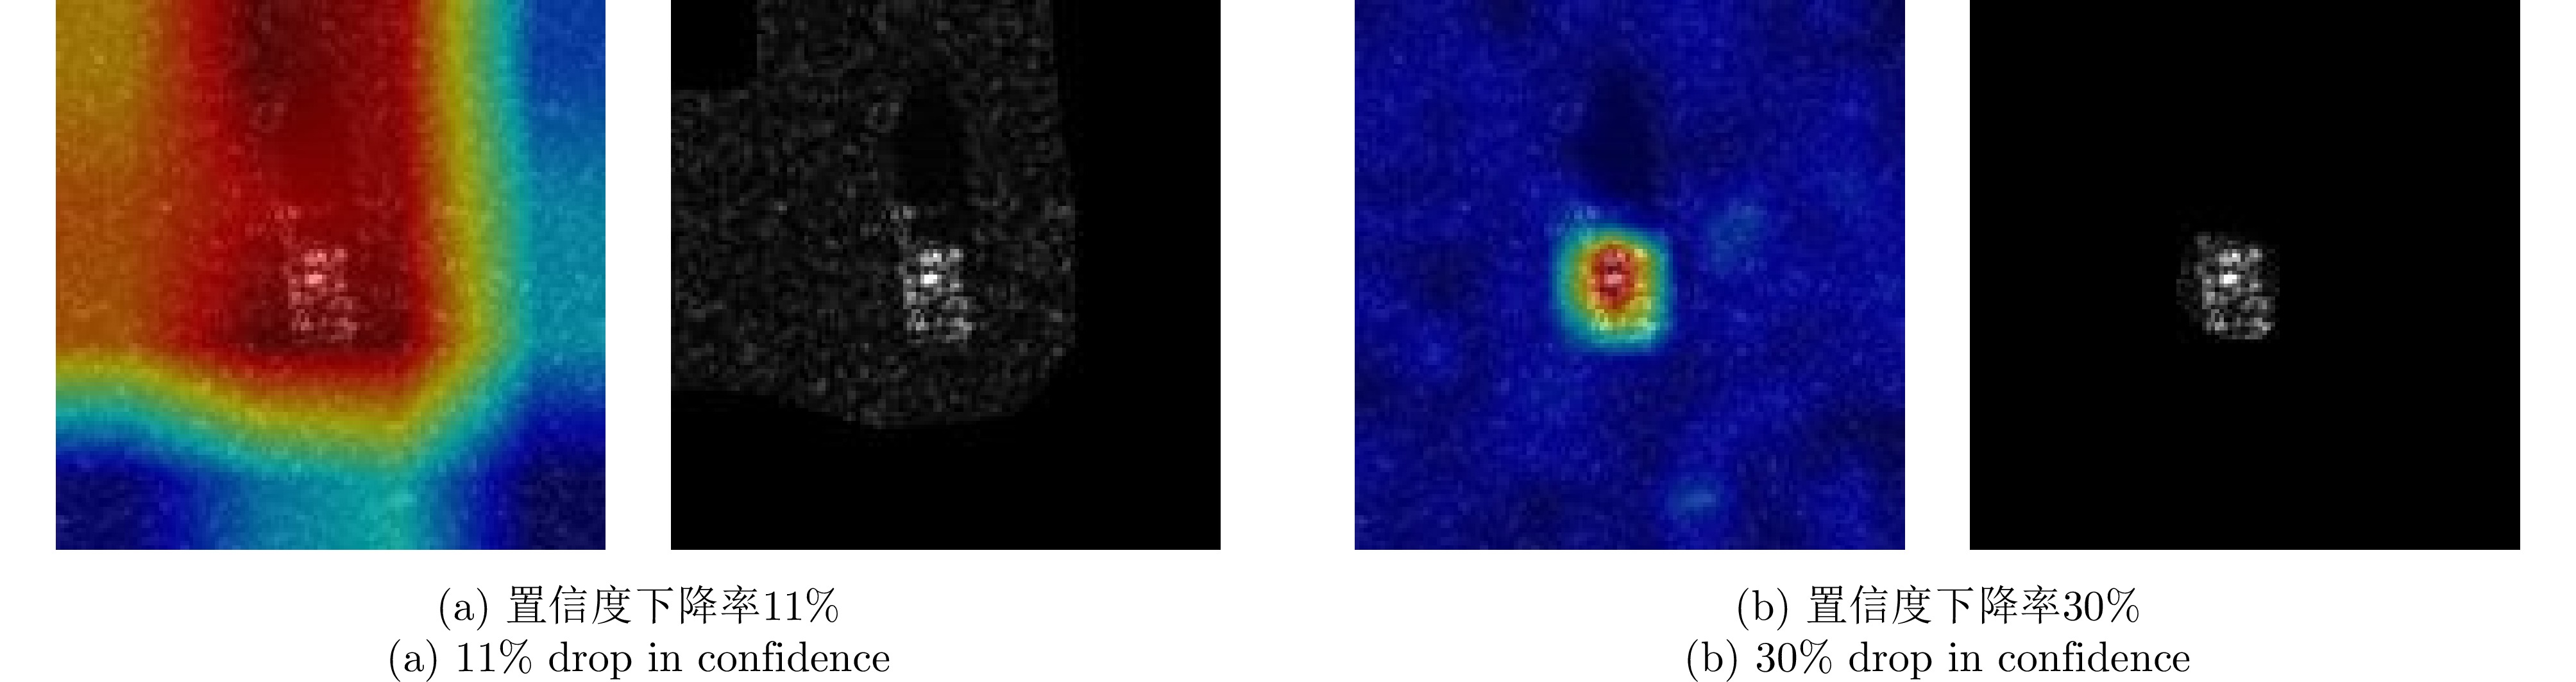
图 10 不同面积的显著性区域下置信度对比
Figure 10. Comparison of confidence scores under different area sizes of salient regions
1 SCC-CAM求解算法流程
1. SCC-CAM algorithm flow
Data: SAR图像$ {{\boldsymbol{I}}}_{{\mathrm{src}}} $,模型$ f\left(\cdot \right) $,目标类别y,尺度因子s,扰动
矩阵nResult: SCC-CAM显著性图 1 初始化; 2 $ q\leftarrow 0 $; 3 $ {\mathrm{lable}}\leftarrow f\left({{\boldsymbol{I}}}_{{\mathrm{src}}}\right) $; 4 $ {{\boldsymbol{\delta}} }^{\mathrm{*}}\leftarrow 0 $; 5 while $ {\mathrm{lable}}=y $ and $ q < 60 $ do 6 $ {{\boldsymbol{\delta}} }^{\mathrm{*}}=q\mathrm{*}{\boldsymbol{n}}\mathrm{*}s $; 7 $ {{\boldsymbol{I}}}_{{\mathrm{src}}}={{\boldsymbol{I}}}_{{\mathrm{src}}}+{{\boldsymbol{\delta}} }^{\mathrm{*}} $; 8 $ l=f\left({{\boldsymbol{I}}}_{{\mathrm{src}}}\right) $; 9 $ q=q+1 $; 10 end
11 $ {s}_{j}^{i}=\dfrac{{f}_{l}\left({{\boldsymbol{x}}}_{i}\right)\left[j\right]-{f}_{l}\left({{\boldsymbol{x}}}_{i}-{{\boldsymbol{\delta}} }^{\mathrm{*}}\right)\left[j\right]}{{f}_{l}\left({{\boldsymbol{x}}}_{i}\right)\left[j\right]} $;12 $ {{\boldsymbol{A}}}_{l}^{j}\leftarrow {f}_{l}\left({{\boldsymbol{x}}}_{i}\right)\left[j\right] $; 13 $ {\mathrm{SCC}}\_{\mathrm{CAM}}\leftarrow \sum _{j}{s}_{l}^{j}{\mathrm{Up}}\left({{\boldsymbol{A}}}_{l}^{j}\right) $;  下载: 导出CSV
表 1 MSTAR-SOC数据集样本选取情况
Table 1. The sample selection situation of the MSTAR-SOC dataset
类别 训练样本 测试样本 2S1 299 274 BMP2 233 195 BRDM2 298 274 BTR60 256 195 BTR70 233 196 D7 299 274 T62 298 273 T72 232 196 ZIL131 299 274 ZSU23-4 299 274
下载: 导出CSV
表 2 OpenSARShip-1.0数据集样本选取情况
Table 2. The sample selection situation of the OpenSARShip-1.0 dataset
类别 训练样本 测试样本 BulkCarrier 160 40 Cargo 160 40 Container 160 40
下载: 导出CSV
表 3 不同网络模型的平均置信度下降率(%)
Table 3. Average confidence degradation rates across different network models (%)
数据集 网络模型 Grad-CAM++ Score-CAM SCC-CAM MSTAR-SOC VGG16 59.60 59.01 57.20 ResNet18 60.54 55.91 52.77 自建网络 46.00 43.29 42.14 OpenSARShip-
1.0VGG16 44.27 39.13 37.40 ResNet18 46.94 42.17 41.84 自建网络 41.49 37.89 33.66
下载: 导出CSV
表 4 不同网络模型的基于面积约束的平均置信度下降率(%)
Table 4. Average confidence degradation rates based on area constraints across different network models (%)
数据集 网络模型 Grad-CAM++ Score-CAM SCC-CAM MSTAR-SOC VGG16 7.19 5.74 4.82 ResNet18 17.87 14.61 12.97 自建网络 1.82 2.06 1.54 OpenSARShip-
1.0VGG16 6.20 6.02 4.10 ResNet18 17.56 15.55 13.09 自建网络 2.14 3.45 1.53
下载: 导出CSV
表 5 不同网络模型的置信度上升比例(%)
Table 5. Confidence ascent ratios across different network models (%)
数据集 网络模型 Grad-CAM++ Score-CAM SCC-CAM MSTAR-SOC VGG16 14.31 16.25 17.07 ResNet18 15.55 16.74 17.69 自建网络 19.22 21.40 21.94 OpenSARShip-
1.0VGG16 13.33 14.17 15.83 ResNet18 16.71 17.08 19.86 自建网络 17.50 19.17 20.83
下载: 导出CSV
表 6 显著性区域用作训练集的分类性能(%)
Table 6. The performance of saliency area is used as the training set (%)
数据集 网络模型 Grad-CAM++ Score-CAM SCC-CAM MSTAR-SOC VGG16 71.01 74.97 76.00 ResNet18 70.31 75.34 77.20 自建网络 78.89 80.08 81.24 OpenSARShip-
1.0VGG16 77.50 81.67 83.33 ResNet18 78.33 80.00 80.00 自建网络 80.00 82.25 85.00
下载: 导出CSV
-
[1] PANATI C, WAGNER S, and BRÜGGENWIRTH S. Feature relevance evaluation using grad-CAM, LIME and SHAP for deep learning SAR data classification[C]. 2022 23rd International Radar Symposium (IRS), Gdansk, Poland, 2022: 457–462. doi: 10.23919/irs54158.2022.9904989. [2] SU Shenghan, CUI Ziteng, GUO Weiwei, et al. Explainable analysis of deep learning methods for SAR image classification[C]. IGARSS 2022–2022 IEEE International Geoscience and Remote Sensing Symposium, Kuala Lumpur, Malaysia, 2022: 2570–2573. doi: 10.1109/igarss46834.2022.9883815. [3] 李玮杰, 杨威, 刘永祥, 等. 雷达图像深度学习模型的可解释性研究与探索[J]. 中国科学: 信息科学, 2022, 52(6): 1114–1134. doi: 10.1360/SSI-2021-0102.LI Weijie, YANG Wei, LIU Yongxiang, et al. Research and exploration on the interpretability of deep learning model in radar image[J]. Scientia Sinica Informationis, 2022, 52(6): 1114–1134. doi: 10.1360/SSI-2021-0102. [4] 金亚秋. 多模式遥感智能信息与目标识别: 微波视觉的物理智能[J]. 雷达学报, 2019, 8(6): 710–716. doi: 10.12000/JR19083.JIN Yaqiu. Multimode remote sensing intelligent information and target recognition: Physical intelligence of microwave vision[J]. Journal of Radars, 2019, 8(6): 710–716. doi: 10.12000/JR19083. [5] KEYDEL E R, LEE S W, and MOORE J T. MSTAR extended operating conditions: A tutorial[C]. SPIE 2757, Algorithms for Synthetic Aperture Radar Imagery III, Orlando, USA, 1996: 228–242. doi: 10.1117/12.242059. [6] ZHAO Juanping, GUO Weiwei, ZHANG Zenghui, et al. A coupled convolutional neural network for small and densely clustered ship detection in SAR images[J]. Science China Information Sciences, 2019, 62(4): 42301. doi: 10.1007/s11432-017-9405-6. [7] 杜兰, 王兆成, 王燕, 等. 复杂场景下单通道SAR目标检测及鉴别研究进展综述[J]. 雷达学报, 2020, 9(1): 34–54. doi: 10.12000/JR19104.DU Lan, WANG Zhaocheng, WANG Yan, et al. Survey of research progress on target detection and discrimination of single-channel SAR images for complex scenes[J]. Journal of Radars, 2020, 9(1): 34–54. doi: 10.12000/JR19104. [8] 徐丰, 王海鹏, 金亚秋. 深度学习在SAR目标识别与地物分类中的应用[J]. 雷达学报, 2017, 6(2): 136–148. doi: 10.12000/JR16130.XU Feng, WANG Haipeng, and JIN Yaqiu. Deep learning as applied in SAR target recognition and terrain classification[J]. Journal of Radars, 2017, 6(2): 136–148. doi: 10.12000/JR16130. [9] 郭炜炜, 张增辉, 郁文贤, 等. SAR图像目标识别的可解释性问题探讨[J]. 雷达学报, 2020, 9(3): 462–476. doi: 10.12000/JR20059.GUO Weiwei, ZHANG Zenghui, YU Wenxian, et al. Perspective on explainable SAR target recognition[J]. Journal of Radars, 2020, 9(3): 462–476. doi: 10.12000/JR20059. [10] FENG Sijia, JI Kefeng, WANG Fulai, et al. Electromagnetic scattering feature (ESF) module embedded network based on ASC model for robust and interpretable SAR ATR[J]. IEEE Transactions on Geoscience and Remote Sensing, 2022, 60: 5235415. doi: 10.1109/tgrs.2022.3208333. [11] 吴飞, 廖彬兵, 韩亚洪. 深度学习的可解释性[J]. 航空兵器, 2019, 26(1): 39–46. doi: 10.12132/issn.1673-5048.2018.0065.WU Fei, LIAO Binbing, and HAN Yahong. Interpretability for deep learning[J]. Aero Weaponry, 2019, 26(1): 39–46. doi: 10.12132/issn.1673-5048.2018.0065. [12] 纪守领, 李进锋, 杜天宇, 等. 机器学习模型可解释性方法、应用与安全研究综述[J]. 计算机研究与发展, 2019, 56(10): 2071–2096. doi: 10.7544/issn1000-1239.2019.20190540.JI Shouling, LI Jinfeng, DU Tianyu, et al. Survey on techniques, applications and security of machine learning interpretability[J]. Journal of Computer Research and Development, 2019, 56(10): 2071–2096. doi: 10.7544/issn1000-1239.2019.20190540. [13] DHURANDHAR A, CHEN Pinyu, LUSS R, et al. Explanations based on the missing: Towards contrastive explanations with pertinent negatives[C]. 32nd International Conference on Neural Information Processing Systems, Montréal, Canada, 2018: 590–601. [14] DATCU M, ANDREI V, DUMITRU C O, et al. Explainable deep learning for SAR data[C]. Φ-week, Frascati, Italy, 2019. [15] LI Yang, WANG Jiabao, XU Yulong, et al. DeepSAR-Net: Deep convolutional neural networks for SAR target recognition[C]. 2017 IEEE 2nd International Conference on Big Data Analysis (ICBDA), Beijing, China, 2017: 740–743. doi: 10.1109/icbda.2017.8078734. [16] ZHAO Juanping, DATCU M, ZHANG Zenghui, et al. Contrastive-regulated CNN in the complex domain: A method to learn physical scattering signatures from flexible PolSAR images[J]. IEEE Transactions on Geoscience and Remote Sensing, 2019, 57(12): 10116–10135. doi: 10.1109/tgrs.2019.2931620. [17] HUANG Zhongling, DATCU M, PAN Zongxu, et al. Deep SAR-Net: Learning objects from signals[J]. ISPRS Journal of Photogrammetry and Remote Sensing, 2020, 161: 179–193. doi: 10.1016/j.isprsjprs.2020.01.016. [18] HUANG Zhongling, DUMITRU C O, and REN Jun. Physics-aware feature learning of SAR images with deep neural networks: A case study[C]. 2021 IEEE International Geoscience and Remote Sensing Symposium IGARSS, Brussels, Belgium, 2021: 1264–1267. doi: 10.1109/igarss47720.2021.9554842. [19] HUANG Zhongling, YAO Xiwen, LIU Ying, et al. Physically explainable CNN for SAR image classification[J]. ISPRS Journal of Photogrammetry and Remote Sensing, 2022, 190: 25–37. doi: 10.1016/j.isprsjprs.2022.05.008. [20] LI Yi, DU Lan, and WEI Di. Multiscale CNN based on component analysis for SAR ATR[J]. IEEE Transactions on Geoscience and Remote Sensing, 2022, 60: 5211212. doi: 10.1109/tgrs.2021.3100137. [21] ZEILER M D and FERGUS R. Visualizing and understanding convolutional networks[C]. 13th European Conference on Computer Vision, Zurich, Switzerland, 2014: 818–833. doi: 10.1007/978-3-319-10590-1_53. [22] ZHOU Bolei, KHOSLA A, LAPEDRIZA A, et al. Learning deep features for discriminative localization[C]. 2016 IEEE Conference on Computer Vision and Pattern Recognition (CVPR), Las Vegas, USA, 2016: 2921–2929. doi: 10.1109/cvpr.2016.319. [23] SELVARAJU R R, COGSWELL M, DAS A, et al. Grad-CAM: Visual explanations from deep networks via gradient-based localization[C]. IEEE International Conference on Computer Vision, Venice, Italy, 2017: 618–626. doi: 10.1109/iccv.2017.74. [24] CHATTOPADHAY A, SARKAR A, HOWLADER P, et al. Grad-CAM++: Generalized gradient-based visual explanations for deep convolutional networks[C]. 2018 IEEE Winter Conference on Applications of Computer Vision (WACV), Lake Tahoe, USA, 2018: 839–847. doi: 10.1109/wacv.2018.00097. [25] WANG Haofan, WANG Zifan, DU Mengnan, et al. Score-CAM: Score-weighted visual explanations for convolutional neural networks[C]. 2020 IEEE/CVF Conference on Computer Vision and Pattern Recognition Workshops (CVPRW), Seattle, USA, 2020: 111–119. doi: 10.1109/cvprw50498.2020.00020. [26] FENG Zhenpeng, ZHU Mingzhe, STANKOVIĆ L, et al. Self-matching CAM: A novel accurate visual explanation of CNNs for SAR image interpretation[J]. Remote Sensing, 2021, 13(9): 1772. doi: 10.3390/rs13091772. [27] SUNDARARAJAN M, TALY A, and YAN Qiqi. Axiomatic attribution for deep networks[C]. 34th International Conference on Machine Learning, Sydney, Australia, 2017: 3319–3328. [28] MONTAVON G, SAMEK W, and MÜLLER K R. Methods for interpreting and understanding deep neural networks[J]. Digital Signal Processing, 2018, 73: 1–15. doi: 10.1016/j.dsp.2017.10.011. [29] 匡纲要, 高贵, 蒋咏梅, 等. 合成孔径雷达: 目标检测理论、算法及应用[M]. 长沙: 国防科技大学出版社, 2007: 45–50.KUANG Gangyao, GAO Gui, JIANG Yongmei, et al. Synthetic Aperture Radar Target: Detection Theory Algorithms and Applications[M]. Changsha: National University of Defense Technology Press, 2007: 45–50. [30] ANASTASSOPOULOS, LAMPROPOULOS G A, DROSOPOULOS A, et al. High resolution radar clutter statistics[J]. IEEE Transactions on Aerospace and Electronic Systems, 1999, 35(1): 43–60. doi: 10.1109/7.745679. [31] KURUOGLU E E and ZERUBIA J. Modeling SAR images with a generalization of the Rayleigh distribution[J]. IEEE Transactions on Image Processing, 2004, 13(4): 527–533. doi: 10.1109/TIP.2003.818017. [32] BELLONI C, BALLERI A, AOUF N, et al. Explainability of deep SAR ATR through feature analysis[J]. IEEE Transactions on Aerospace and Electronic Systems, 2021, 57(1): 659–673. doi: 10.1109/taes.2020.3031435. [33] RICE J A. Mathematical Statistics and Data Analysis[M]. 3rd ed. Belmont: Cengage Learning, 2006: 71–99. [34] BERTSEKAS D P and TSITSIKLIS J N. Introduction to Probability[M]. Cambridge: Massachusetts Institute of Technology, 2000: 6–48. [35] SIMONYAN K, VEDALDI A, and ZISSERMAN A. Deep inside convolutional networks: Visualising image classification models and saliency maps[C]. 2nd International Conference on Learning Representations, Banff, Canada, 2014. [36] HE Kaiming, ZHANG Xiangyu, REN Shaoqing, et al. Delving deep into rectifiers: Surpassing human-level performance on ImageNet classification[C]. IEEE International Conference on Computer Vision, Santiago, Chile, 2015: 1026–1034. doi: 10.1109/iccv.2015.123. [37] FONG R C and VEDALDI A. Interpretable explanations of black boxes by meaningful perturbation[C]. IEEE International Conference on Computer Vision, Venice, Italy, 2017: 3449–3457. doi: 10.1109/ICCV.2017.371. [38] ANCONA M, OZTIRELI C, and GROSS M. Explaining deep neural networks with a polynomial time algorithm for shapley value approximation[C]. In International Conference on Machine Learning. PMLR, 2019: 272–281. doi: 10.48550/arXiv.1903.10992. [39] DIEMUNSCH J R and WISSINGER J. Moving and stationary target acquisition and recognition (MSTAR) model-based automatic target recognition: Search technology for a robust ATR[C]. SPIE 3370, Algorithms for synthetic aperture radar Imagery V, Orlando, USA, 1998: 481–492. doi: 10.1117/12.321851. [40] HUANG Lanqing, LIU Bin, LI Boying, et al. OpenSARShip: A dataset dedicated to Sentinel-1 ship interpretation[J]. IEEE Journal of Selected Topics in Applied Earth Observations and Remote Sensing, 2018, 11(1): 195–208. doi: 10.1109/jstars.2017.2755672. [41] SIMONYAN K and ZISSERMAN A. Very deep convolutional networks for large-scale image recognition[C]. 3rd International Conference on Learning Representations, San Diego, USA, 2015. [42] HE Kaiming, ZHANG Xiangyu, REN Shaoqing, et al. Deep residual learning for image recognition[C]. IEEE Conference on Computer Vision and Pattern Recognition, Las Vegas, USA, 2016: 770–778. doi: 10.1109/cvpr.2016.90. [43] HEILIGERS M and HUIZING A. On the importance of visual explanation and segmentation for SAR ATR using deep learning[C]. 2018 IEEE Radar Conference (RadarConf18), Oklahoma City, USA, 2018: 394–399. doi: 10.1109/radar.2018.8378591. [44] DEVRIES T and TAYLOR G W. Learning confidence for out-of-distribution detection in neural networks[EB/OL]. https://arxiv.org/abs/1802.04865, 2018. [45] LI Weijie, YANG Wei, LIU Li, et al. Discovering and explaining the noncausality of deep learning in SAR ATR[J]. IEEE Geoscience and Remote Sensing Letters, 2023, 20: 4004605. doi: 10.1109/lgrs.2023.3266493. -


计量
- 文章访问数:
- HTML全文浏览量:
- PDF下载量:
- 被引次数: 0

