Multiangle SAR Dataset Construction of Aircraft Targets Based on Angle Interpolation Simulation
-
摘要: 随着SAR技术应用领域的扩大以及SAR数据获取技术的发展,构建各种典型目标的多角度SAR数据集的需求日益迫切。针对飞机目标,目前尚未有比较完备的多角度SAR图像数据集。该文探索了一种基于实测数据和智能仿真相结合的数据集构建方法,通过飞行试验采集飞机目标SAR多角度数据,并基于散射分析和自注意力生成对抗网络实现特定角度的SAR图像内插仿真,从而为数据集构建和扩容提供新的解决方案。最后,在假定部分数据缺失的情况下,通过6种评价指标对仿真图像和实际采集图像的相似度进行了评价,验证了所提方法的有效性。Abstract: With the expansion of Synthetic Aperture Radar (SAR) applications and the development of SAR data acquisition technology, multiangle SAR datasets of various typical targets need to be constructed. Presently, a comprehensive multiangle SAR image dataset for aircraft targets is still lacking. This study explores a method of dataset construction based on the acquisition of actual data and intelligent simulation. Multiangle SAR images of aircraft targets are collected through flight tests, and the interpolation simulations of SAR images of specific angles are realized based on scattering analysis and self-attention generative adversarial network, which provide a new solution for dataset construction and expansion. Finally, under the assumption that some data are missing, the similarities between the simulated and actual images are evaluated using six evaluation indices, which verify the effectiveness of the proposed method.
-
表 1 对照实验设计
Table 1. Design of control experiment
对照实验 仿真方法 数据集 仿真图像 实验1 线性插值
DCGAN
SAGAN0°, 10°, 20°, ···, 330°, 340°, 350°等
36个角度的切片图像5°, 15°, 25°, ···, 335°, 345°, 355°等
36个角度的生成图像实验2 线性插值
DCGAN
SAGAN0°, 20°, 40°, ···, 300°, 320°, 340°等
18个角度的切片图像10°, 30°, 50°, ···, 310°, 330°, 350°等
18个角度的生成图像实验3 线性插值
DCGAN
SAGAN0°, 30°, 60°, ···, 270°, 300°, 330°等
12个角度的切片图像15°, 45°, 75°, ···, 285°, 315°, 345°等
12个角度的生成图像表 2 大棕熊飞机的实验结果
Table 2. The results of Quest
对照实验 评价指标 真实图像 线性插值 DCGAN SAGAN 实验1 均值
方差
动态范围
等效视数
辐射分辨率
MSSSIM8.3478
222.7115
24.0191
0.3544
4.4122
1.00007.2824
180.5600
24.0654
0.3296
4.5283
0.87962.2015
332.6937
24.0645
0.0155
9.8494
0.72087.4473
184.9680
23.6535
0.3411
4.5109
0.9109图像对比 


实验2均值
方差
动态范围
等效视数
辐射分辨率
MSSSIM7.9940
196.1860
23.9936
0.3610
4.3566
1.00007.3991
195.2122
24.0654
0.3201
4.5477
0.81761.9416
299.9074
24.0654
0.0132
10.1238
0.71827.9586
171.7767
23.5524
0.4067
4.2361
0.8687图像对比 


实验3均值
方差
动态范围
等效视数
辐射分辨率
MSSSIM9.3860
269.7321
24.0088
0.3585
4.4068
1.00006.8494
177.5682
24.0654
0.2871
4.6584
0.78953.9641
444.1880
24.0654
0.0371
8.4001
0.68727.2850
151.7025
23.1066
0.3805
4.2585
0.8322图像对比 


表 3 T504飞机的实验结果
Table 3. The results of T504
对照实验 评价指标 真实图像 线性插值 DCGAN SAGAN 实验1 均值
方差
动态范围
等效视数
辐射分辨率
MSSSIM7.6944
233.4476
24.0310
0.2890
4.7038
1.00006.4487
195.5095
24.0654
0.2472
4.9370
0.88832.3689
419.6468
24.0654
0.0139
10.0759
0.78656.9906
207.3487
23.7438
0.3000
4.7565
0.9144图像对比 


实验2均值
方差
动态范围
等效视数
辐射分辨率
MSSSIM7.6757
223.5757
24.0259
0.2928
4.6348
1.00006.2026
181.2341
24.0654
0.2448
4.9537
0.80562.6880
455.8974
24.0548
0.0168
9.6976
0.76337.6460
207.0935
23.6946
0.3564
4.5942
0.8757图像对比 


实验3均值
方差
动态范围
等效视数
辐射分辨率
MSSSIM8.0766
248.2839
24.0408
0.3004
4.6469
1.00005.8539
166.7415
24.0654
0.2394
4.9320
0.73463.7857
588.1618
24.0654
0.0259
9.2289
0.72767.7380
176.5282
23.3641
0.3768
4.2544
0.8358图像对比 


表 4 2S1的实验结果
Table 4. The results of 2S1
对照实验 评价指标 真实图像 DCGAN SAGAN 实验1 均值
方差
动态范围
等效视数
辐射分辨率
MSSSIM40.2738
2180.6988
24.0654
0.7570
3.3949
1.000017.9584
2994.0535
24.0654
0.1094
6.1325
0.633437.3199
1911.7460
24.0654
0.7521
3.3834
0.6378图像对比 


实验2 均值
方差
动态范围
等效视数
辐射分辨率
MSSSIM37.8375
2047.7608
24.0654
0.7171
3.4513
1.000016.6881
2725.6077
24.0654
0.1034
6.1879
0.627138.1466
1780.0209
24.0654
0.8523
3.2304
0.6078图像对比 


实验3均值
方差
动态范围
等效视数
辐射分辨率
MSSSIM41.7061
2236.8337
24.0654
0.7884
3.3453
1.000015.5795
2792.1799
24.0654
0.0872
6.4576
0.559436.2191
1809.6890
24.0654
0.7392
3.4129
0.5744图像对比 


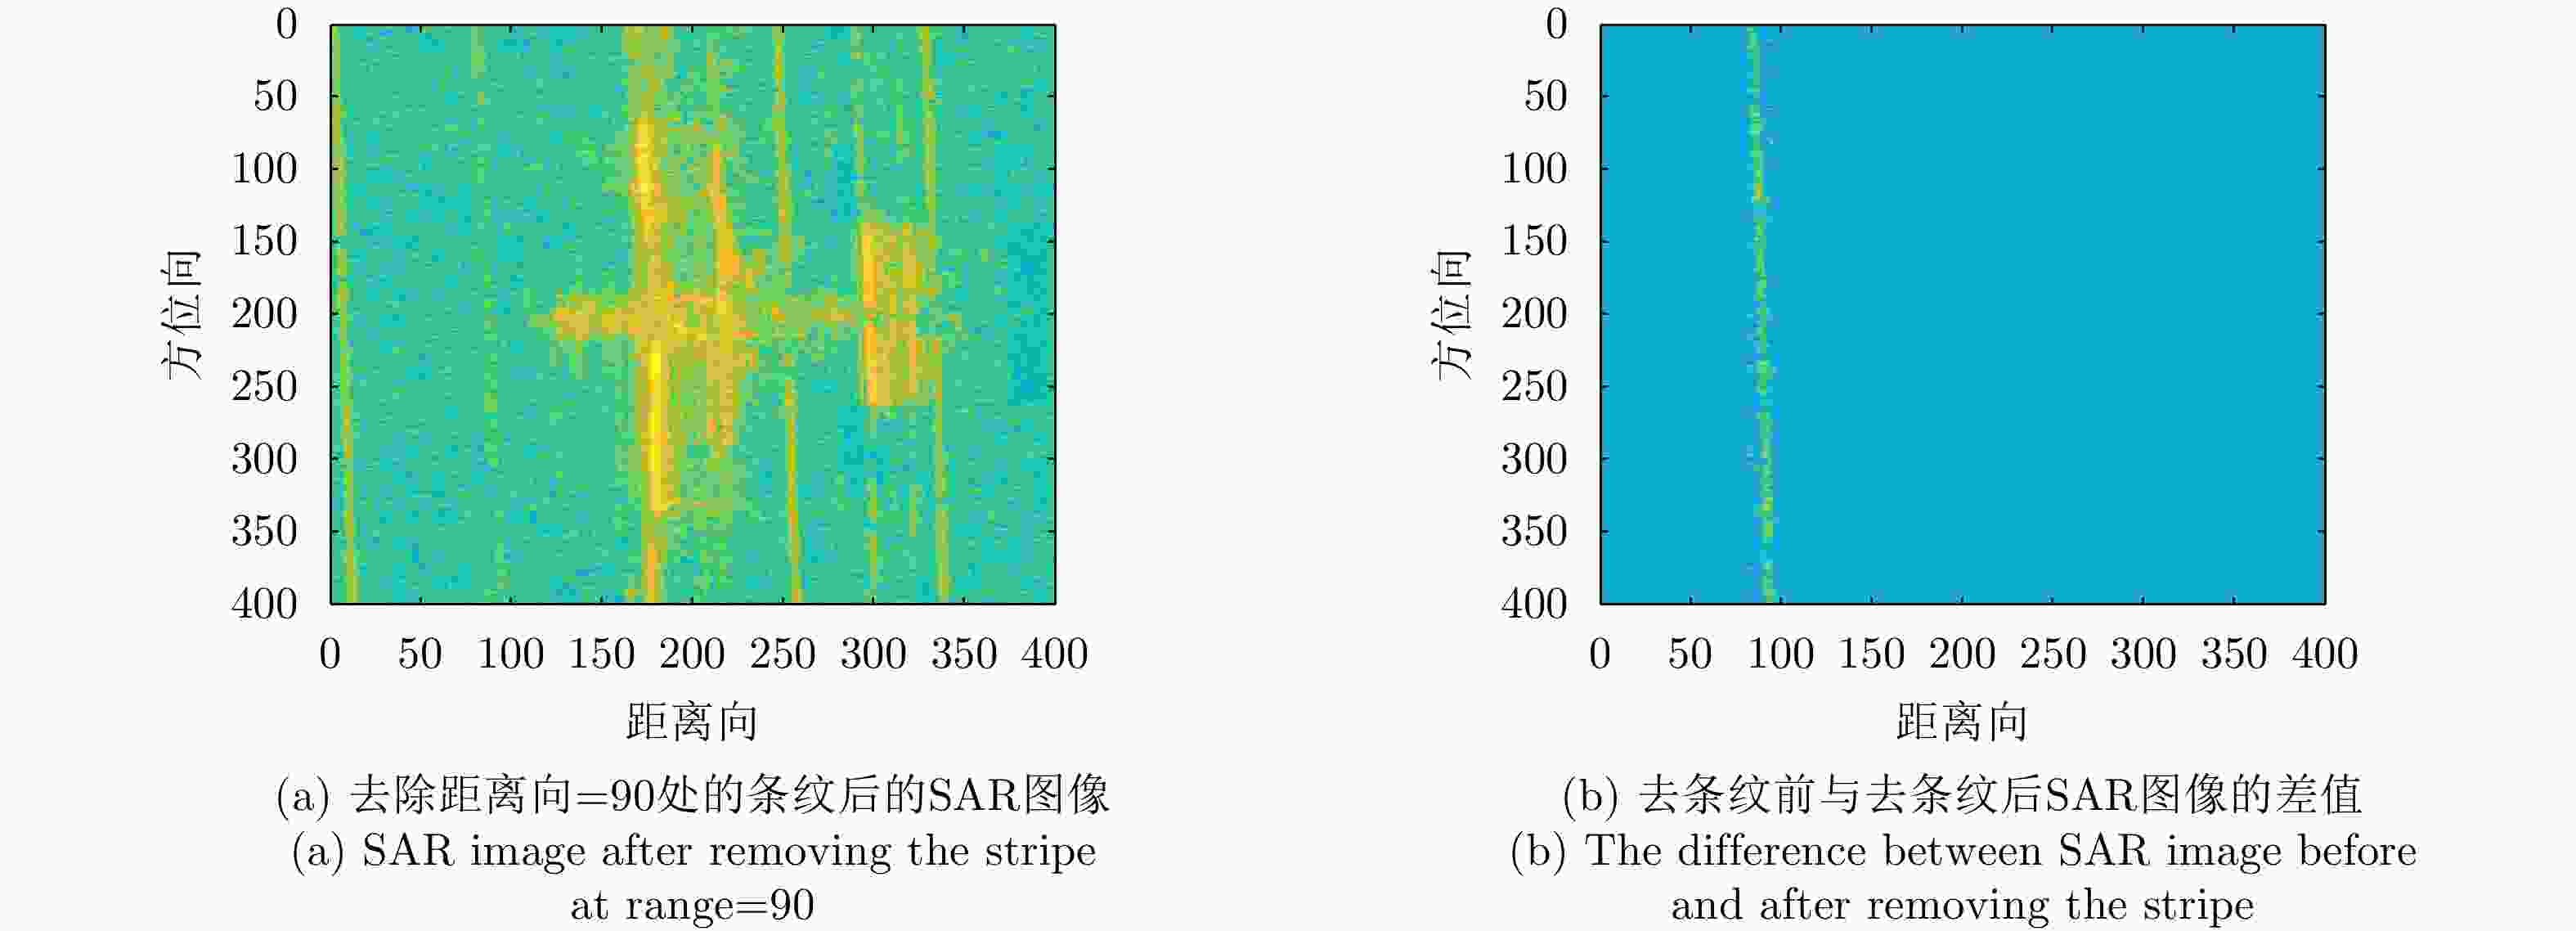
表 5 条纹背景去除前后的SAR图像对比
Table 5. Comparison of SAR images before and after removing stripes
角度 去除条纹前的SAR图像 去除条纹后的SAR图像 去条纹前后SAR图像的差值 0° 


85° 


90° 


175° 


180° 


270° 


355° 


表 6 去除条纹区域的对照实验结果
Table 6. The results of the control experiment with the removal of the background area
对照实验 评价指标 去条纹前的
仿真图像去条纹后的
仿真图像实验1 均值
方差
动态范围
等效视数
辐射分辨率
MSSSIM7.4473
184.9680
23.6535
0.3411
4.5109
0.91096.9914
222.9078
23.6961
0.3154
4.9534
0.8978图像对比 

实验2均值
方差
动态范围
等效视数
辐射分辨率
MSSSIM7.9586
171.7767
23.5524
0.4067
4.2361
0.86877.9711
169.2302
23.5418
0.4252
4.3732
0.8752图像对比 

实验3均值
方差
动态范围
等效视数
辐射分辨率
MSSSIM7.2850
151.7025
23.1066
0.3805
4.2585
0.83228.2949
149.7321
23.5496
0.4837
4.4068
0.8299图像对比 

-
[1] 李彩萍, 张永军. 典型目标SAR图像模拟[J]. 指挥技术学院学报, 1999, 10(2): 60–64, 70.LI Caiping and ZHANG Yongjun. SAR image simulation of typical object[J]. Journal of Institute of Command and Technology, 1999, 10(2): 60–64, 70. [2] 李国靖, 叶伟, 劳国超, 等. 欺骗目标仿真SAR图像可信度评估方法[J]. 电子信息对抗技术, 2018, 33(3): 53–58. doi: 10.3969/j.issn.1674-2230.2018.03.011LI Guojing, YE Wei, LAO Guochao, et al. Credibility assessment for simulated SAR image of deceptive target[J]. Electronic Information Warfare Technology, 2018, 33(3): 53–58. doi: 10.3969/j.issn.1674-2230.2018.03.011 [3] GOODFELLOW I, POUGET-ABADIE J, MIRZA M, et al. Generative adversarial networks[J]. Advances in Nerual Information Processing System, 2014, 3: 2672–2680. doi: 10.1145/3422622 [4] GUO Jiayi, LEI Bin, DING Chibiao, et al. Synthetic aperture radar image synthesis by using generative adversarial nets[J]. IEEE Geoscience and Remote Sensing Letters, 2017, 14(7): 1111–1115. doi: 10.1109/LGRS.2017.2699196 [5] ZHANG Mingrui, CUI Zongyong, WANG Xianyuan, et al. Data augmentation method of SAR image dataset[C]. 2018 IEEE International Geoscience and Remote Sensing Symposium, Valencia, Spain, 2018: 5292–5295. [6] 张明蕊. SAR图像数据分集与扩容方法研究[D]. [硕士论文], 电子科技大学, 2019.ZHANG Mingrui. Research of SAR image data dversity and data augmentation method[D]. [Master disseration] School of Information and Communication Engineering, 2019. [7] 孙智博, 徐向辉. 基于谱归一化生成对抗网络的目标SAR图像仿真方法[J]. 计算机与现代化, 2020(8): 14–20. doi: 10.3969/j.issn.1006-2475.2020.08.003SUN Zhibo and XU Xianghui. Simulation method of target SAR image based on spectral normalization generative adversarial network[J]. Computer and Modernization, 2020(8): 14–20. doi: 10.3969/j.issn.1006-2475.2020.08.003 [8] LIU Lei, PAN Zongxu, QIU Xiaolan, et al. SAR target classification with CycleGAN transferred simulated samples[C]. IGARSS 2018-2018 IEEE International Geoscience and Remote Sensing Symposium, Valencia, Spain, 2018: 4411–4414. [9] 林翊青, 李景文. 大距离徙动情况下距离多普勒(RD)算法与后向投影(BP)算法的比较[J]. 雷达科学与技术, 2004, 2(6): 349–354. doi: 10.3969/j.issn.1672-2337.2004.06.007LIN Yiqing and LI Jingwen. Comparison of RD algorithm and BP algorithm under severe range migration[J]. Radar Science and Technology, 2004, 2(6): 349–354. doi: 10.3969/j.issn.1672-2337.2004.06.007 [10] 黄培康, 殷红成, 许小剑. 雷达目标特性[M]. 北京: 电子工业出版社, 2005: 51–63.HUANG Peikang, YIN Hongcheng, and XU Xiaojian. Radar Target Characteristic[M]. Beijing: Publishing House of Electronics Industry, 2005: 51–63. [11] TENG Fei, HONG Wen, and LIN Yun. Aspect entropy extraction using circular SAR data and scattering anisotropy analysis[J]. Sensors, 2019, 19(2): 346. doi: 10.3390/s19020346 [12] 邹秀芳, 朱定局. 生成对抗网络研究综述[J]. 计算机系统应用, 2019, 28(11): 1–9. doi: 10.15888/j.cnki.csa.007156ZOU Xiufang and ZHU Dingju. Review on generative adversarial network[J]. Computer Systems &Applications, 2019, 28(11): 1–9. doi: 10.15888/j.cnki.csa.007156 [13] ZHANG H, GOODFELLOW I, METAXAS D, et al. Self-attention generative adversarial networks[Z]. arXiv: 1805.08318, 2018. [14] MIYATO T, KATAOKA T, KOYAMA M, et al. Spectral normalization for generative adversarial networks[Z]. arXiv: 1802.05957, 2018. [15] 张晗. SAR图像质量评估方法研究[D]. [硕士论文], 国防科学技术大学, 2012: 23–25.ZHANG Han. Research on the SAR image quality assessment[D]. [Master disseration] National University of Defense Technology, 2012: 23–25. [16] WANG Z, SIMONCELLI E P, and BOVIK A C. Multiscale structural similarity for image quality assessment[C]. The Thirty-Seventh Asilomar Conference on Signals, Systems & Computers, 2003, Pacific Grove, USA, 2003: 1398–1402. -


 作者中心
作者中心 专家审稿
专家审稿 责编办公
责编办公 编辑办公
编辑办公
 下载:
下载:
