
 作者中心
作者中心 专家审稿
专家审稿 责编办公
责编办公 编辑办公
编辑办公
-
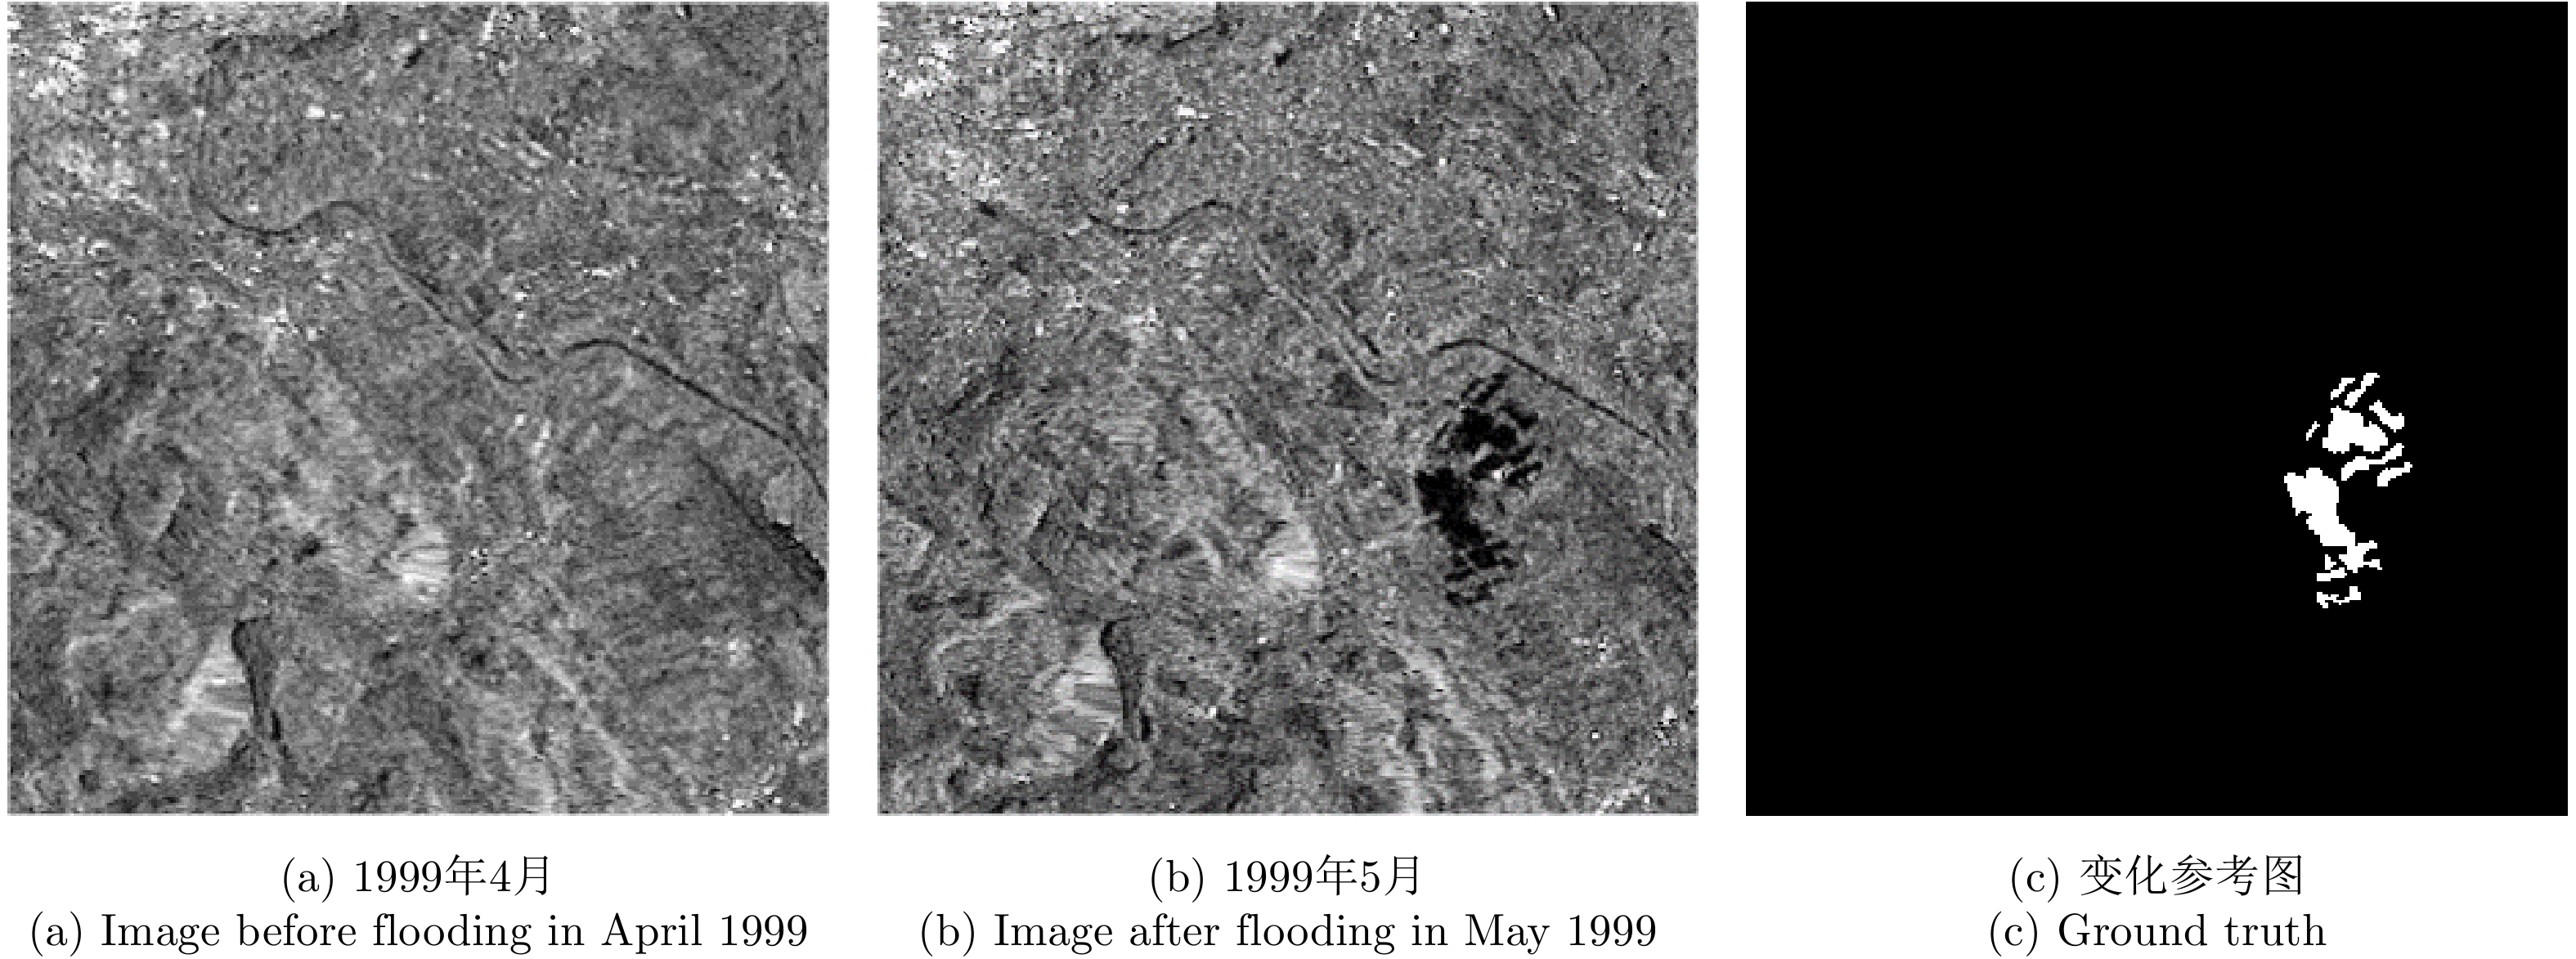
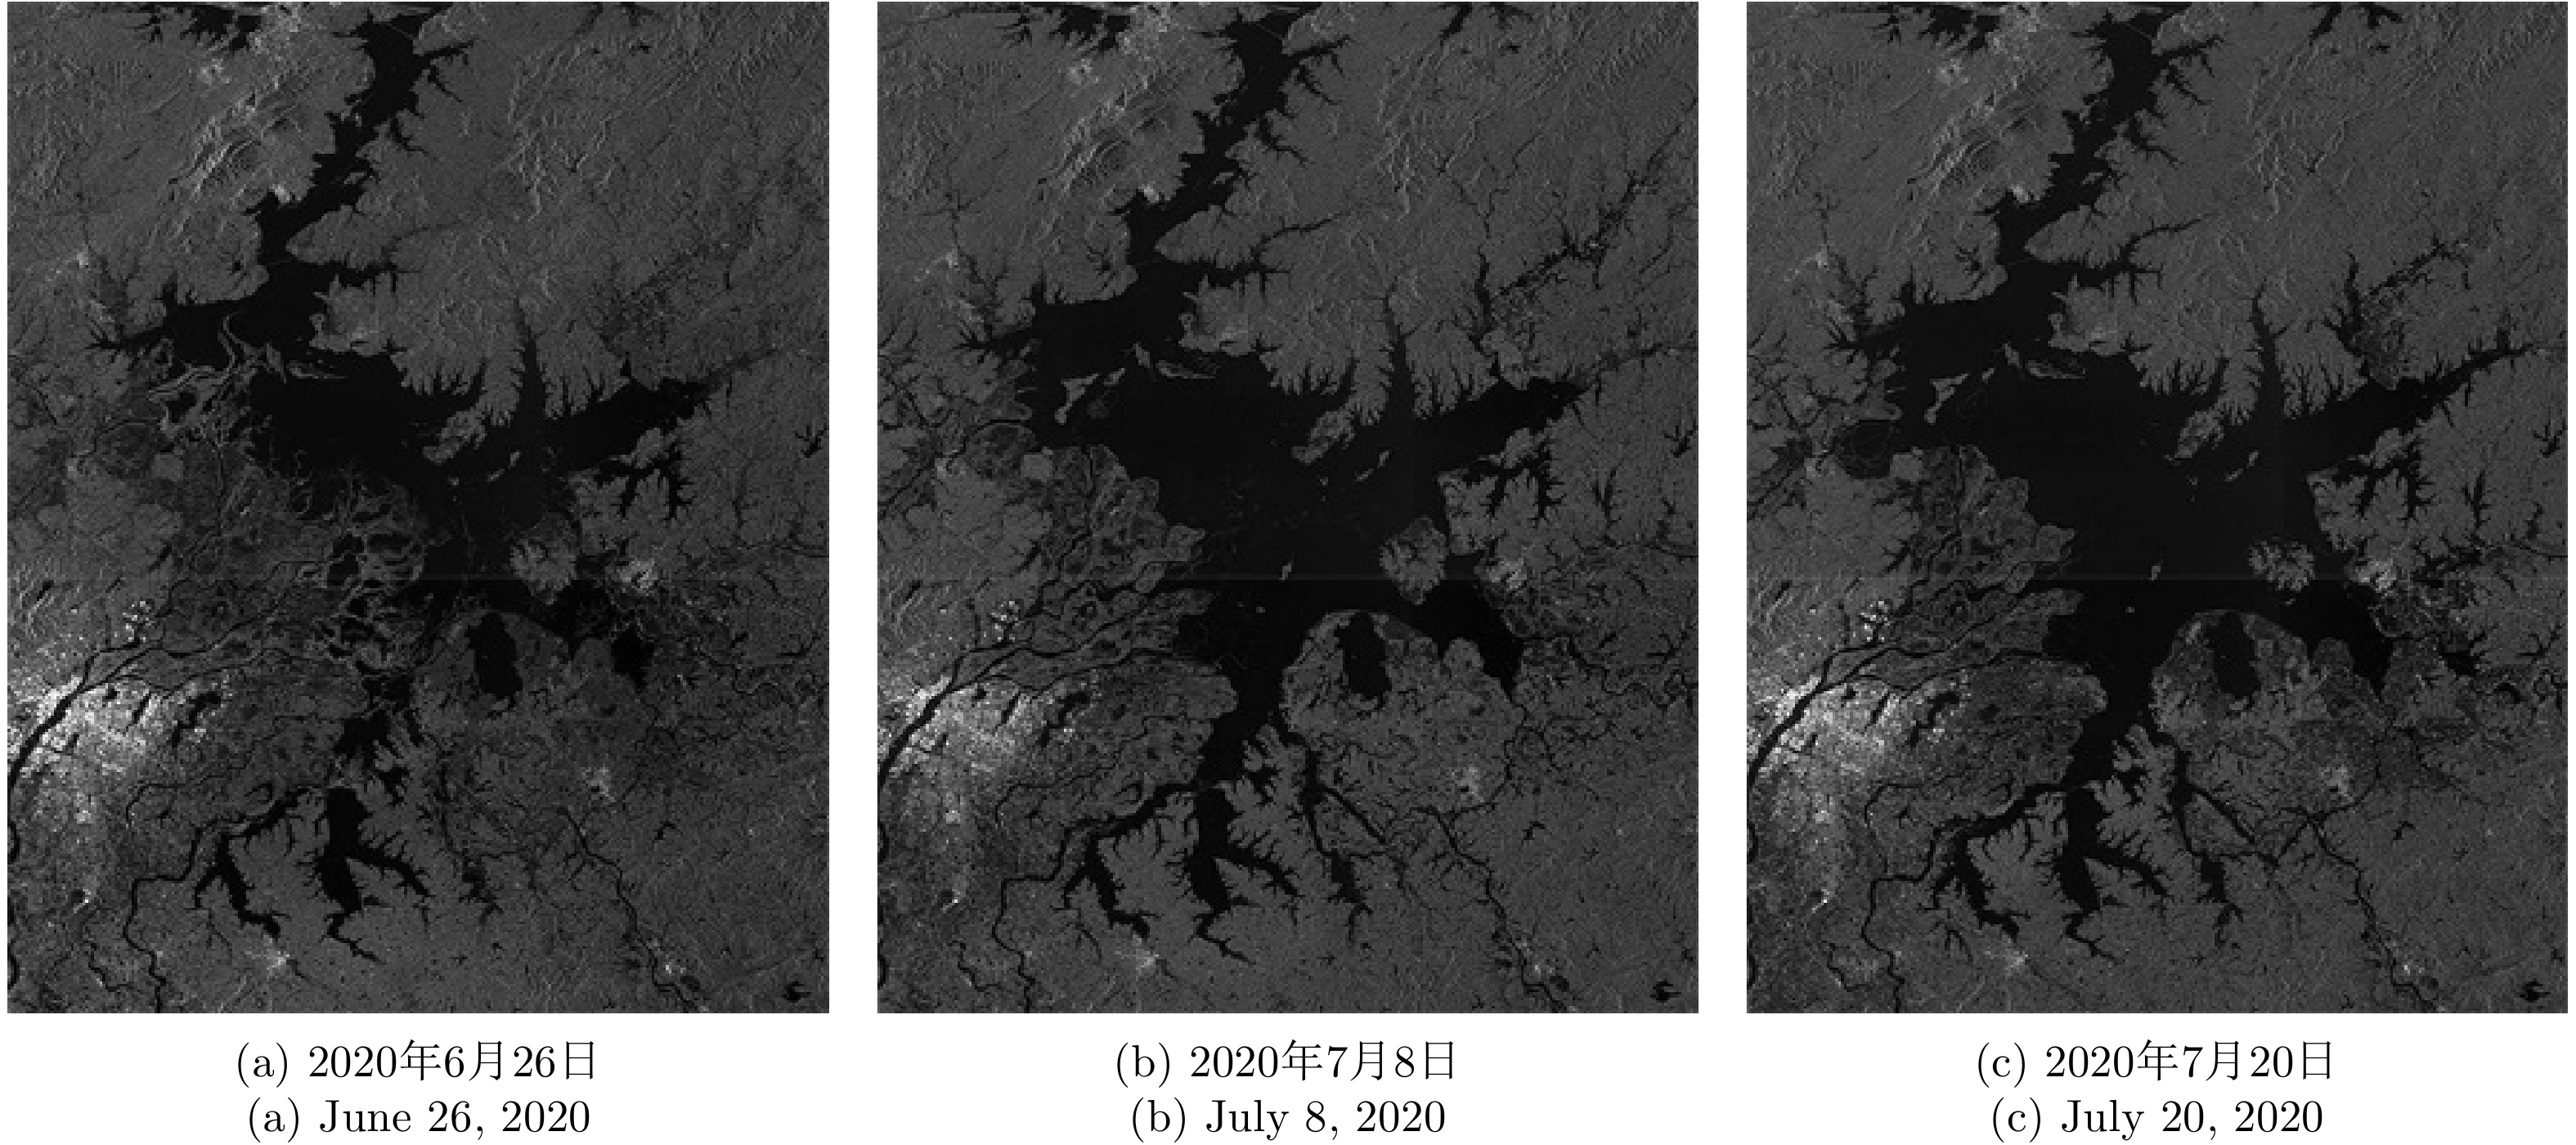
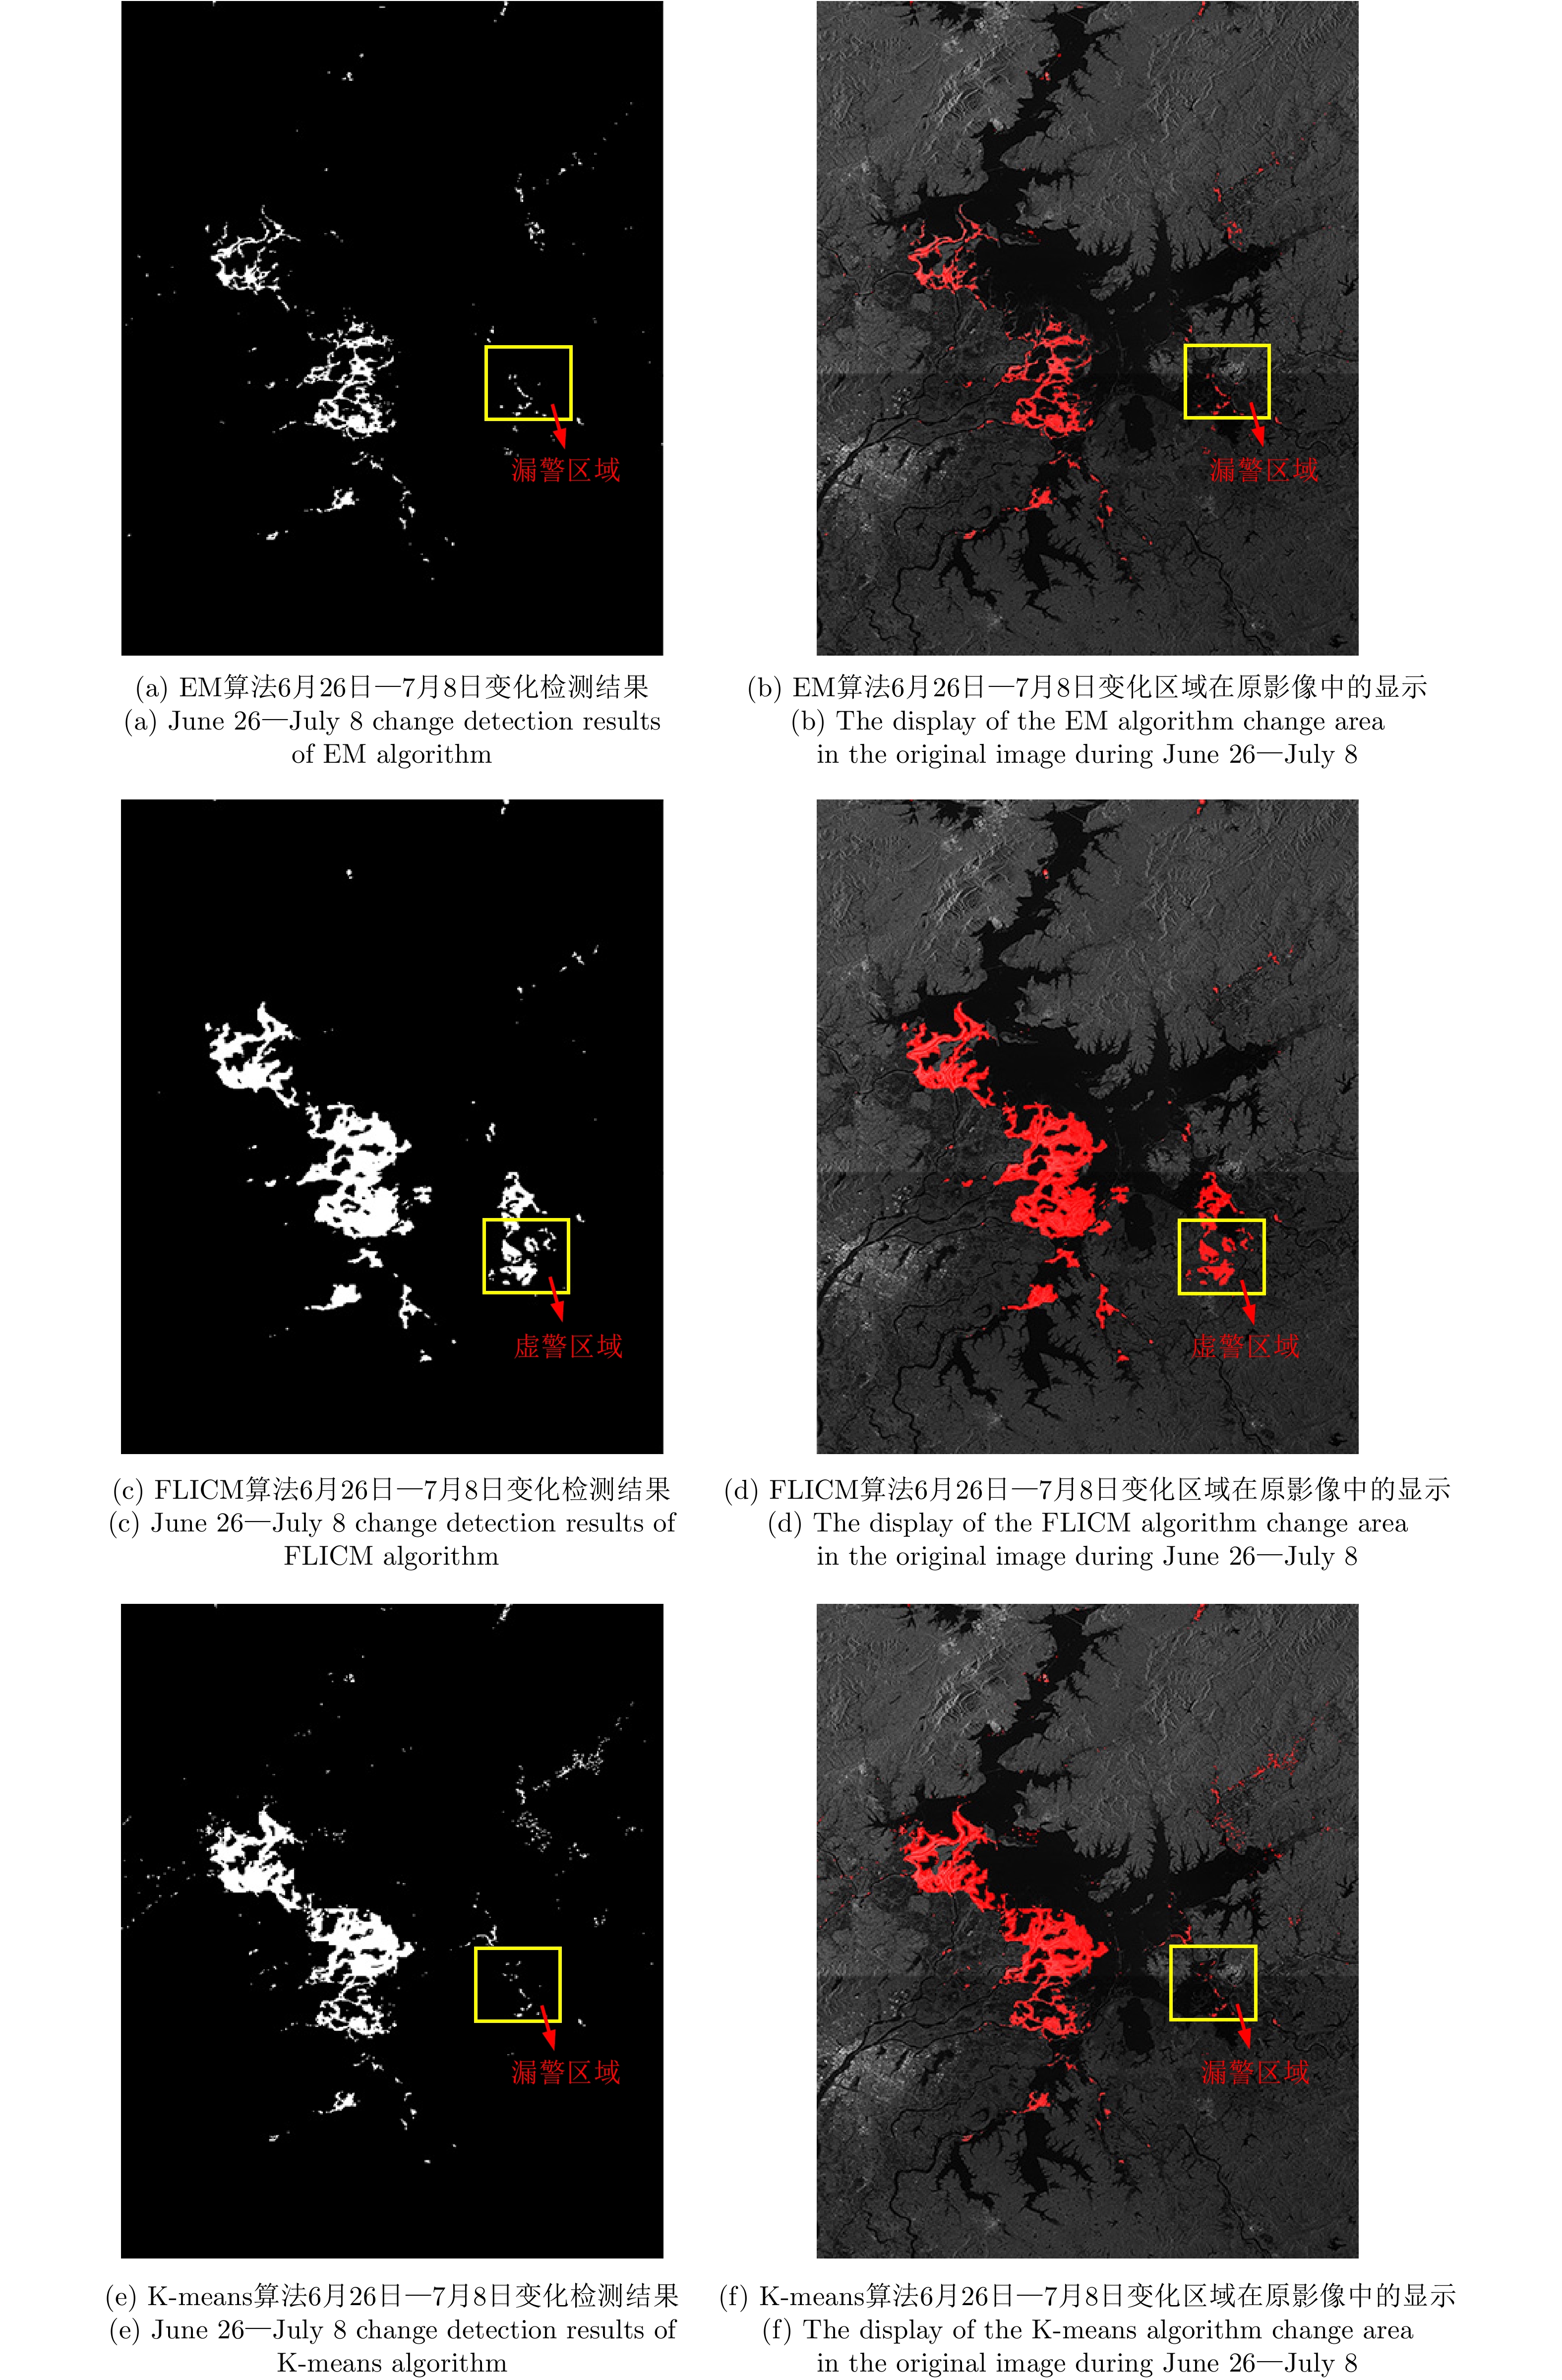
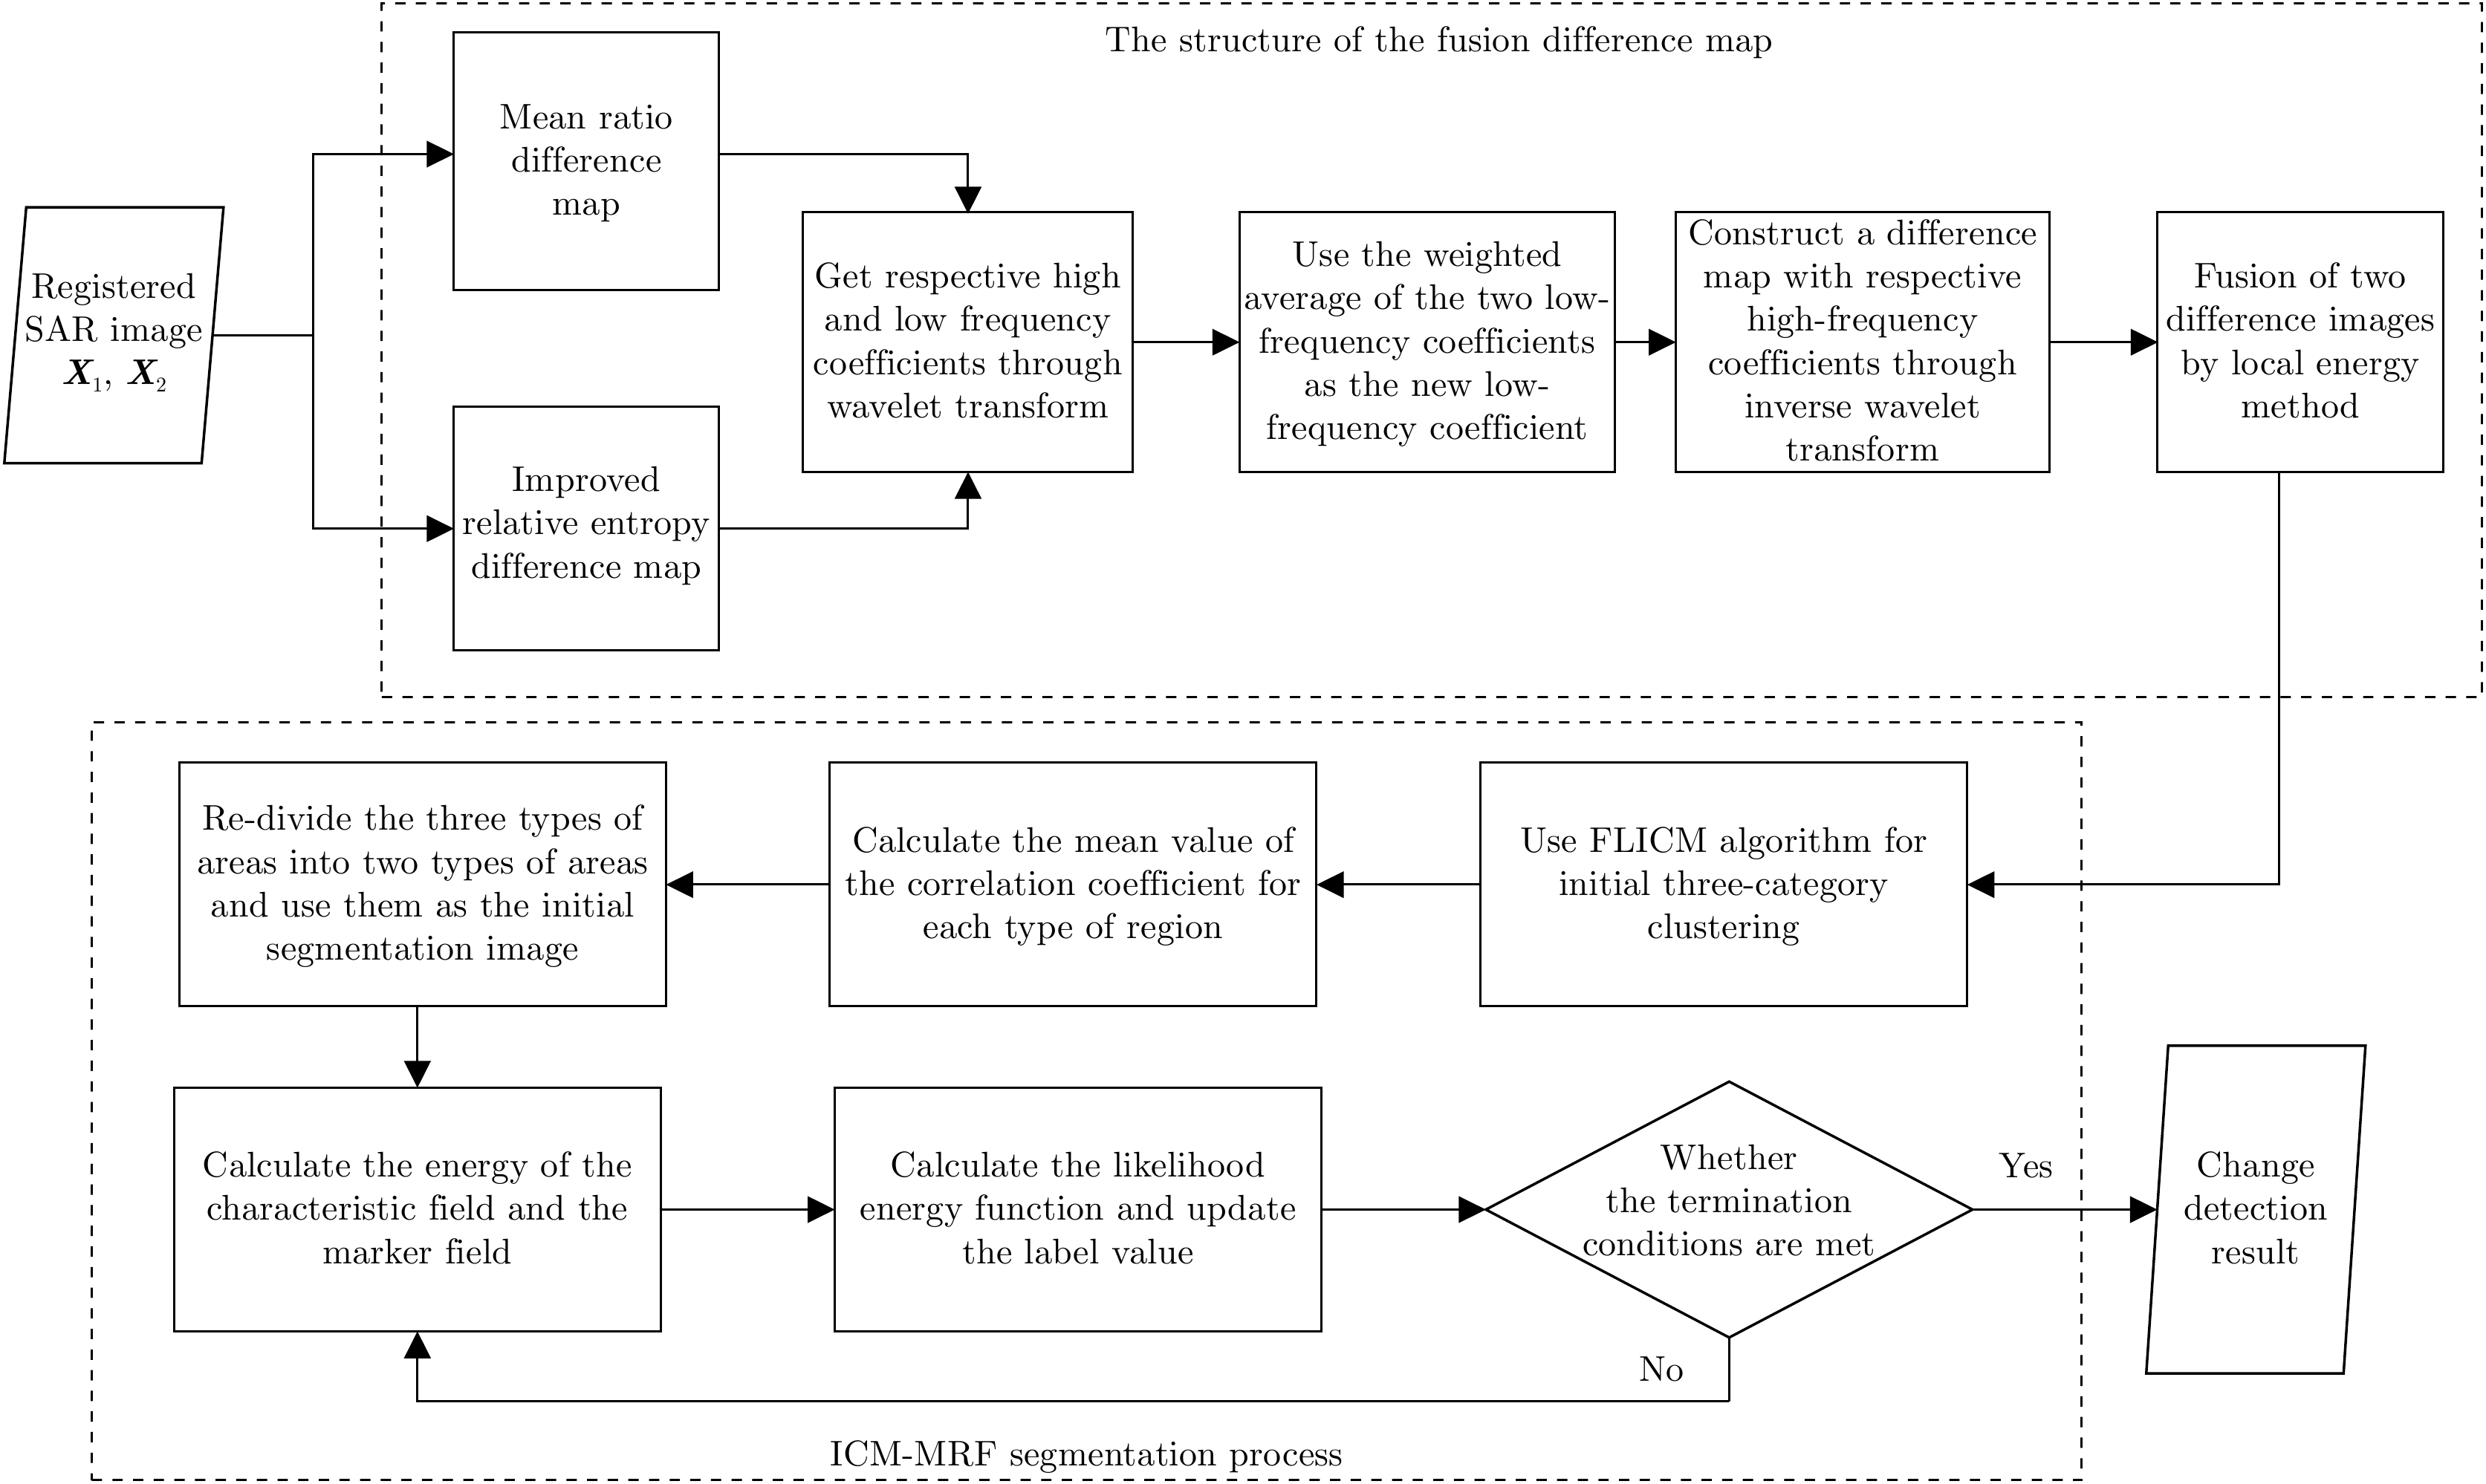
摘要: 由于洪灾区域的地物散射特性受环境影响会发生改变,在对该区域合成孔径雷达(SAR)图像进行变化检测时会使检测结果的错误率提高,而且用单一方法得到的差异图变化检测结果精度较低。针对上述问题,该文提出一种基于融合差异图的变化检测方法,该方法通过构造基于改进相对熵与均值比的融合差异图,综合了熵值差异图的区域敏感性和均值差异图的区域保持性的优势。首先,利用皮尔逊相关系数对模糊局部信息C均值聚类(FLICM)方法的初始聚类结果进行二次分类,再将二次分类结果作为图像初始分割,最后利用迭代条件模型和马尔科夫随机场(ICM-MRF)获得图像的最终分割结果。为了验证所提方法的有效性,该文使用瑞士Bern地区在1999年4月和5月的ERS-2遥感数据以及加拿大Ottawa地区在1997年5月和8月的Radarsat遥感数据进行实验,并用该方法对中国鄱阳湖地区2020年6月和7月的Sentinel-1-A遥感数据进行了洪灾检测实验,估计了鄱阳湖附近区域洪灾前后的受灾范围和变化趋势。实验结果表明该文算法总体检测误差较低,一定程度上降低了检测结果的错误率,提高了检测结果的精度。
-
关键词:
- SAR图像 /
- 变化检测 /
- 无监督 /
- 改进相对熵 /
- 迭代条件模型和马尔科夫随机场
Abstract: Due to the influence of the environment on the scattering characteristics of ground objects in flooded areas, the false error rate of the detection results increases when performing change detection on Synthetic Aperture Radar (SAR) images of these areas, which reduces the accuracy of the results obtained for the difference map. To solve this problem, in this paper, we propose a change-detection method based on a fusion difference map. This method combines the regional sensitivity of the entropy difference map with the regional retention of the mean difference map to construct a fusion difference map based on an improved relative entropy and mean value ratio. First, the initial clustering results of the fuzzy local information C-means clustering method are classified by their Pearson correlation coefficients, and second, the secondary classification results are used for the initial image segmentation. Third, the final segmentation results are obtained using the iterative condition model and Markov random field. To verify the flood-disaster-detection performance of the proposed method, we used the second of Europe Remote-Sensing (ERS-2) Satellite data obtained for the Bern area in Switzerland in April and May 1999 and Radarsat remote-sensing data for the Ottawa region in Canada in May and August 1997. We also applied the proposed method to data obtained for the Poyang Lake region of China in June and July 2020, and estimated the disaster area and change trend before and after the flood in Poyang Lake. The experimental results show that the algorithm had a low overall detection error, the false error rate of the detection results were somewhat reduced, and the accuracy of the detection results was improved. -
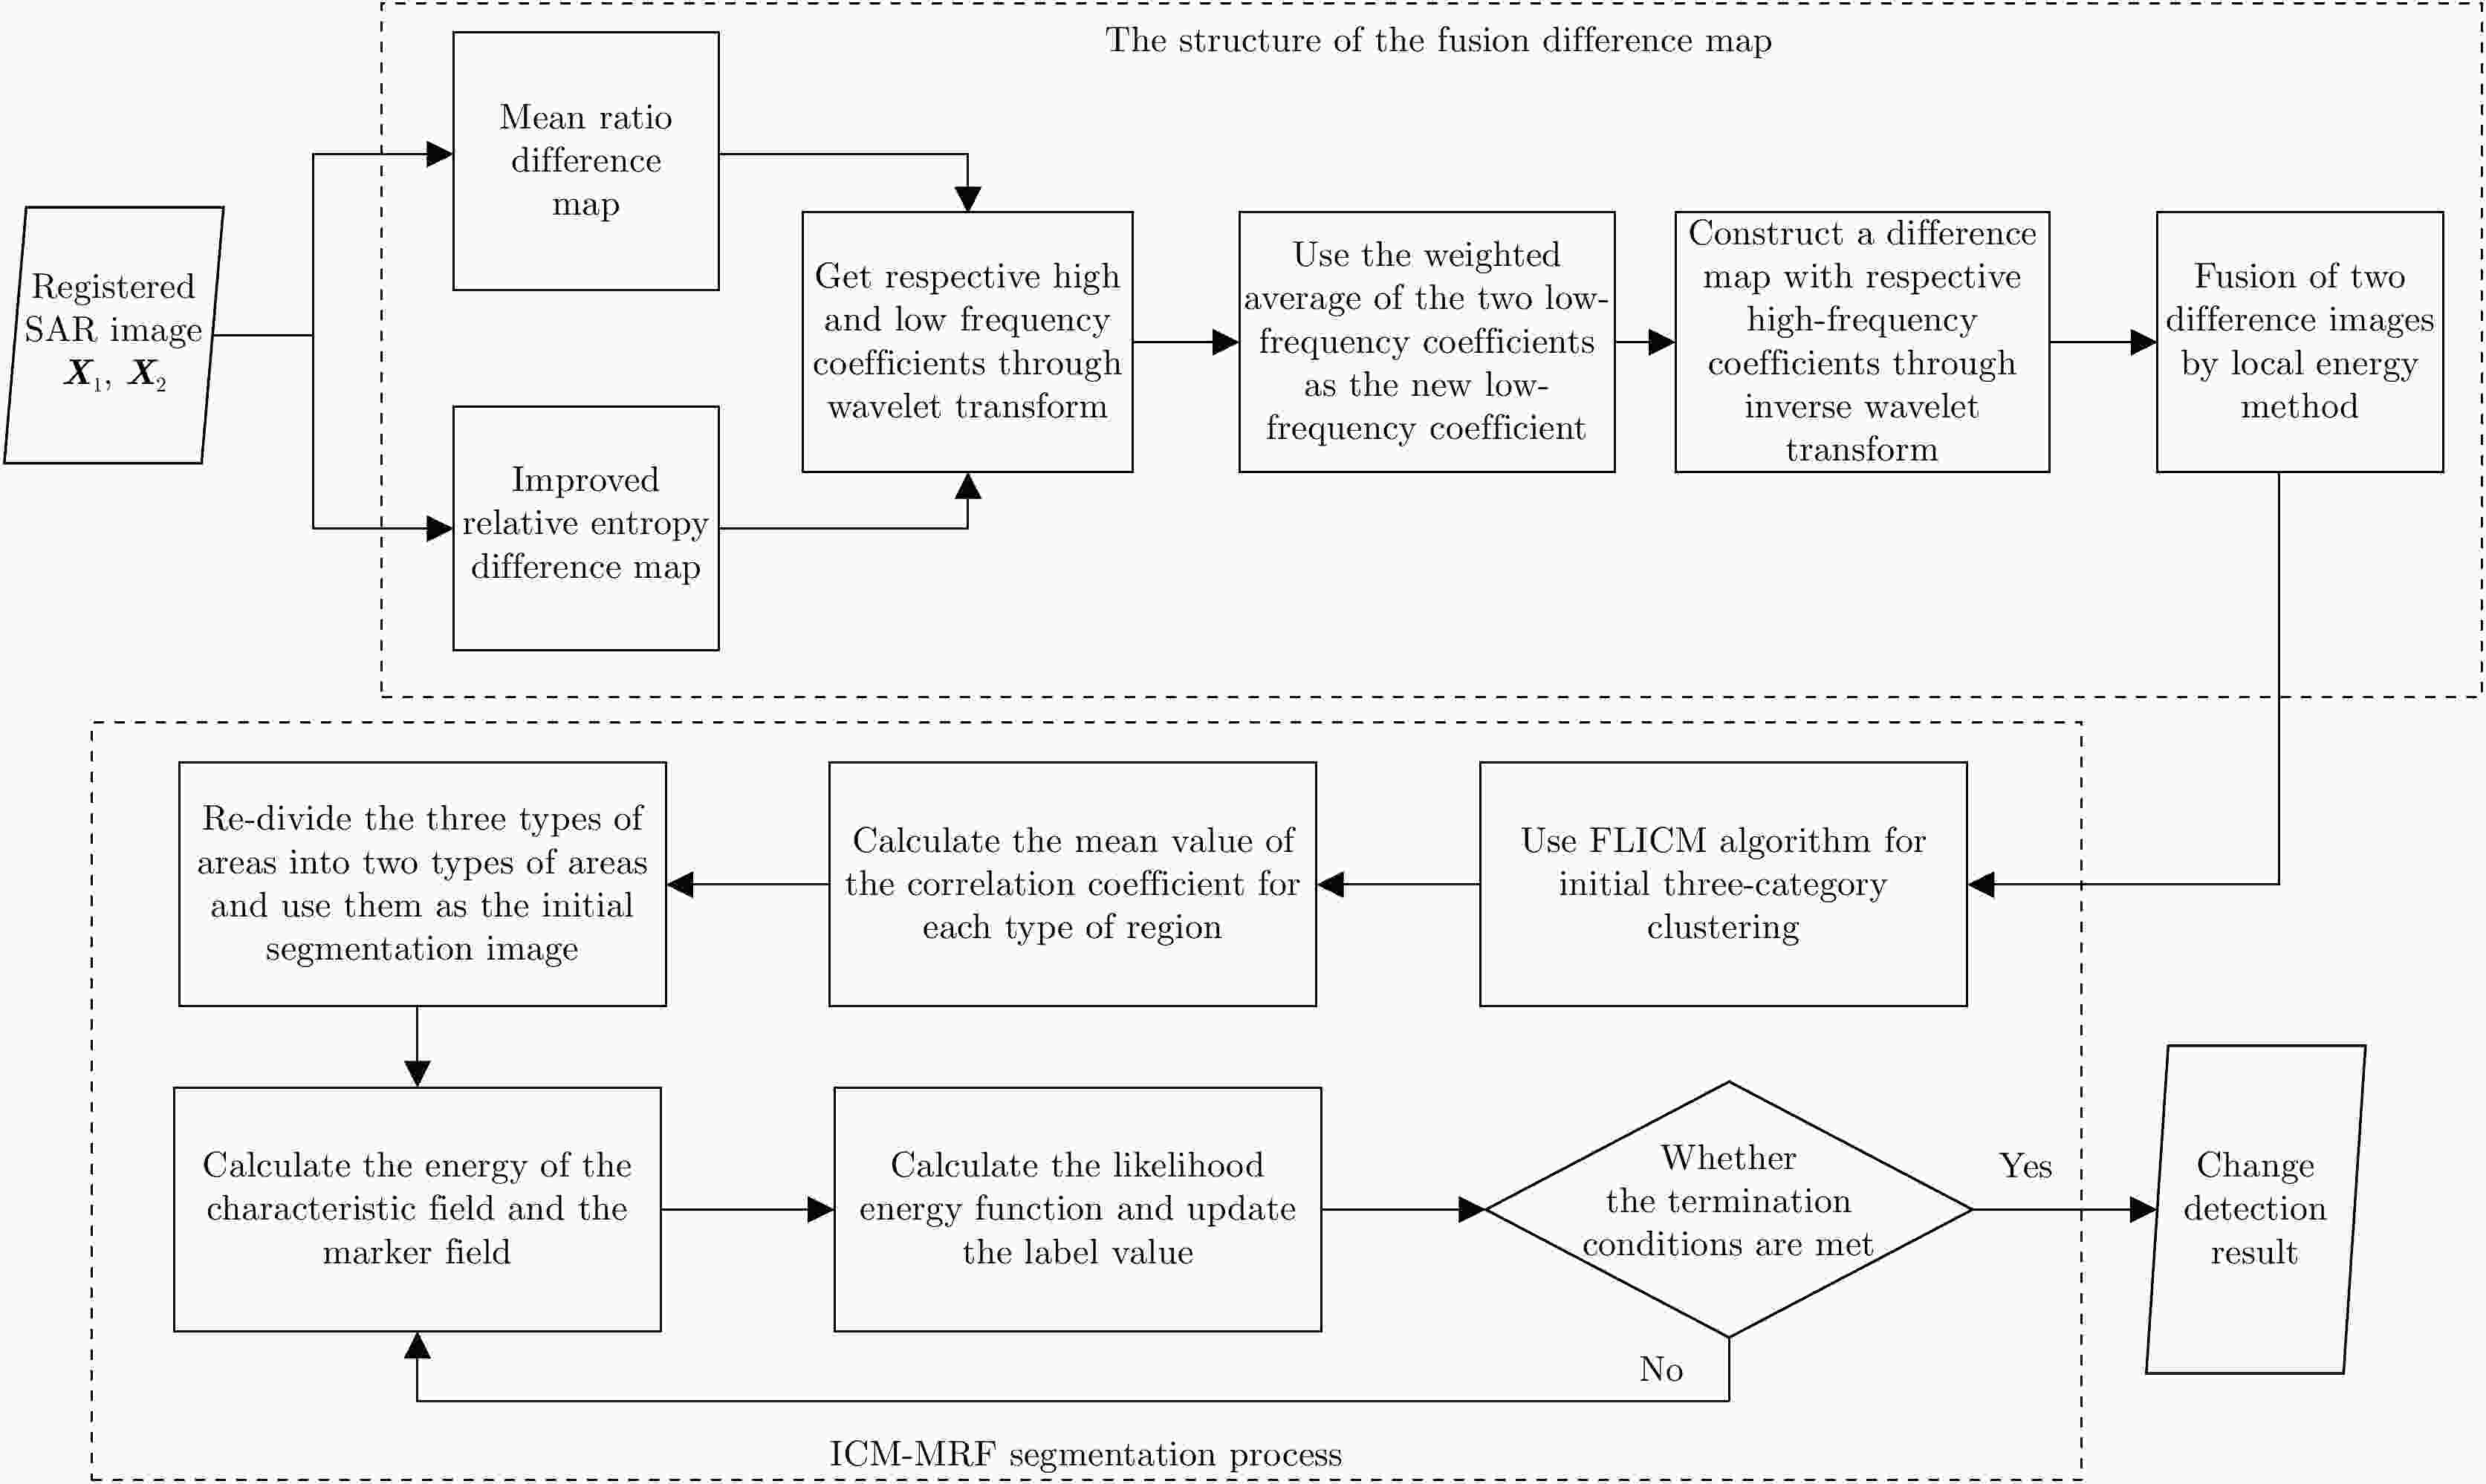
图 1 基于融合差异图的变化检测算法流程图
Figure 1. Flow chart of change detection algorithm in this paper
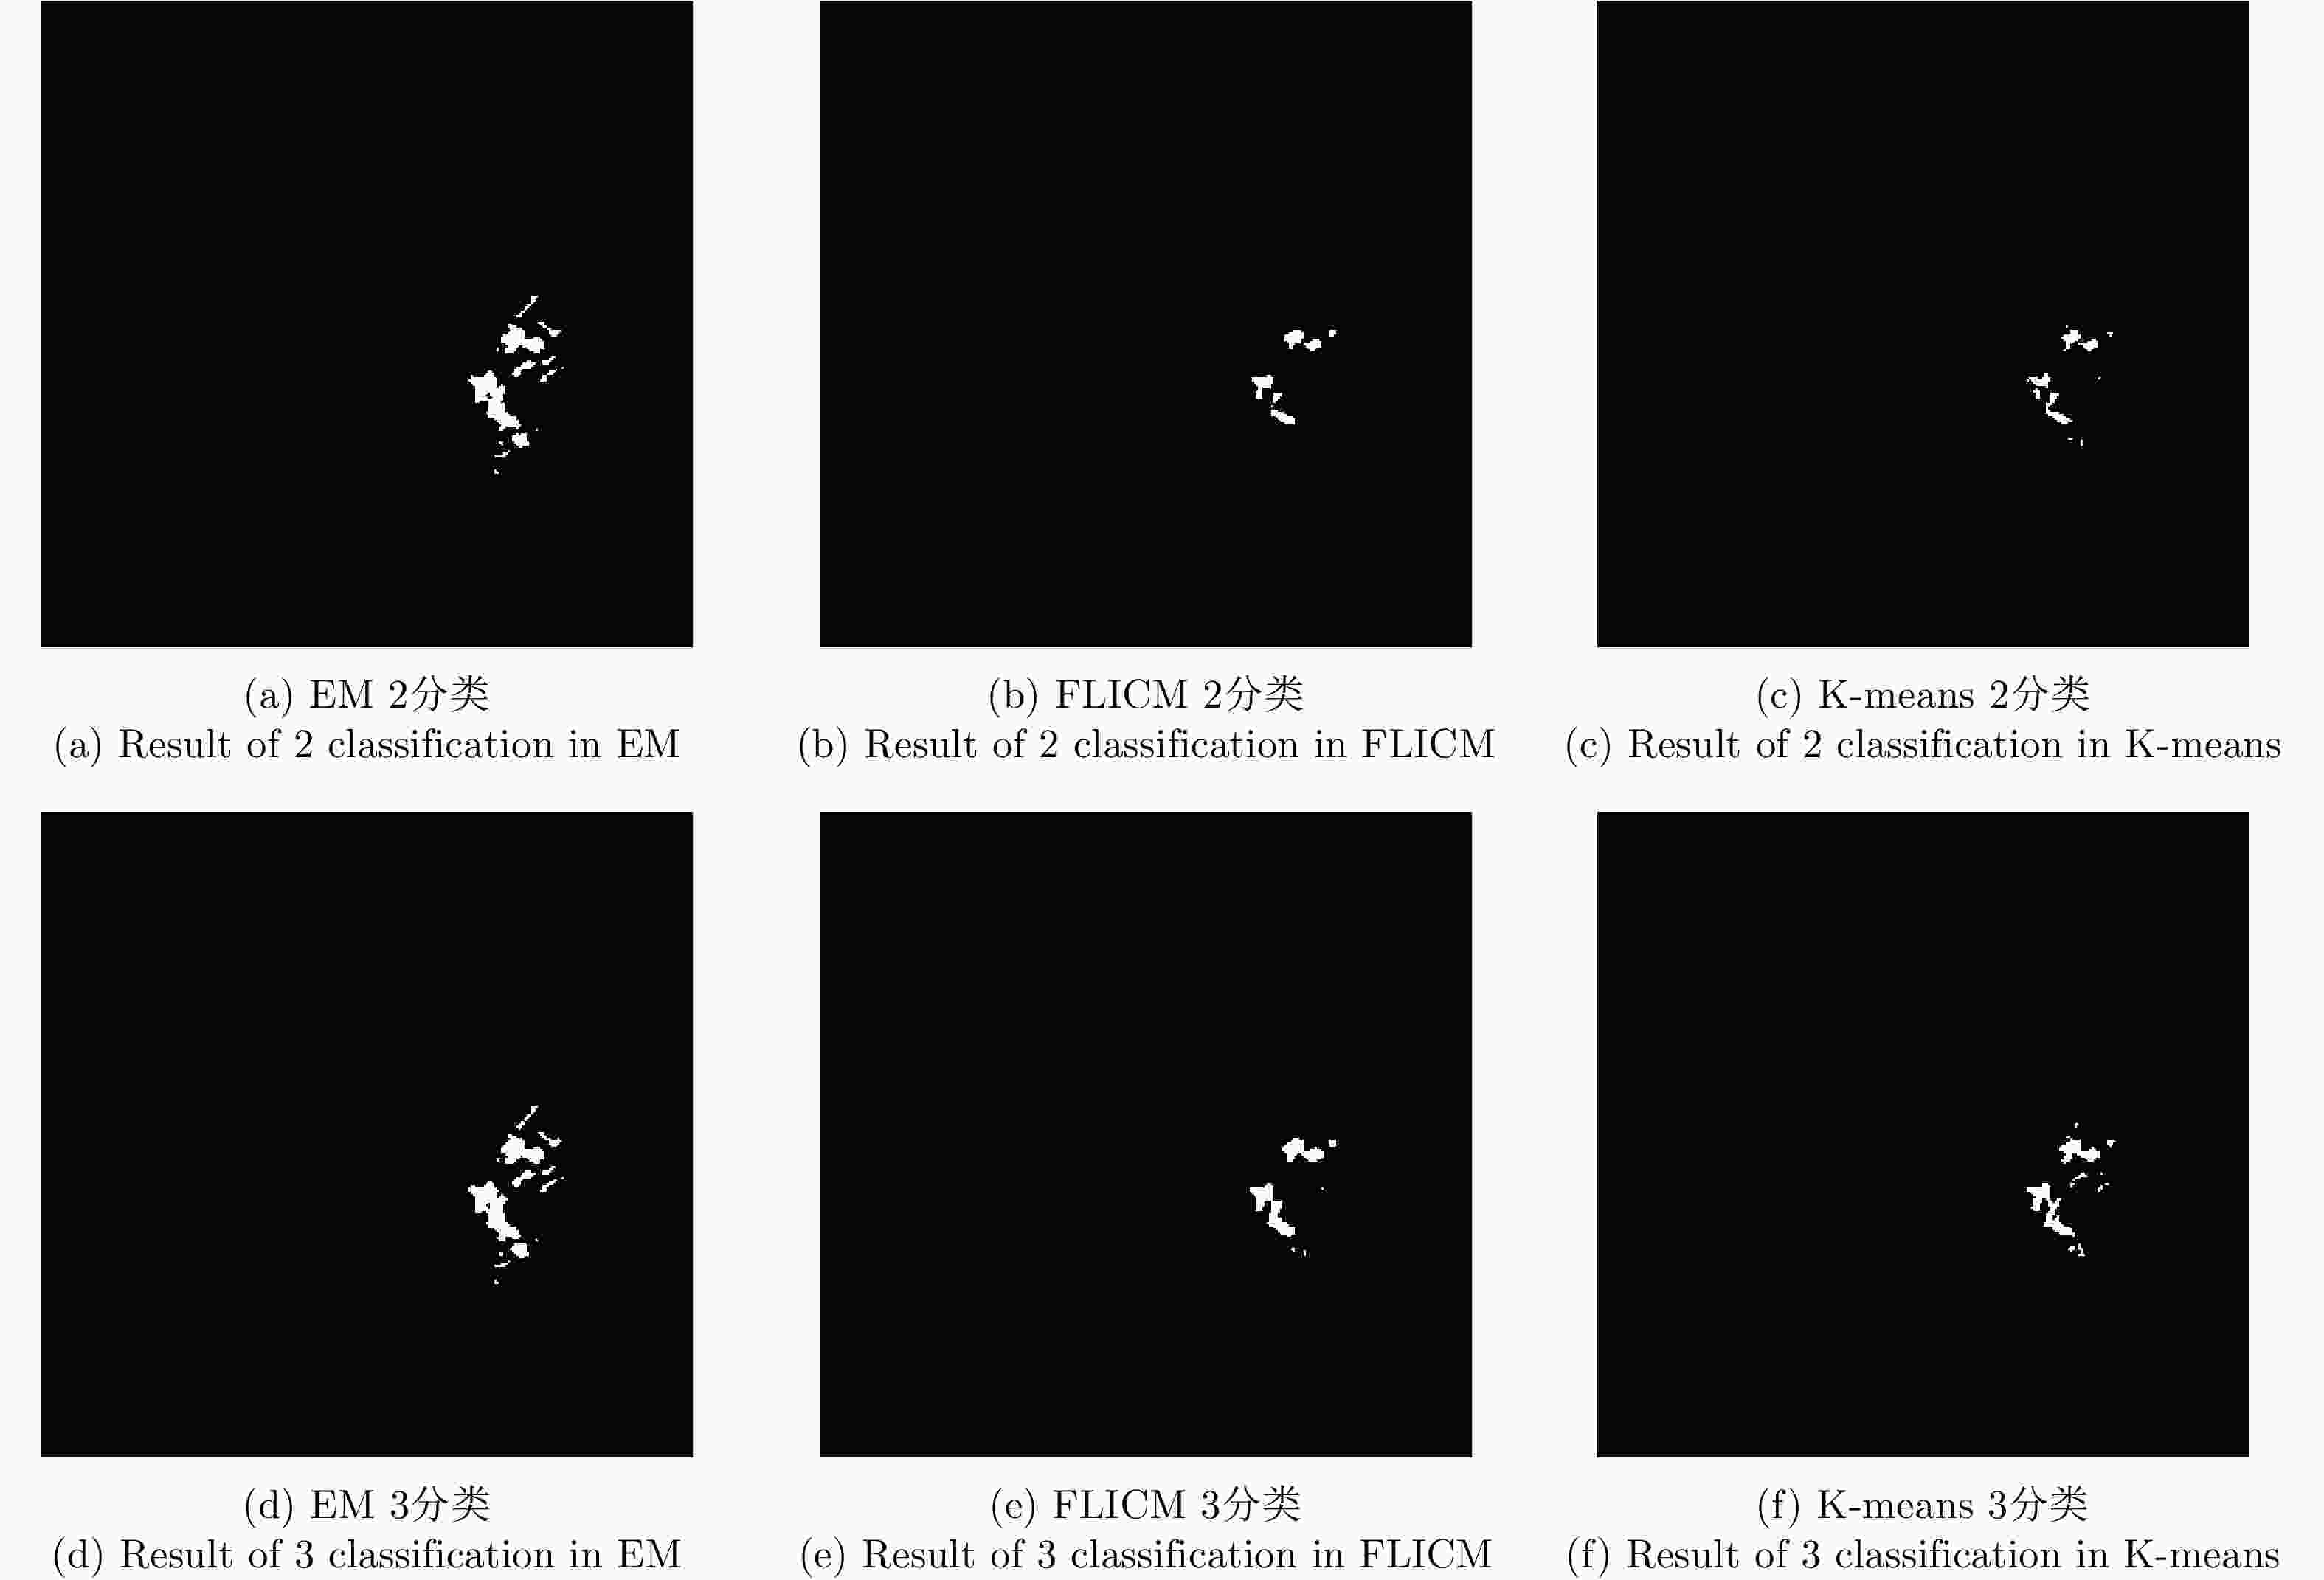
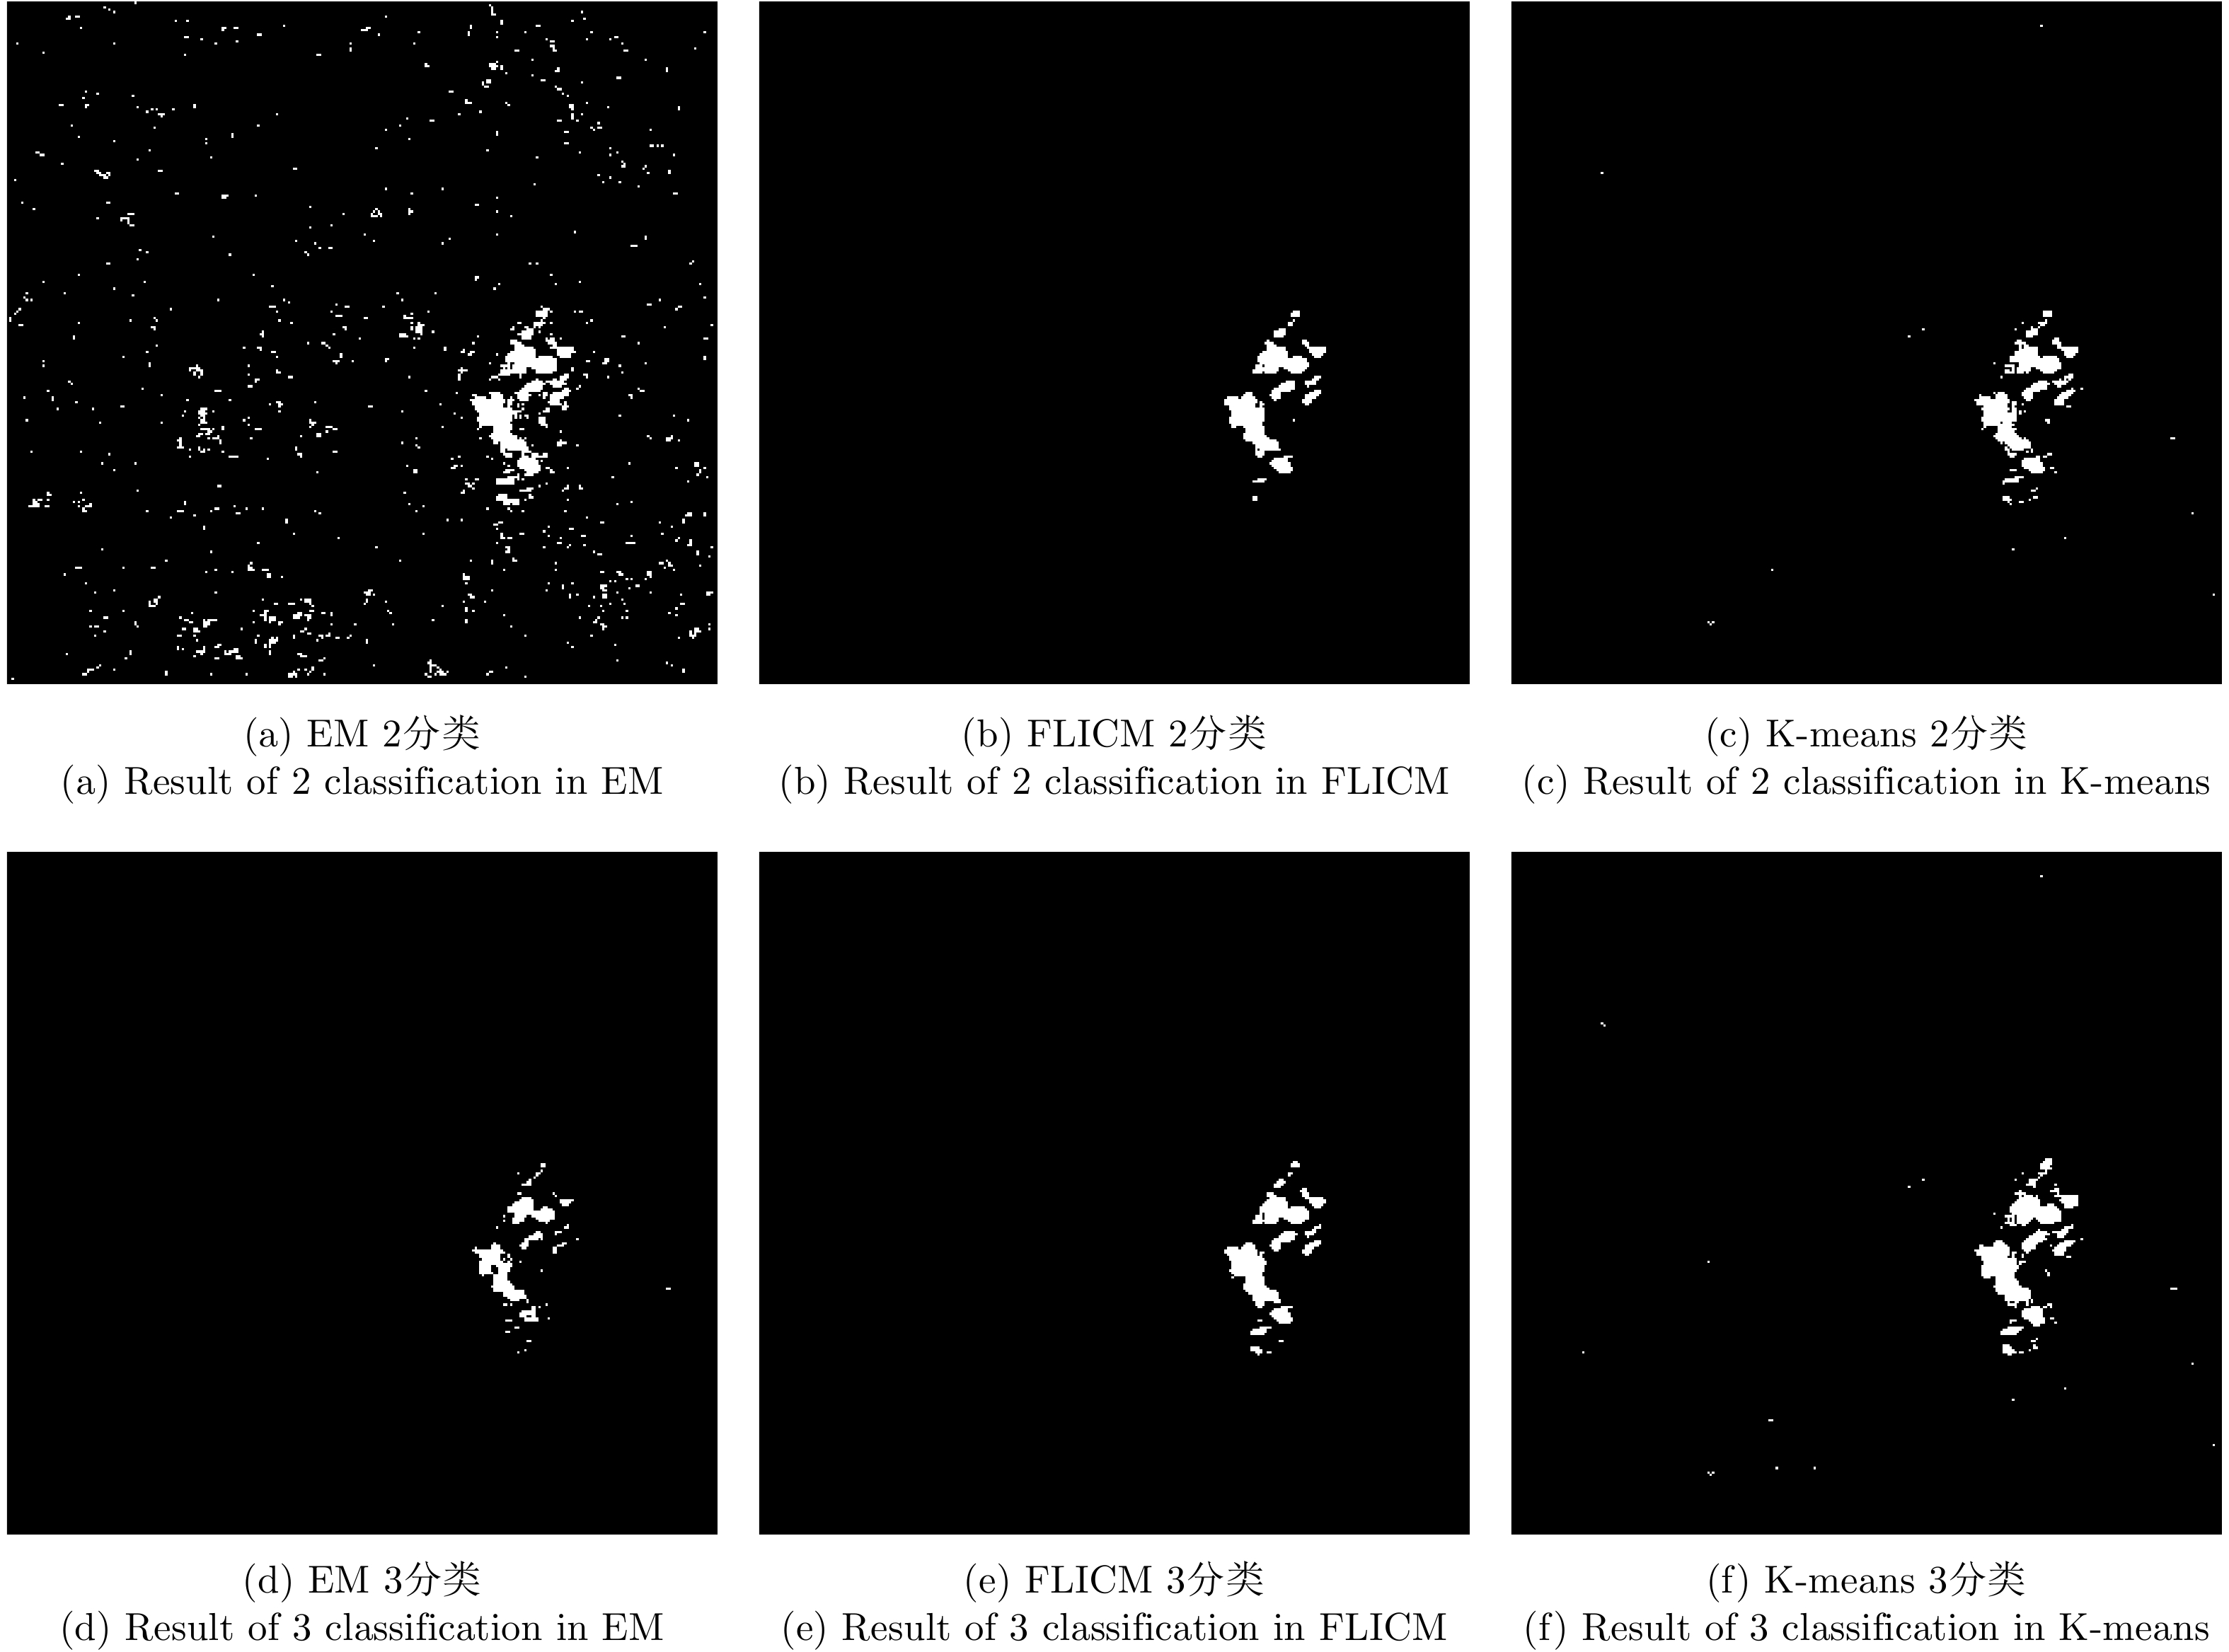
图 5 基于均值比差异图2分类和3分类后二次分类结果
Figure 5. Based on the difference map in mean ratio 2 and 3 classification results after secondary classification
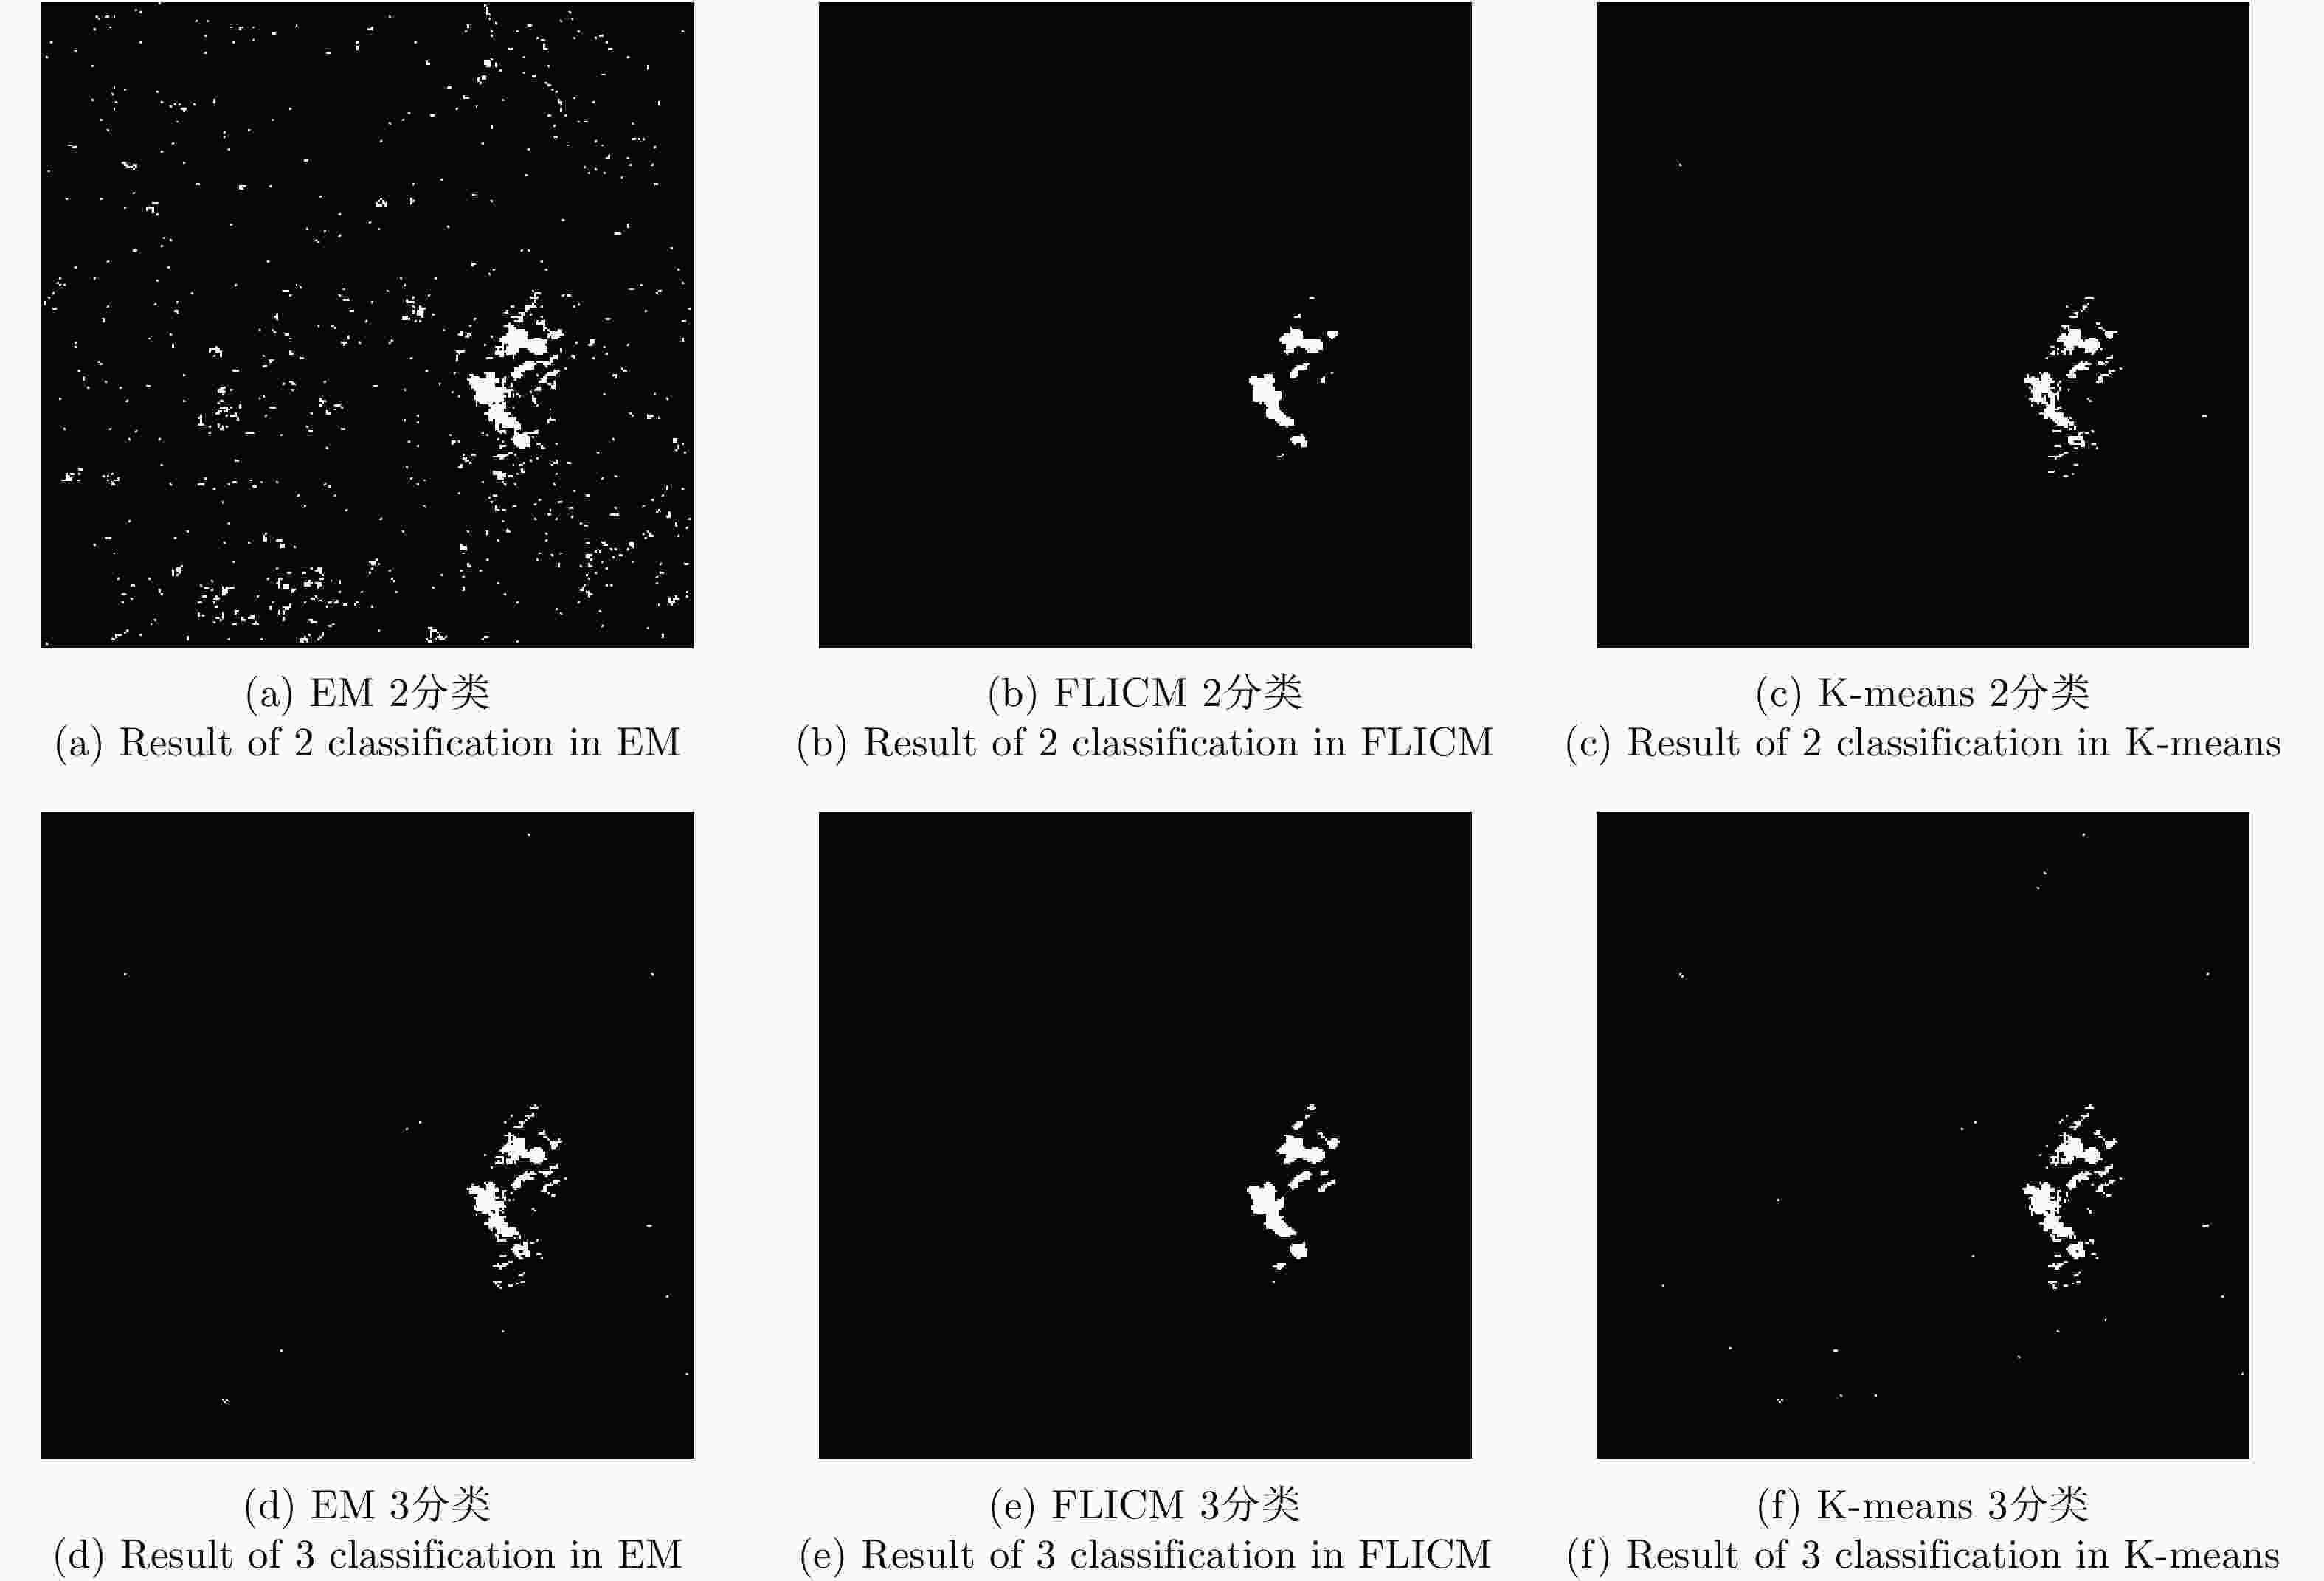
图 6 基于相对熵差异图2分类和3分类后二次分类结果
Figure 6. Based on the difference map in relative entropy 2 and 3 classification results after secondary classification
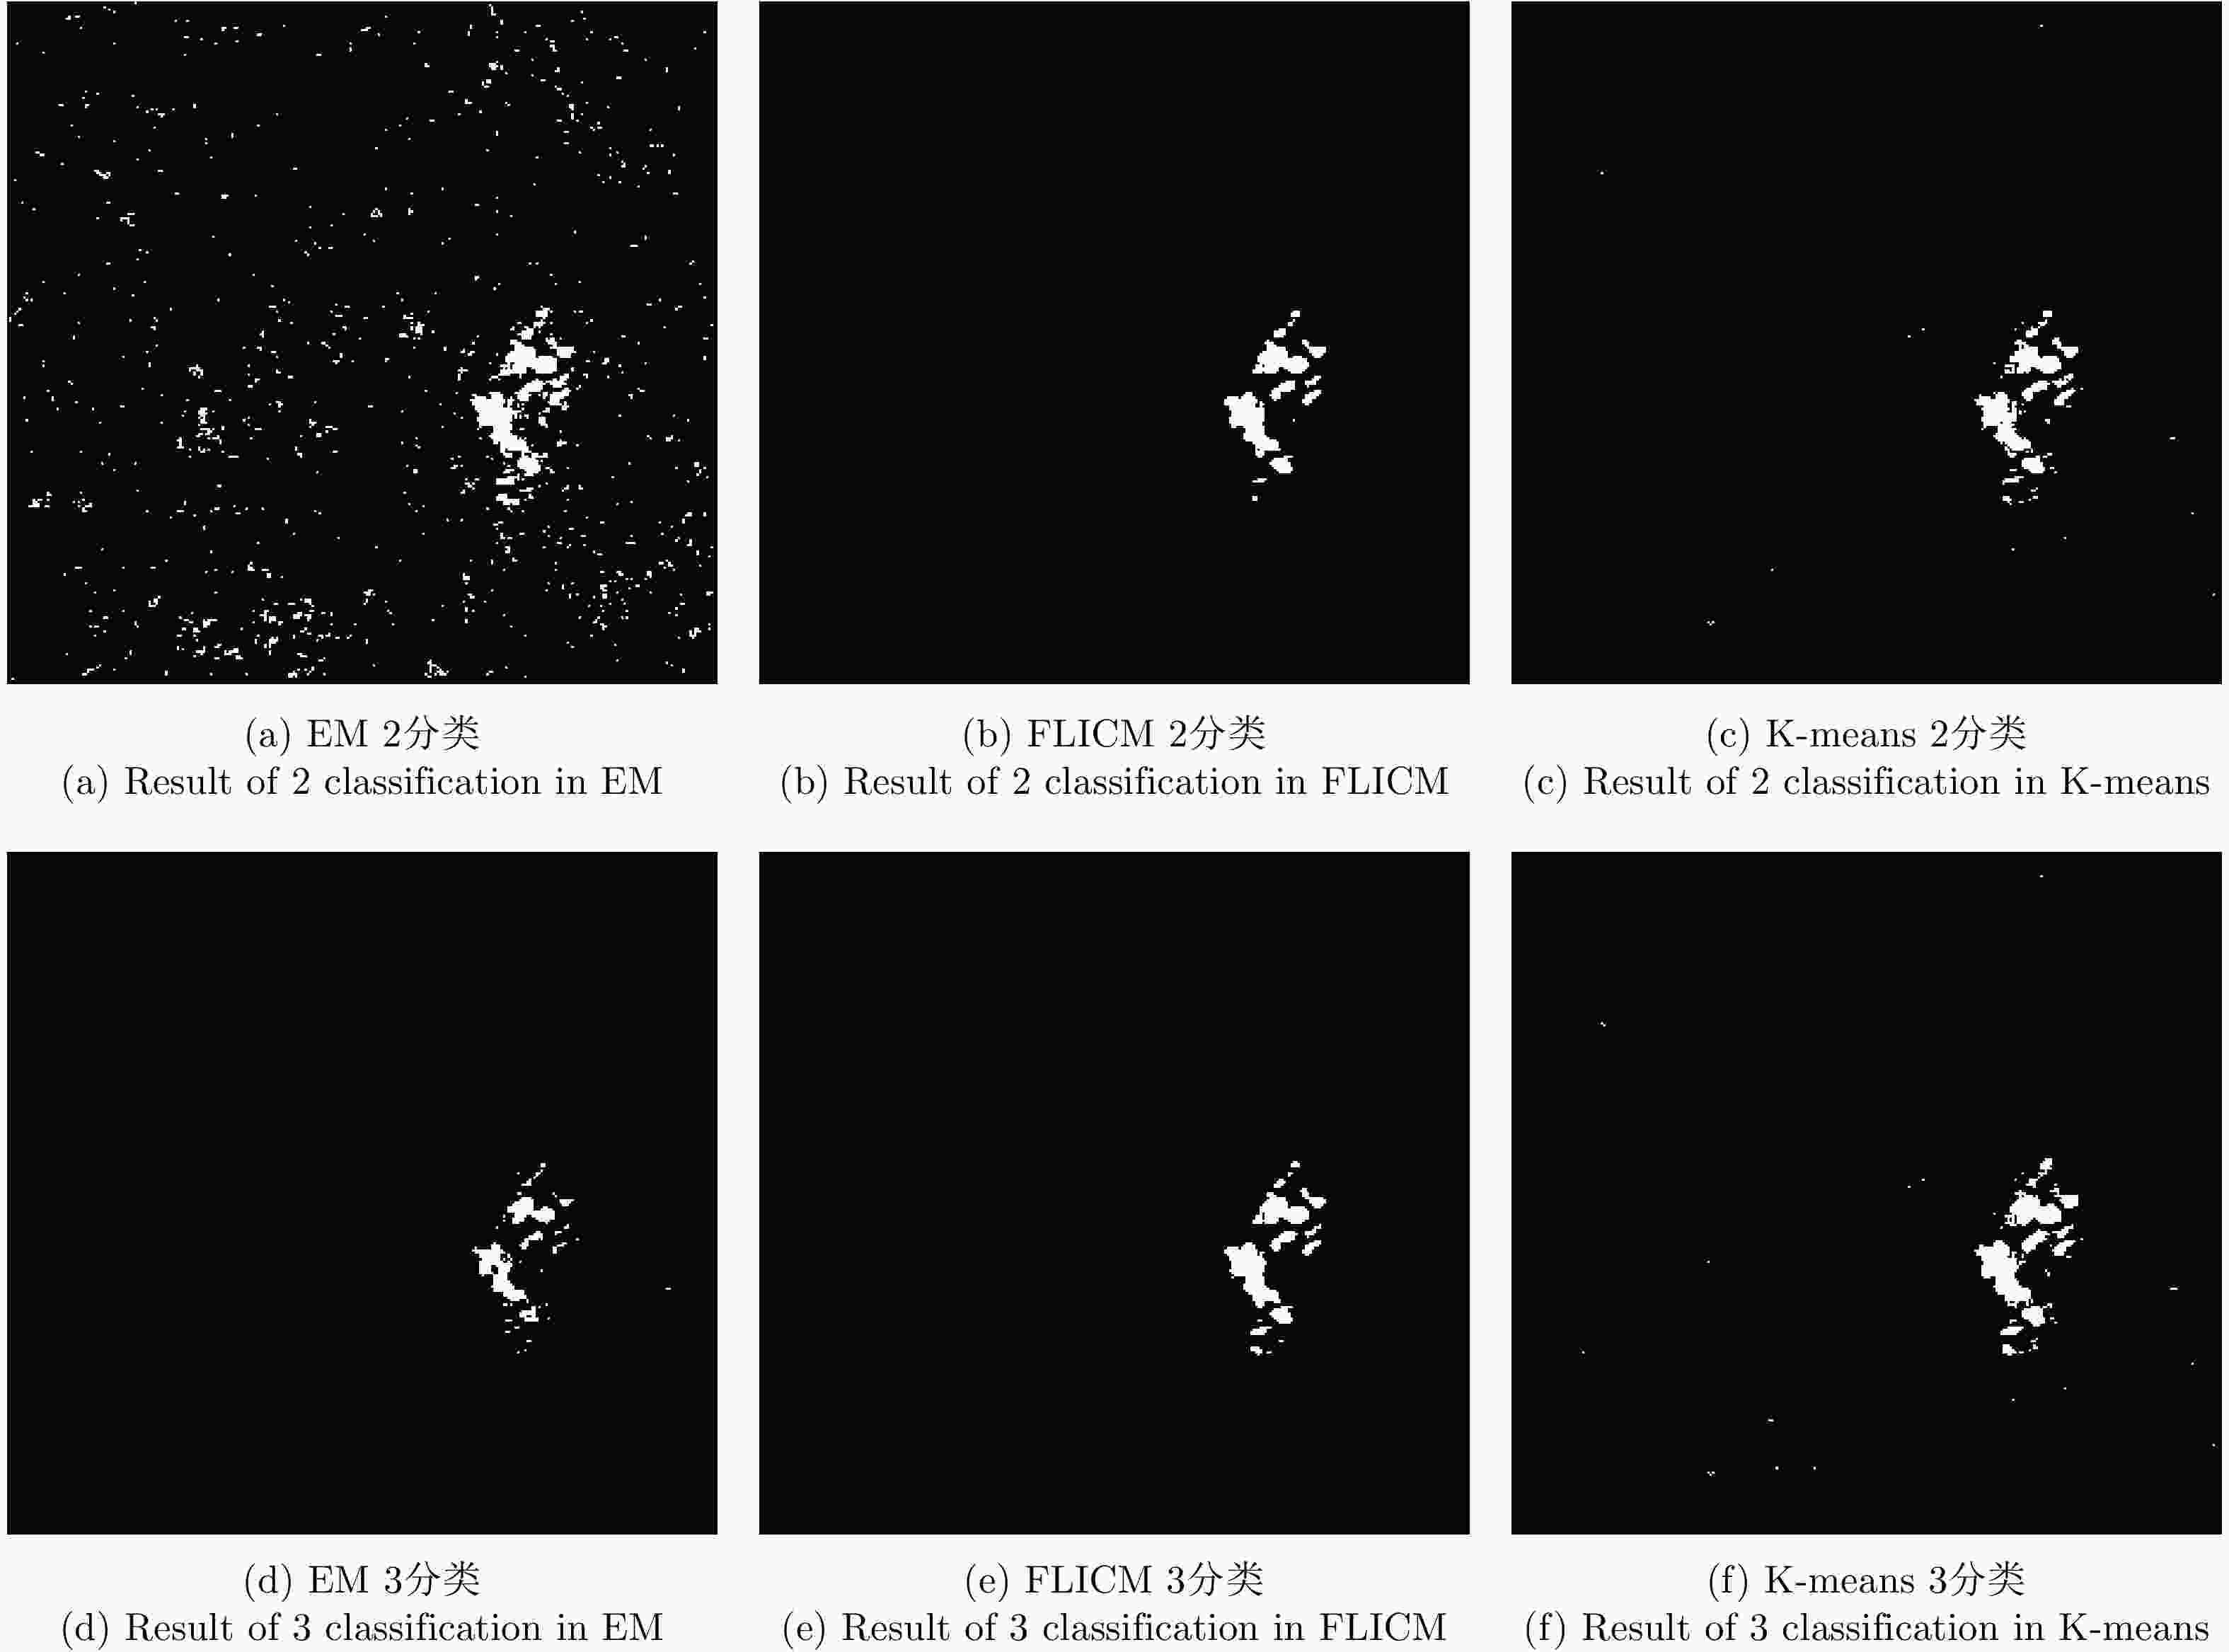
图 7 基于融合差异图2分类和3分类后二次分类结果
Figure 7. Based on the fusion difference and the results of secondary classification after classification 2 and 3
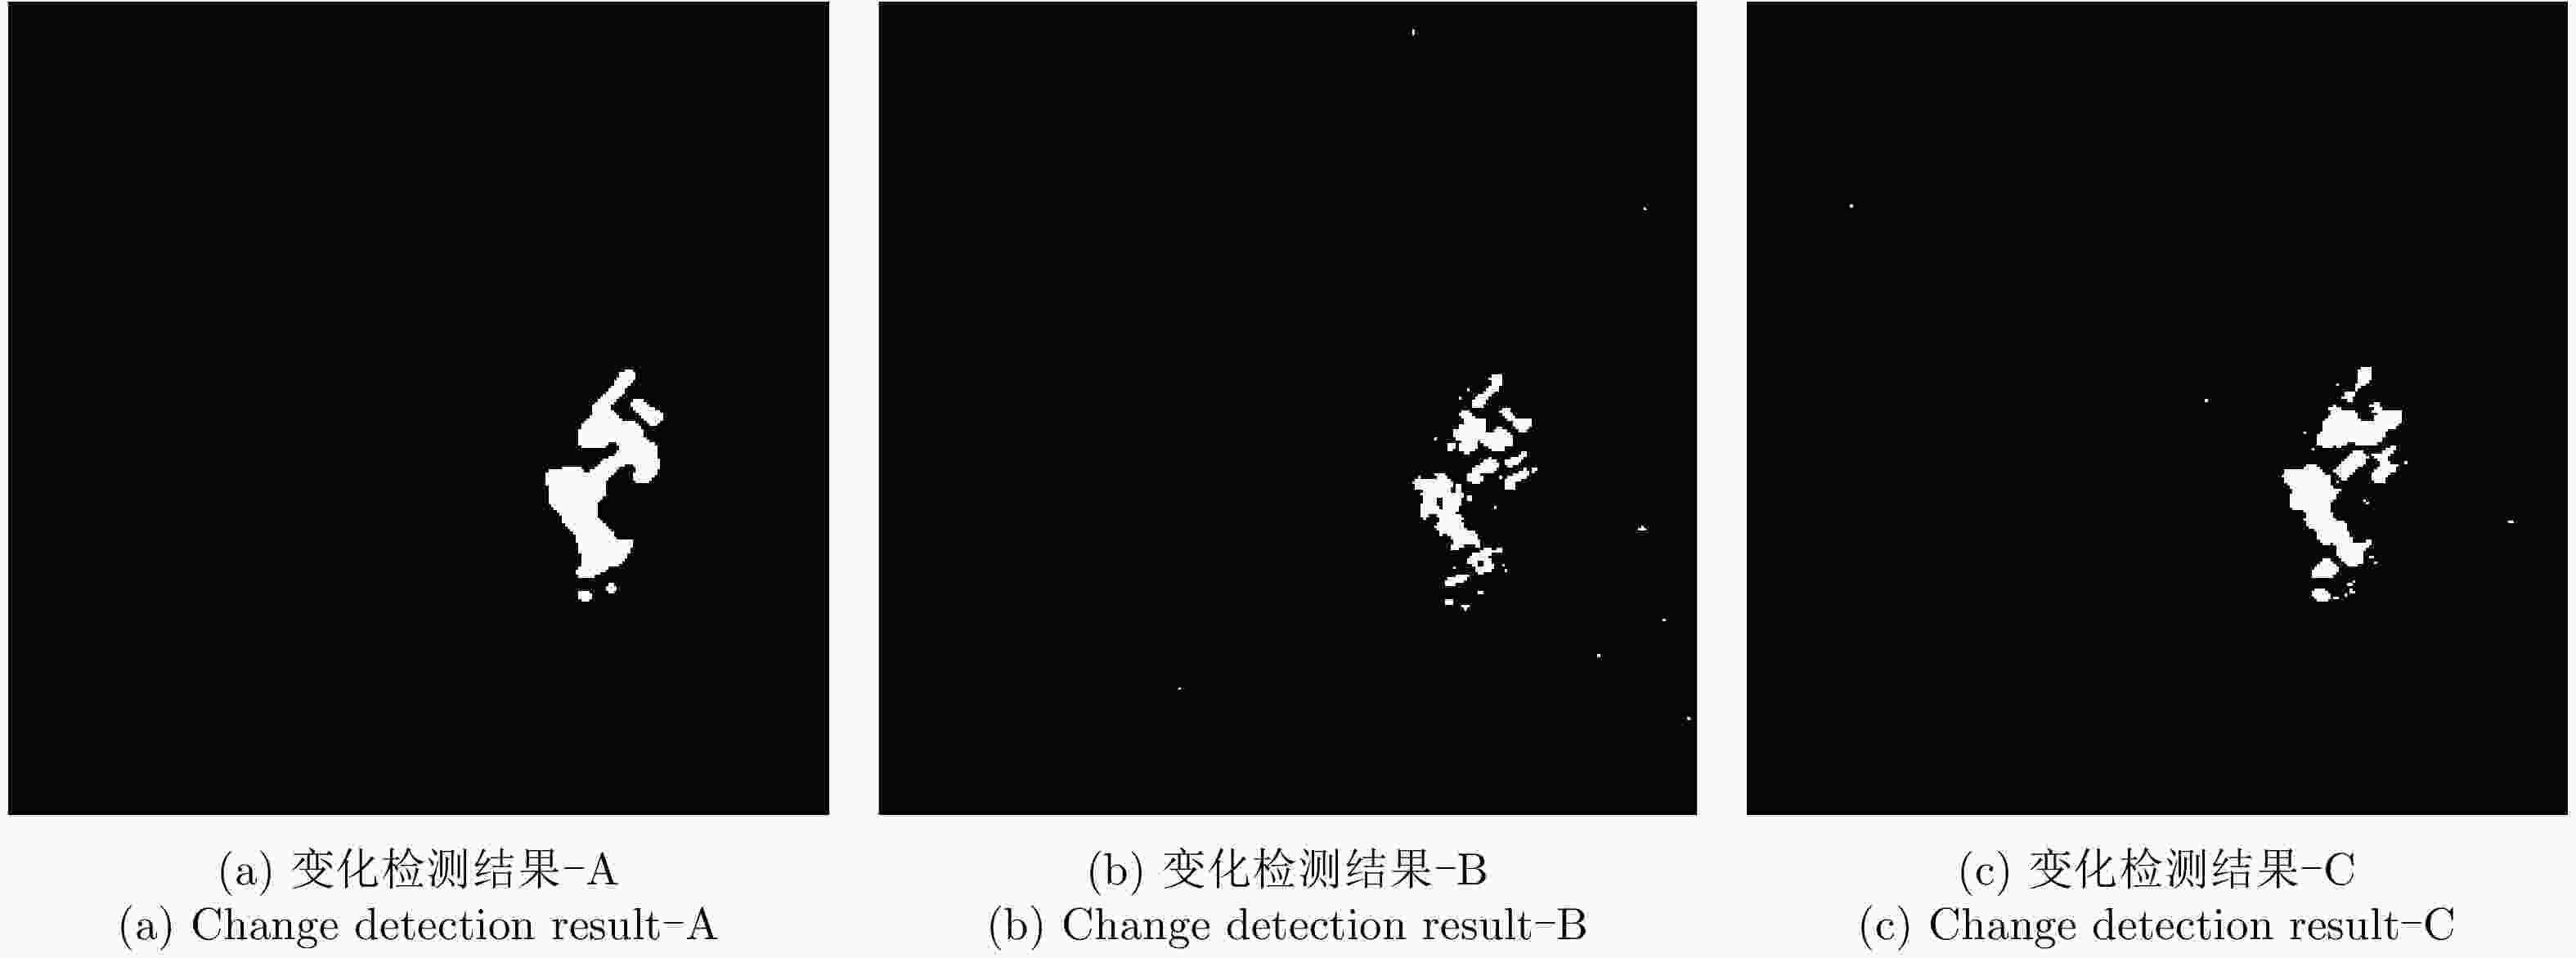
图 8 Bern数据本文ICM-MRF算法变化检测结果
Figure 8. Change detection results of this paper algorithm in Bern data
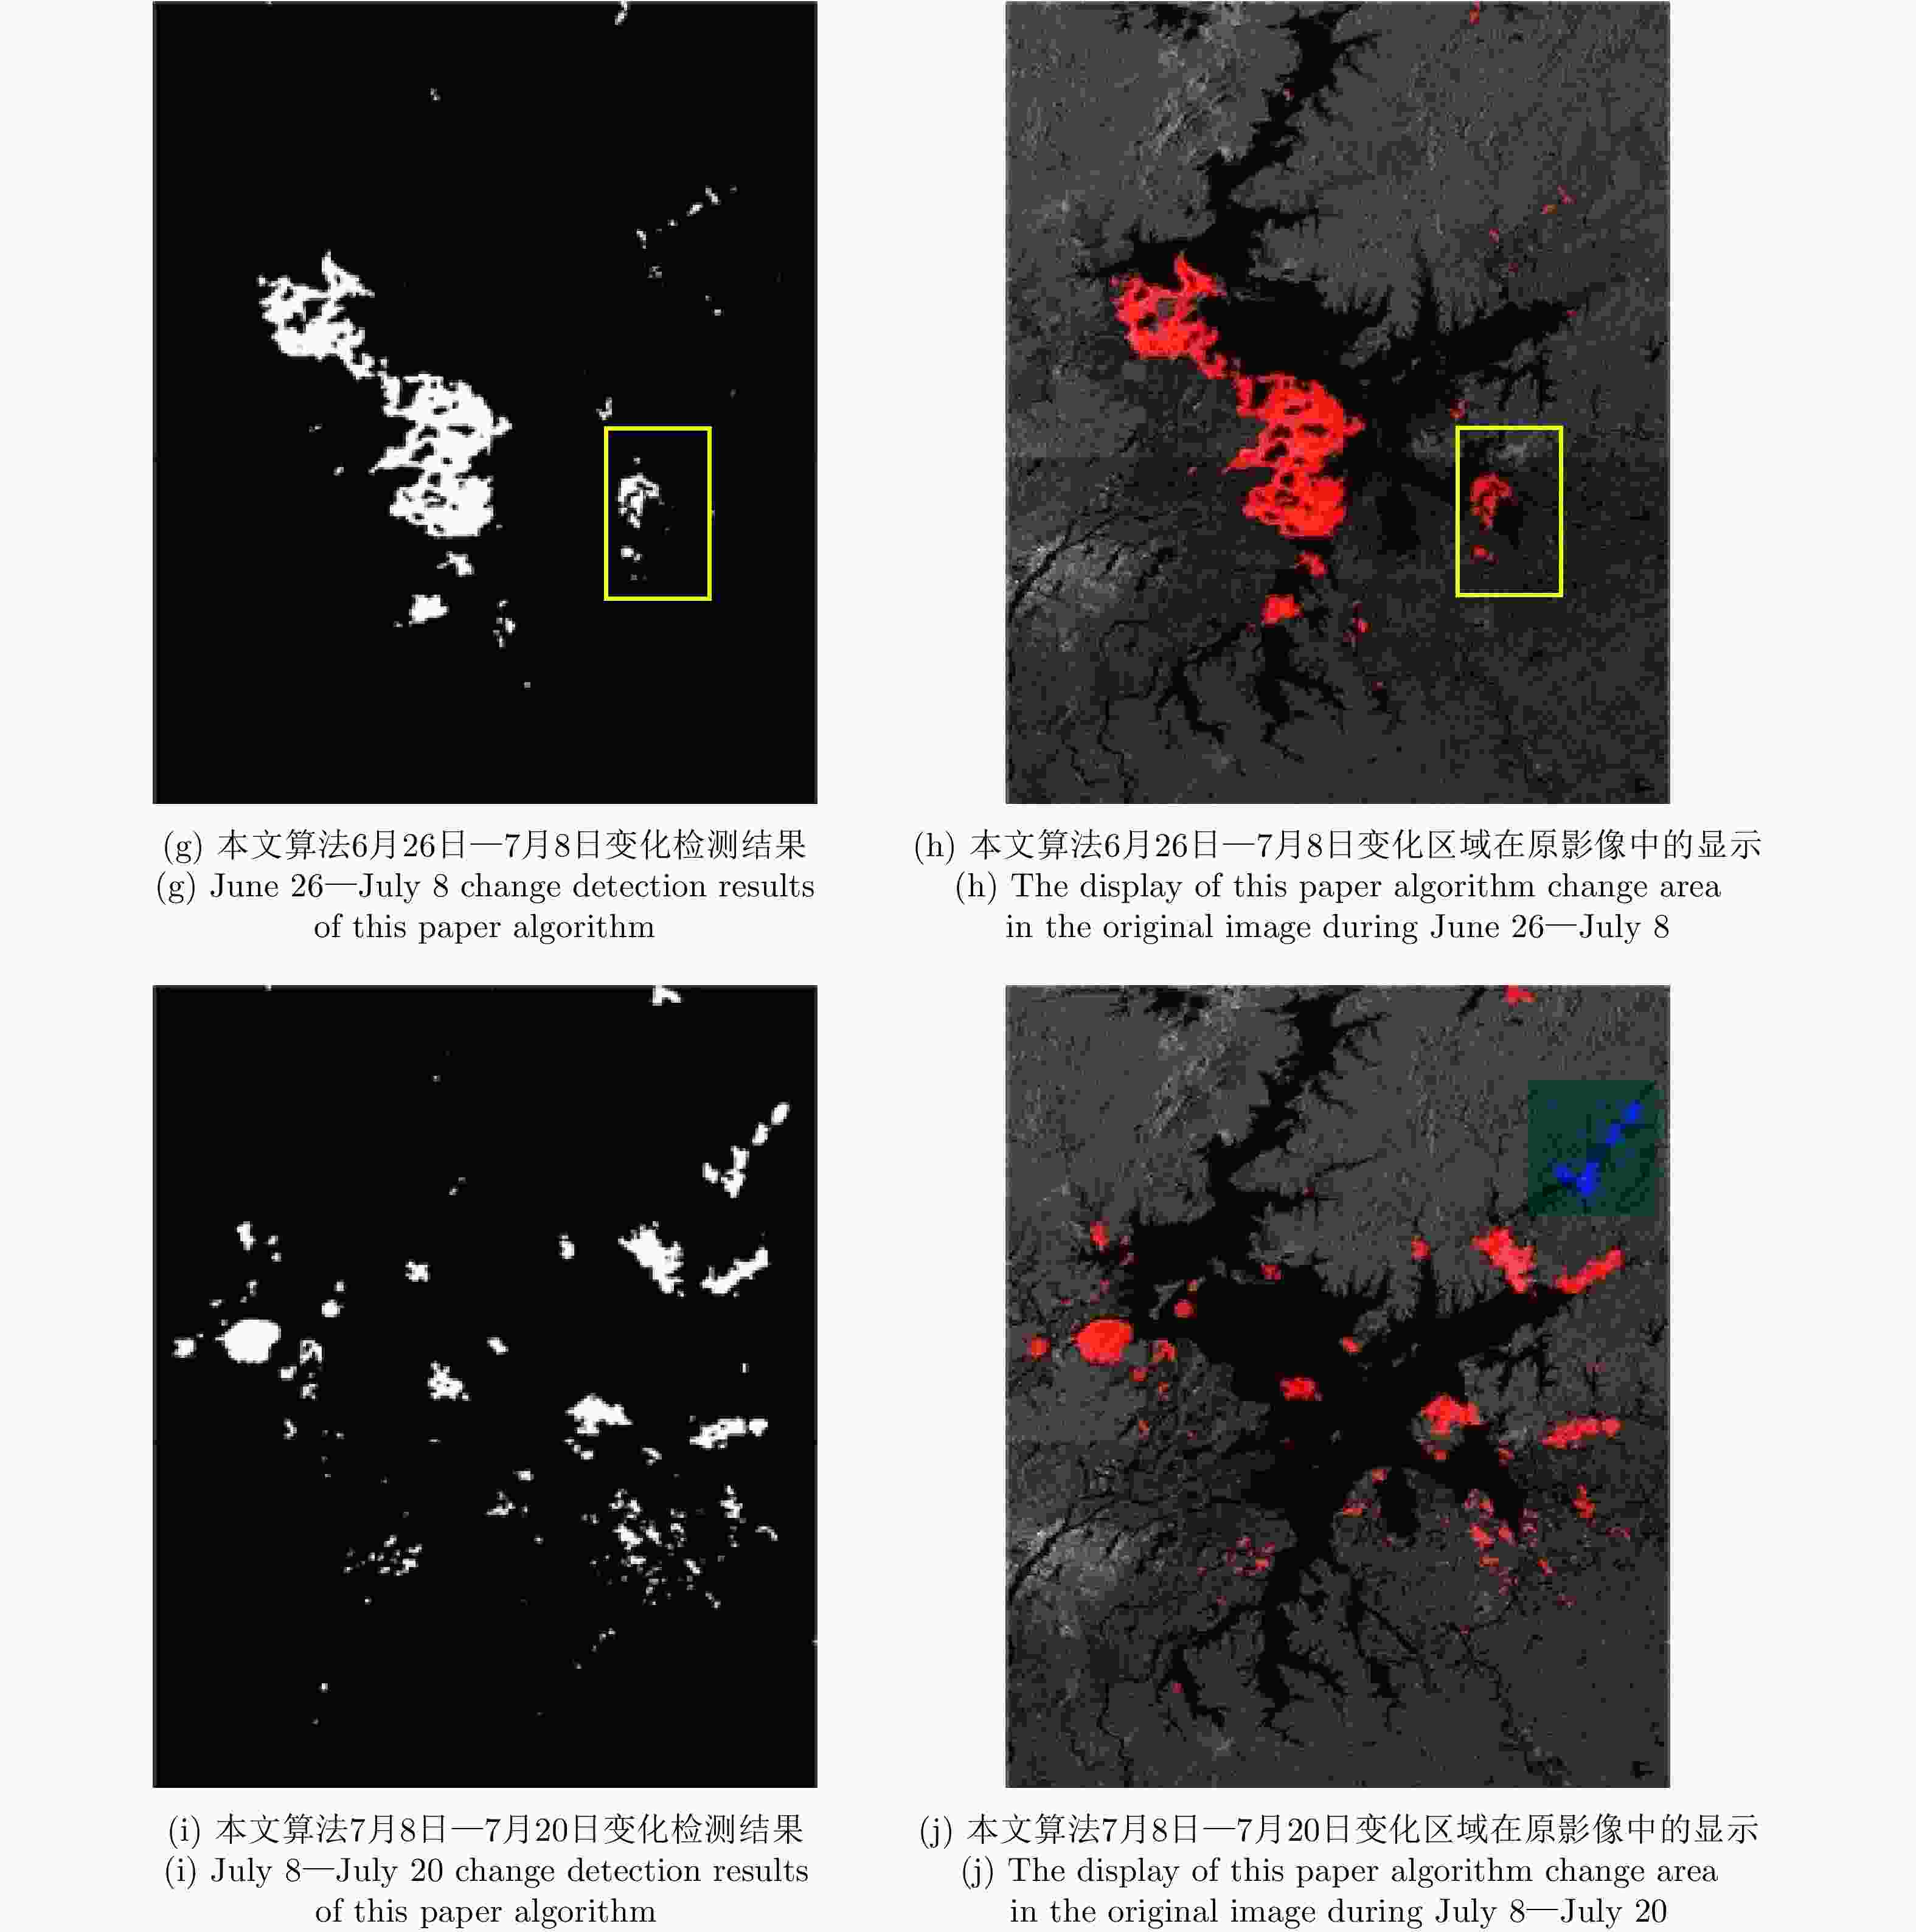
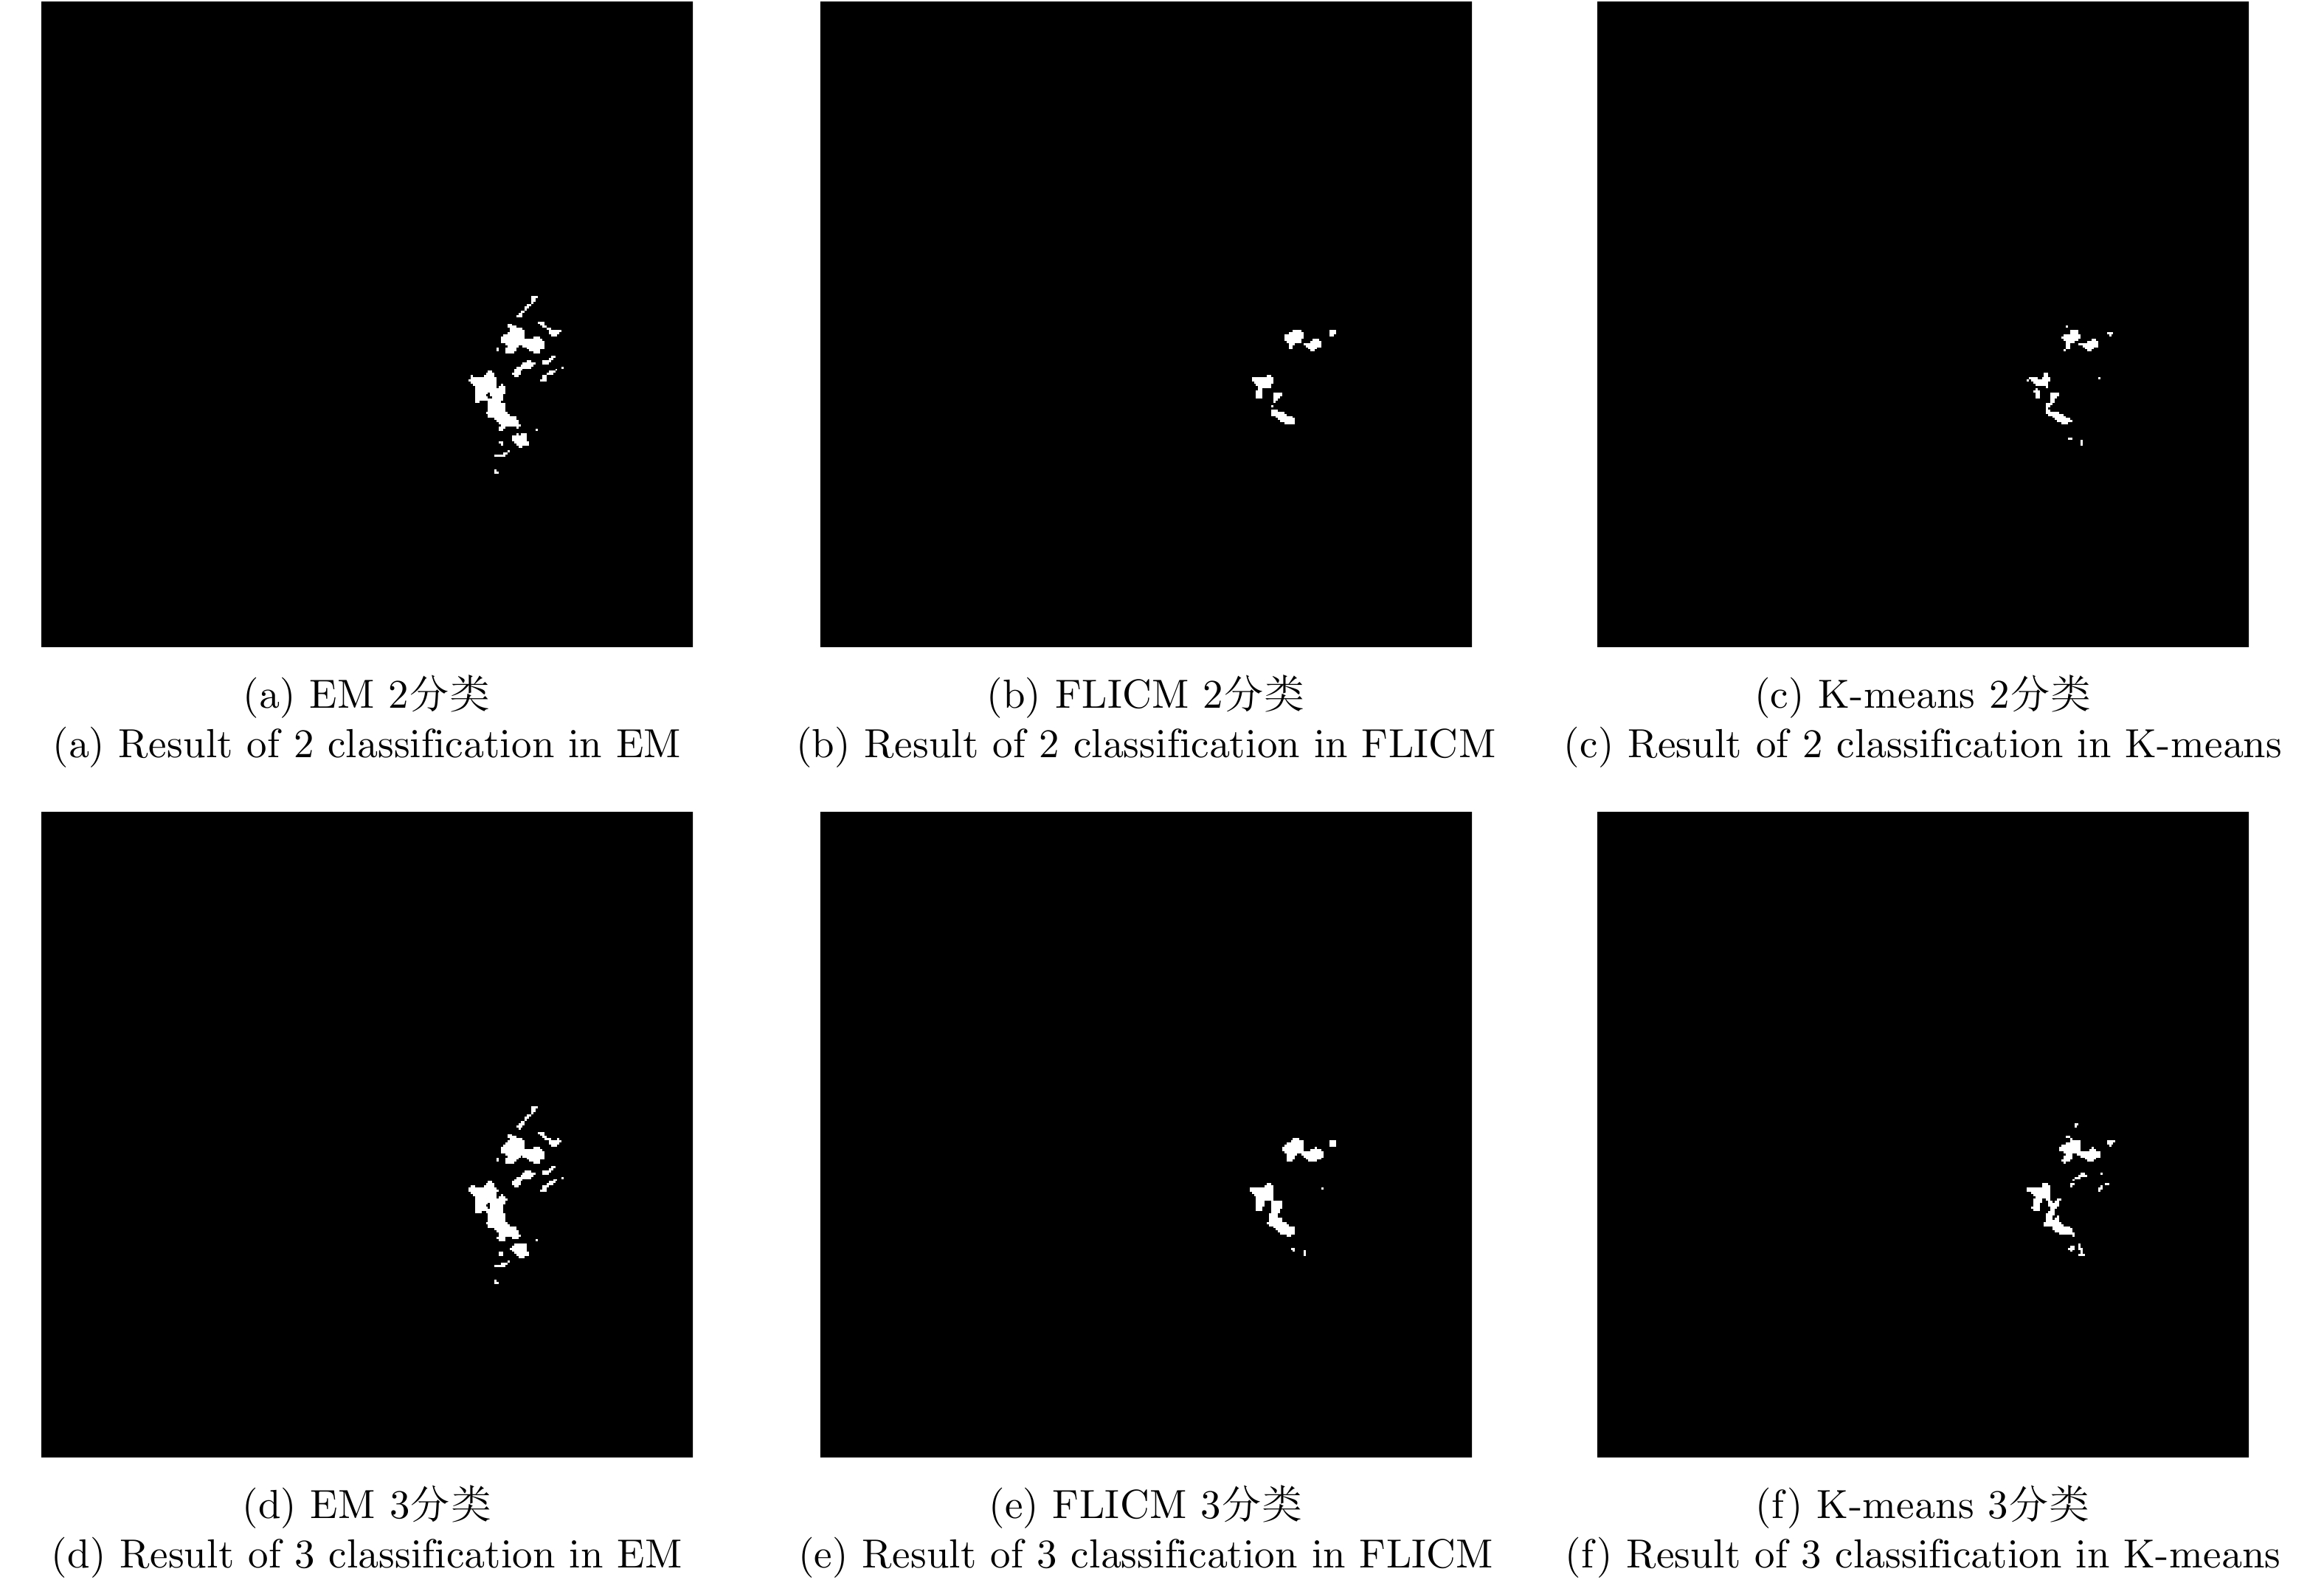
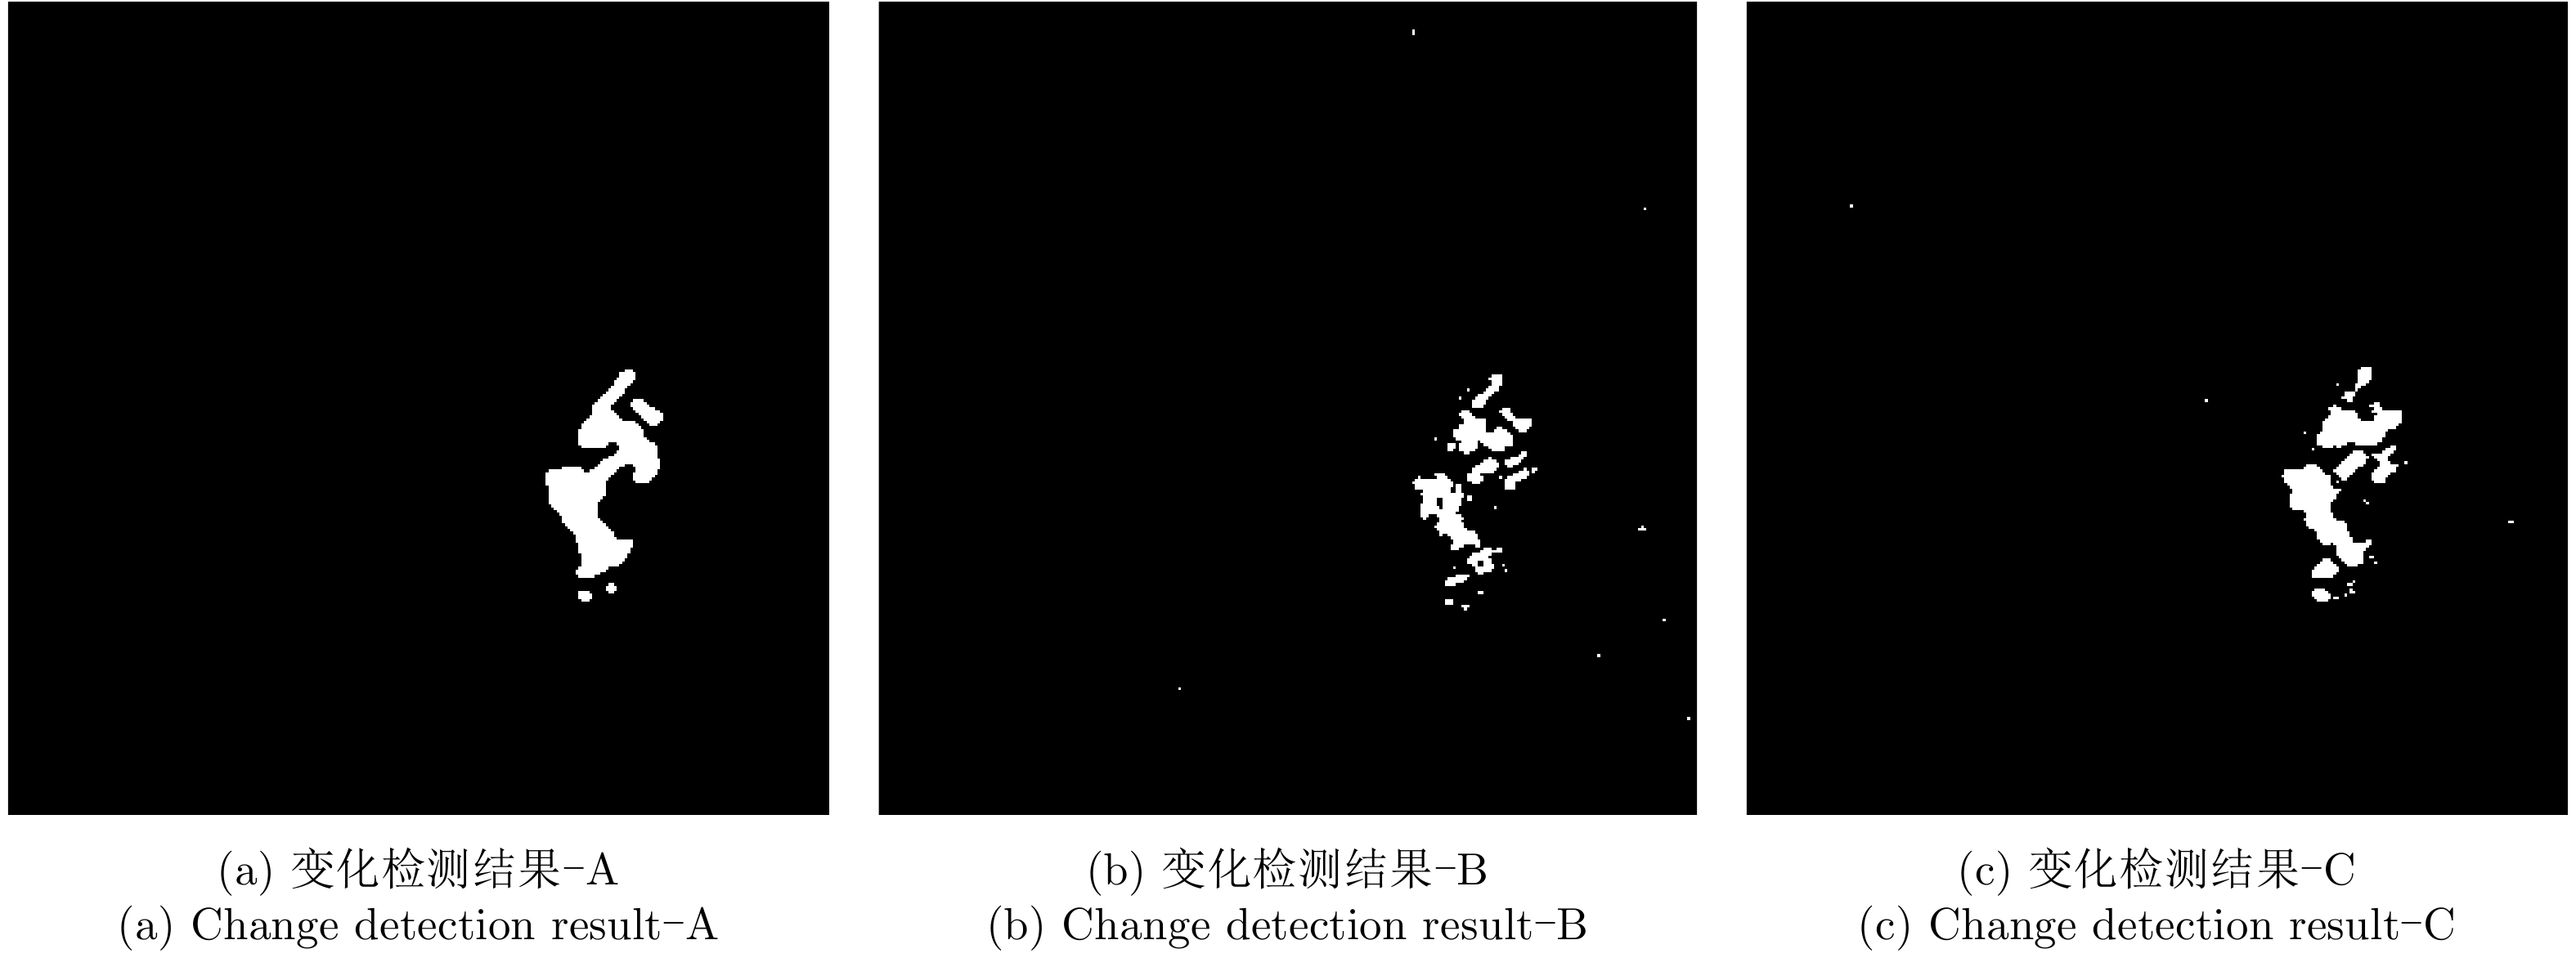
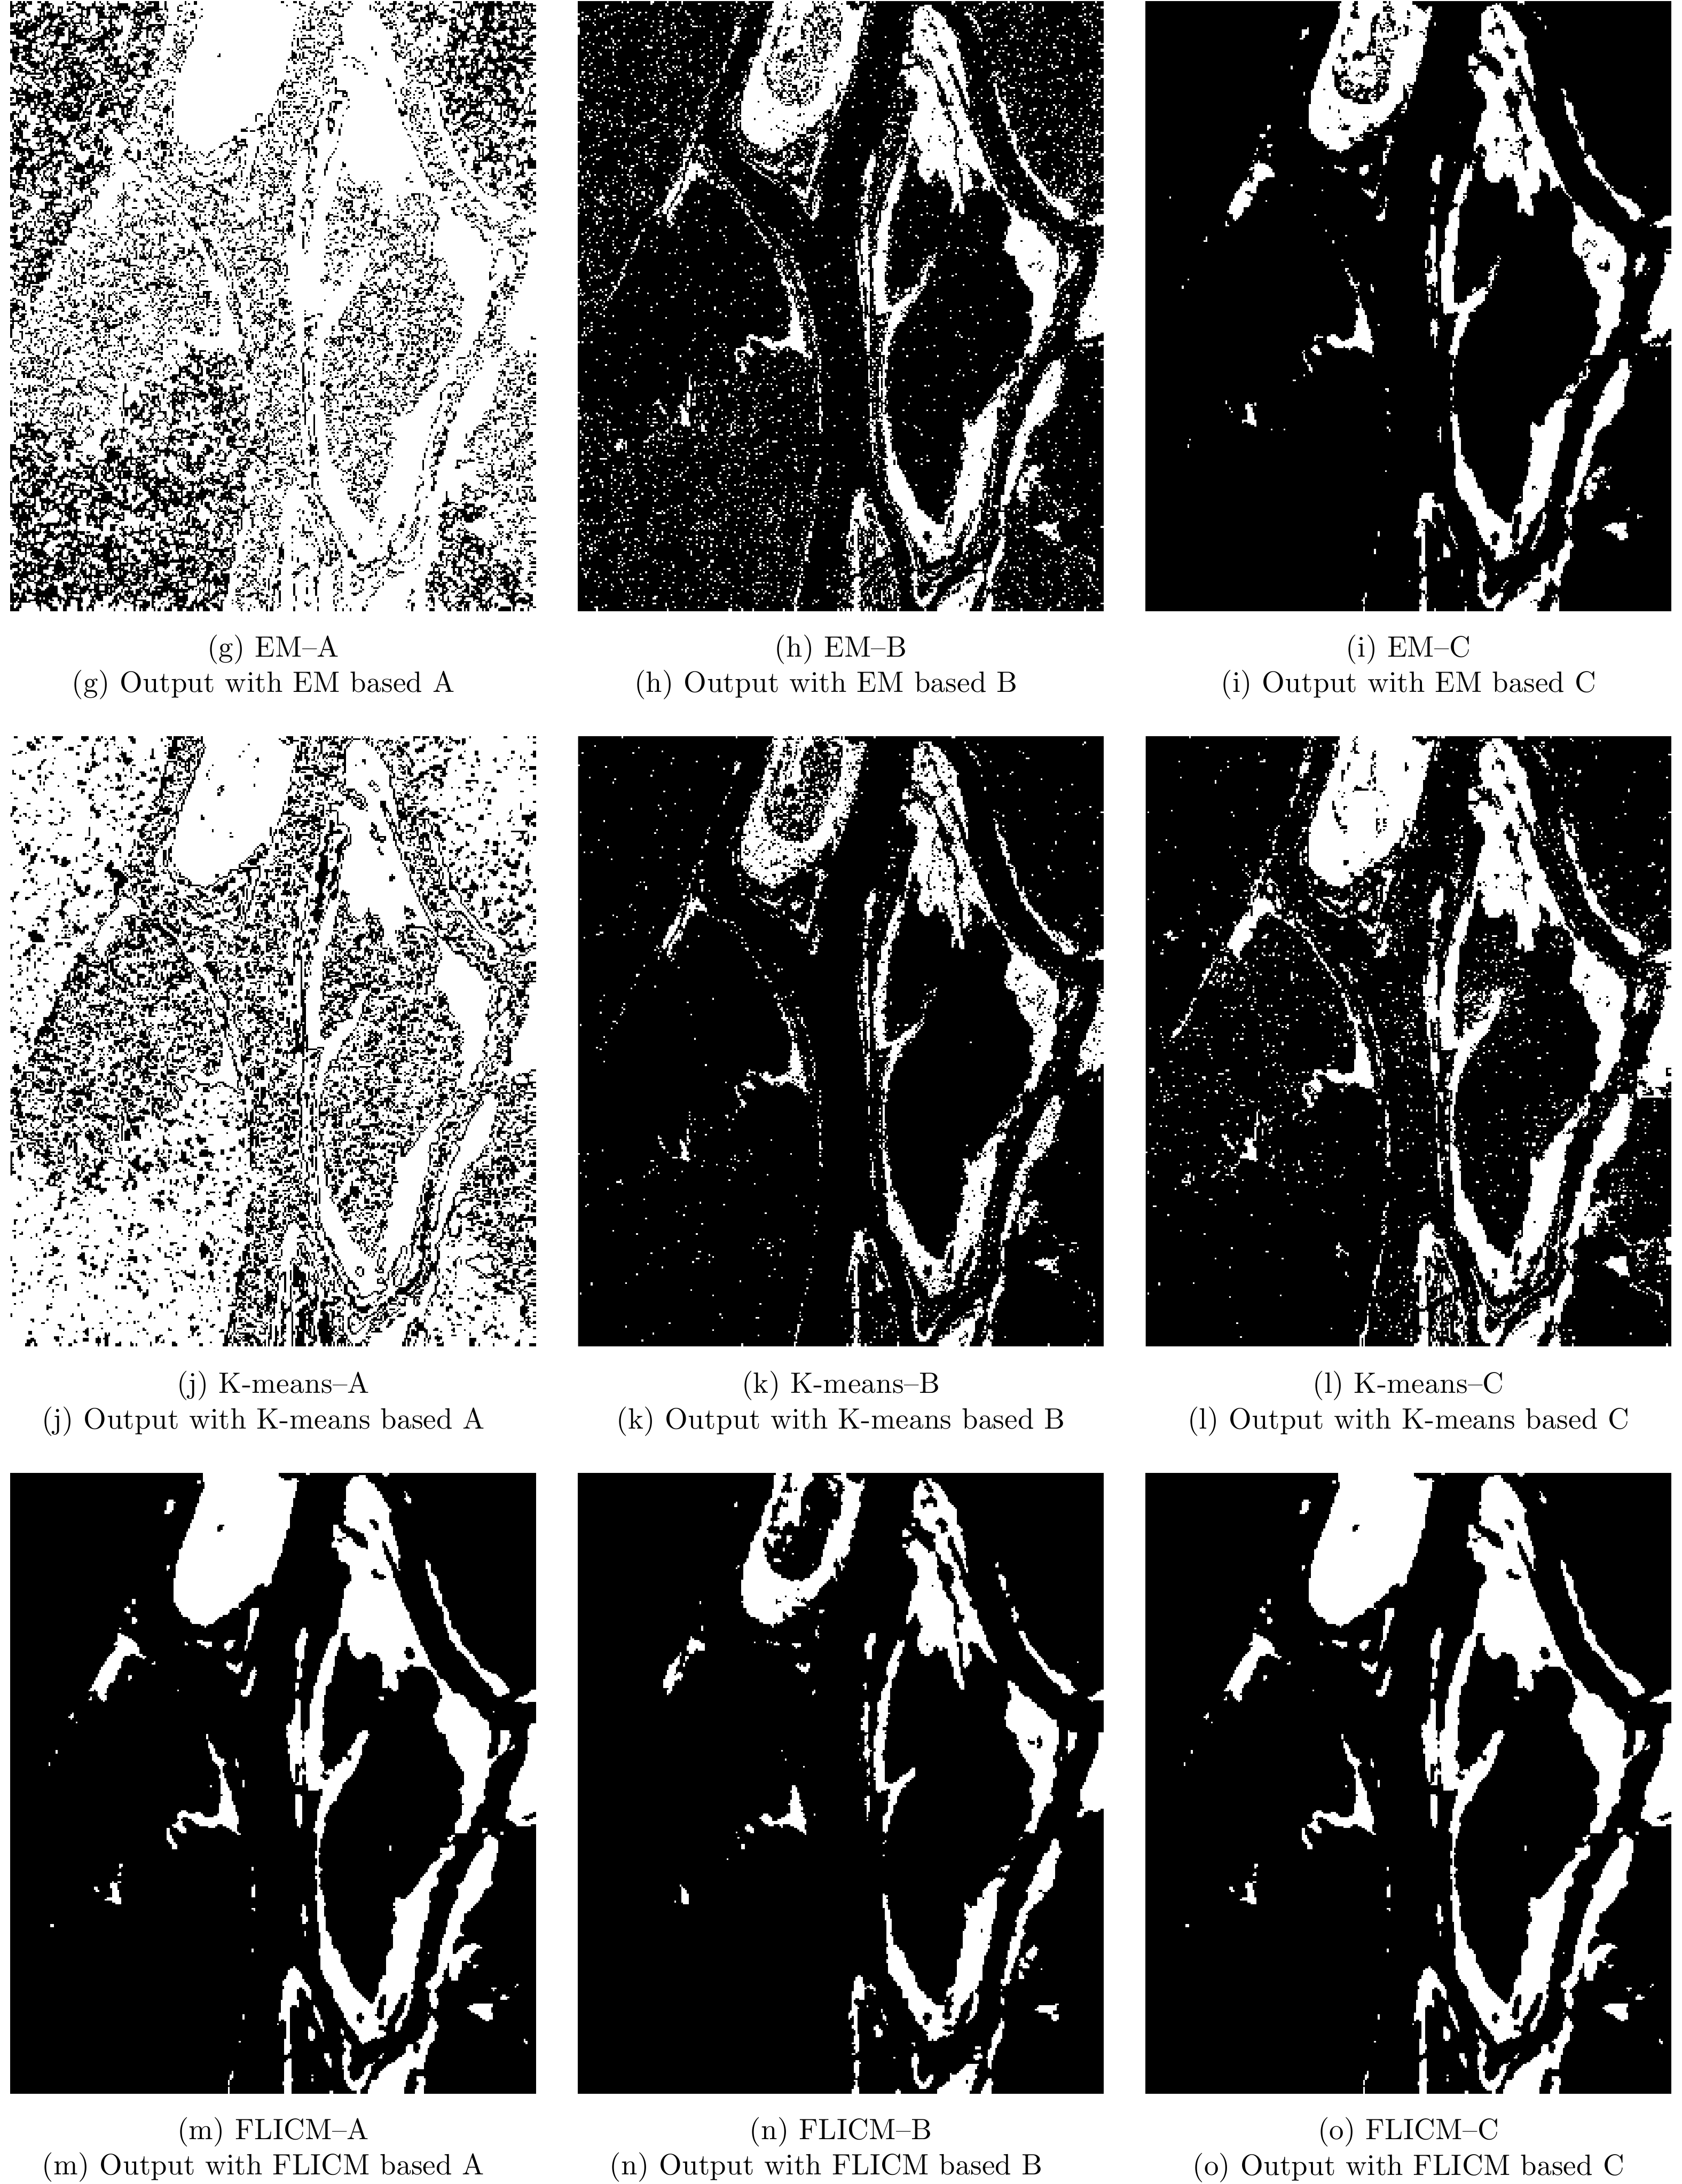
11 鄱阳湖区域EM, FLICM, K-means和本文算法洪灾前后变化检测结果
11. Change detection results of EM, FLICM, K-means and this paper algorithm before and after the flood disaster in Poyang Lake area
表 1 基于融合差异图的ICM-MRF图像分割计算过程
Table 1. ICM-MRF image segmentation calculation process based on fusion difference map
输入:构造的融合差异图 ${Y}$ 开始 (1) 将差融合差异图以FLICM算法分为3类(变化类、未变化类、
待定类);(2) 计算变化类、未变化类、待定区域的相关系数均值; (3) 根据待定区域相关系数从属规则分类得到初始标签图; While(设置初始迭代条件) (4) 估计初始标签下分布下的类均值 ${\mu _1}$, ${\mu _2}$,类方差 $\sigma _1^2$, $\sigma _2^2$; (5) 计算特征场能量 ${U}\left( {{Y}\left| {X} \right.} \right)$,计算标记场能量 ${U}\left( {X} \right)$; (6) 计算似然能量函数 ${U}\left( {{X}\left| {Y} \right.} \right)$; (7) 通过 ${U}\left( {\left. {X} \right|{Y}} \right)$最小,计算2类分割结果; (8) 是否满足迭代条件,若满足则输出变化检测图像,若不满足,
则转到(4)继续执行;输出:变化检测结果  下载: 导出CSV
表 2 Bern数据集不同差异图不同算法变化检测指标分析
Table 2. Analysis of change detection indicators of different algorithms in Bern dataset
方法 FP (%) OE (%) PCC (%) Kappa系数 A B C A B C A B C A B C EM 0.003 1.400 1.670 0.600 1.830 1.990 99.400 98.170 98.010 0.662 0.468 0.480 K-means 0.001 0.015 0.101 1.100 0.740 0.500 98.900 99.260 99.500 0.277 0.614 0.774 FLICM 0.001 0.001 0.060 1.040 0.780 0.450 98.960 99.220 99.550 0.676 0.549 0.793 ICM-MRF 0.360 0.110 0.171 0.520 0.500 0.400 99.480 99.500 99.600 0.807 0.777 0.837
下载: 导出CSV
表 3 Ottawa数据集不同差异图不同算法变化检测指标分析
Table 3. Analysis of change detection indicators of different algorithms in Ottawa dataset
方法 FP (%) OE (%) PCC (%) Kappa系数 A B C A B C A B C A B C EM 55.560 6.453 0.462 55.570 8.760 3.240 44.430 91.240 96.760 0.140 0.702 0.871 K-means 57.367 1.230 5.290 58.310 5.910 6.440 42.690 94.090 93.560 0.106 0.756 0.781 FLICM 4.440 0.110 0.260 4.530 5.180 3.690 95.470 94.820 96.310 0.847 0.777 0.849 ICM-MRF 3.000 0.110 0.160 3.300 4.790 3.050 96.700 95.210 96.950 0.884 0.796 0.877
下载: 导出CSV
表 4 鄱阳湖区域变化检测结果量化分析
Table 4. Quantitative analysis of the detection results of Poyang Lake area change
日期 变化像素数 总占比率(%) 受灾面积(km2) 6月26日—7月8日 12589 1.94 743.37 7月8日—7月20日 5475 0.84 323.29
下载: 导出CSV
-
[1] KRISHNA VANAMA V S and RAO Y S. Change detection based flood mapping of 2015 flood event of Chennai city using Sentinel-1 SAR images[C]. IGARSS 2019–2019 IEEE International Geoscience and Remote Sensing Symposium, Yokohama, Japan, 2019: 9729–9732. doi: 10.1109/IGARSS.2019.8899282. [2] HOU Biao, WEI Qian, ZHENG Yaoguo, et al. Unsupervised change detection in SAR image based on gauss-log ratio image fusion and compressed projection[J]. IEEE Journal of Selected Topics in Applied Earth Observations and Remote Sensing, 2014, 7(8): 3297–3317. doi: 10.1109/JSTARS.2014.2328344 [3] ZHOU Licun, CAO Guo, LI Yupeng, et al. Change detection based on conditional random field with region connection constraints in high-resolution remote sensing images[J]. IEEE Journal of Selected Topics in Applied Earth Observations and Remote Sensing, 2016, 9(8): 3478–3488. doi: 10.1109/JSTARS.2016.2514610 [4] JIA Lu, LI Ming, ZHANG Peng, et al. SAR image change detection based on correlation kernel and multistage extreme learning machine[J]. IEEE Transactions on Geoscience and Remote Sensing, 2016, 54(10): 5993–6006. doi: 10.1109/TGRS.2016.2578438 [5] NAJAFI A, HASANLOU M, and AKBARI V. Land cover changes detection in polarimetric SAR data using algebra, similarity and distance based methods[J]. International Archives of the Photogrammetry,Remote Sensing and Spatial Information Sciences, 2017, XLII-4/W4: 195–200. doi: 10.5194/isprs-archives-XLII-4-W4-195-2017 [6] GONG Maoguo, CAO Yu, and WU Qiaodi. A neighborhood-based ratio approach for change detection in SAR images[J]. IEEE Geoscience and Remote Sensing Letters, 2012, 9(2): 307–311. doi: 10.1109/LGRS.2011.2167211 [7] ZHENG Yaoguo, ZHANG Xiangrong, HOU Biao, et al. Using combined difference image and k-means clustering for SAR image change detection[J]. IEEE Geoscience and Remote Sensing Letters, 2014, 11(3): 691–695. doi: 10.1109/LGRS.2013.2275738 [8] INGLADA J and MERCIER G. A new statistical similarity measure for change detection in multitemporal SAR images and its extension to multiscale change analysis[J]. IEEE Transactions on Geoscience and Remote Sensing, 2007, 45(5): 1432–1445. doi: 10.1109/TGRS.2007.893568 [9] JIA Meng, HUO Lina, and ZHANG Runzhao. An unsupervised change detection based on automatic relationship analysis[C]. The 2019 14th IEEE Conference on Industrial Electronics and Applications (ICIEA), Xi’an, China, 2019. doi: 10.1109/ICIEA.2019.8833683. [10] WAN Ling, XIANG Yuming, and YOU Hongjian. A cooperative multitemporal segmentation method for SAR and optical images change detection[C]. IGARSS 2019-2019 IEEE International Geoscience and Remote Sensing Symposium, Yokohama, Japan, 2019: 1613–1616. doi: 10.1109/IGARSS.2019.8898866. [11] MA Jingjing, GONG Maoguo, and ZHOU Zhiqiang. Wavelet fusion on ratio images for change detection in SAR images[J]. IEEE Geoscience and Remote Sensing Letters, 2012, 9(6): 1122–1126. doi: 10.1109/LGRS.2012.2191387 [12] AMISSE C, JIJON-PALMA M E, and CENTENO J A S. Mapping extension and magnitude of changes induced by cyclone Idai with multi-temporal Landsat and SAR images[C]. 2020 IEEE Latin American GRSS & ISPRS Remote Sensing Conference (LAGIRS), Santiago, Chile, 2020: 574–578. doi: 10.1109/LAGIRS48042.2020.9165657. [13] 黄平平, 任慧芳, 谭维贤, 等. 基于地基雷达图像的无监督变化检测[J]. 雷达学报, 2020, 9(3): 514–524. doi: 10.12000/JR20004HUANG Pingping, REN Huifang, TAN Weixian, et al. Unsupervised change detection using ground-based radar image[J]. Journal of Radars, 2020, 9(3): 514–524. doi: 10.12000/JR20004 [14] DING Yi, LIU Ming, LI Suju, et al. Mountainous landslide recognition based on gaofen-3 polarimetric SAR imagery[C]. IGARSS 2019-2019 IEEE International Geoscience and Remote Sensing Symposium, Yokohama, Japan, 2019: 9634–9637. doi: 10.1109/IGARSS.2019.8900478. [15] GONG Maoguo, ZHOU Zhiqiang, and MA Jingjing. Change detection in synthetic aperture radar images based on image fusion and fuzzy clustering[J]. IEEE Transactions on Image Processing, 2012, 21(4): 2141–2151. doi: 10.1109/TIP.2011.2170702 [16] HEIDARPOUR SHAHREZAEI I and KIM H C. Fractal analysis and texture classification of high-frequency multiplicative noise in SAR Sea-Ice images based on a transform-domain image decomposition method[J]. IEEE Access, 2020, 8: 40198–40223. doi: 10.1109/ACCESS.2020.2976815 [17] CELIK T and MA Kaikuang. Multitemporal image change detection using undecimated discrete wavelet transform and active contours[J]. IEEE Transactions on Geoscience and Remote Sensing, 2011, 49(2): 706–716. doi: 10.1109/TGRS.2010.2066979 [18] 李丹, 吴保生, 陈博伟, 等. 基于卫星遥感的水体信息提取研究进展与展望[J]. 清华大学学报: 自然科学版, 2020, 60(2): 147–161. doi: 10.16511/j.cnki.qhdxxb.2019.22.038LI Dan, WU Baosheng, CHEN Bowei, et al. Review of water body information extraction based on satellite remote sensing[J]. Journal of Tsinghua University:Science and Technology, 2020, 60(2): 147–161. doi: 10.16511/j.cnki.qhdxxb.2019.22.038 [19] SUMAIYA M N and SHANTHA SELVA KUMARI R. Logarithmic mean-based thresholding for SAR image change detection[J]. IEEE Geoscience and Remote Sensing Letters, 2016, 13(11): 1726–1728. doi: 10.1109/LGRS.2016.2606119 [20] ZHANG Xiaohua, CHEN Jiawei, and MENG Hongyun. A novel SAR image change detection based on Graph-Cut and generalized gaussian model[J]. IEEE Geoscience and Remote Sensing Letters, 2013, 10(1): 14–18. doi: 10.1109/LGRS.2012.2189867 [21] LI Mengke, LI Ming, ZHANG Peng, et al. SAR image change detection using PCANet guided by saliency detection[J]. IEEE Geoscience and Remote Sensing Letters, 2019, 16(3): 402–406. doi: 10.1109/LGRS.2018.2876616 [22] LI Yangyang, PENG Cheng, CHEN Yanqiao, et al. A deep learning method for change detection in Synthetic Aperture Radar images[J]. IEEE Transactions on Geoscience and Remote Sensing, 2019, 57(8): 5751–5763. doi: 10.1109/TGRS.2019.2901945 [23] 王志豪, 李刚, 蒋骁. 基于光学和SAR遥感图像融合的洪灾区域检测方法[J]. 雷达学报, 2020, 9(3): 539–553. doi: 10.12000/JR19095WANG Zhihao, LI Gang, and JIANG Xiao. Flooded area detection method based on fusion of optical and SAR remote sensing images[J]. Journal of Radars, 2020, 9(3): 539–553. doi: 10.12000/JR19095 [24] CUI Shiyong and LUO Chengfeng. Feature-based non-parametric estimation of kullback-leibler divergence for SAR image change detection[J]. Remote Sensing Letters, 2016, 7(11): 1102–1111. doi: 10.1080/2150704X.2016.1212418 [25] 冷英, 李宁. 一种改进的变化检测方法及其在洪水监测中的应用[J]. 雷达学报, 2017, 6(2): 204–212. doi: 10.12000/JR16139LENG Ying and LI Ning. Improved change detection method for flood monitoring[J]. Journal of Radars, 2017, 6(2): 204–212. doi: 10.12000/JR16139 [26] GIERULL C H. On the statistics of coherence estimators for textured clutter plus noise[J]. IEEE Geoscience and Remote Sensing Letters, 2017, 14(5): 679–683. doi: 10.1109/LGRS.2017.2671747 [27] KIM J and FESSLER J A. Intensity-based image registration using robust correlation coefficients[J]. IEEE Transactions on Medical Imaging, 2004, 23(11): 1430–1444. doi: 10.1109/TMI.2004.835313 [28] PU Yunchen, XU Qiongcheng, and WANG Wei. Image change detection based on cross-correlation coefficient by using genetic algorithm[C]. 2012 the 1st International Conference on Agro-Geoinformatics, Shanghai, China, 2012. doi: 10.1109/Agro-Geoinformatics.2012.6311693. [29] BRUZZONE L and FERNANDEZ PRIETO D. An MRF approach to unsupervised change detection[C]. 1999 International Conference on Image Processing, Kobe, Japan, 1999: 143–147. doi: 10.1109/ICIP.1999.821583. [30] WANG Guiting, FAN Yuanzhang, and JIAO Licheng. A new change detection method based on non-parametric density estimation and markov random fields[C]. The SPIE 7497, MIPPR 2009: Medical Imaging, Parallel Processing of Images, and Optimization Techniques, Yichang, China, 2009. doi: 10.1117/12.833052. -


计量
- 文章访问数:
- HTML全文浏览量:
- PDF下载量:
- 被引次数: 0

