
 作者中心
作者中心 专家审稿
专家审稿 责编办公
责编办公 编辑办公
编辑办公
Evaluating the Impacts of Using Different Digital Surface Models to Estimate Forest Height with TanDEM-X Interferometric Coherence Data (in English)
DOI: 10.12000/JR20009 cstr: 32380.14.JR20009
-
Abstract:
In our previous studies, we demonstrated the usefulness of TanDEM-X interferometric bistatic mode with single polarization to obtain forest heights for the purposes of large area mapping. A key feature of our approach has been the use of a simplified Random Volume Over Ground (RVOG) model that locally estimates forest height. The model takes TanDEM-X interferometric coherence amplitude as an input and uses an external Digital Surface Model (DSM) to account for local slope variations due to terrain topography in order to achieve accurate forest height estimation. The selection of DSM for use as a local slope reference is essential, as an inaccurate DSM will result in less accurate terrain-correction and forest height estimation. In this paper, we assessed TanDEM-X height estimates associated with scale variations in different DSMs used in the model over a remote sensing supersite in Petawawa, Canada. The DSMs used for assessments and comparisons included ASTER GDEM, ALOS GDSM, airborne DRAPE DSM, Canadian DSM and TanDEM-X DSM. Airborne Laser Scanning (ALS) data were used as reference for terrain slope and forest height comparisons. The results showed that, with the exception of the ASTER GDEM, all DSMs were sufficiently accurate for the simplified RVOG model to provide a satisfactory estimate of stand-level forest height. When compared to the ALS 95th height percentile, the modeled forest heights had R2 values greater than 80% and Root-Mean-Square Errors (RMSE) less than 2 m. For a close similarity in slope estimation with the ALS reference, coverage across Canada and open data access, the 0.75 arc-second (20 m) resolution Canadian DSM was selected as a preferred choice for the simplified RVOG model to provide TanDEM-X height estimation in Canada.
-
Key words:
- Interferometric COA /
- Digital surface model /
- Forest height
-
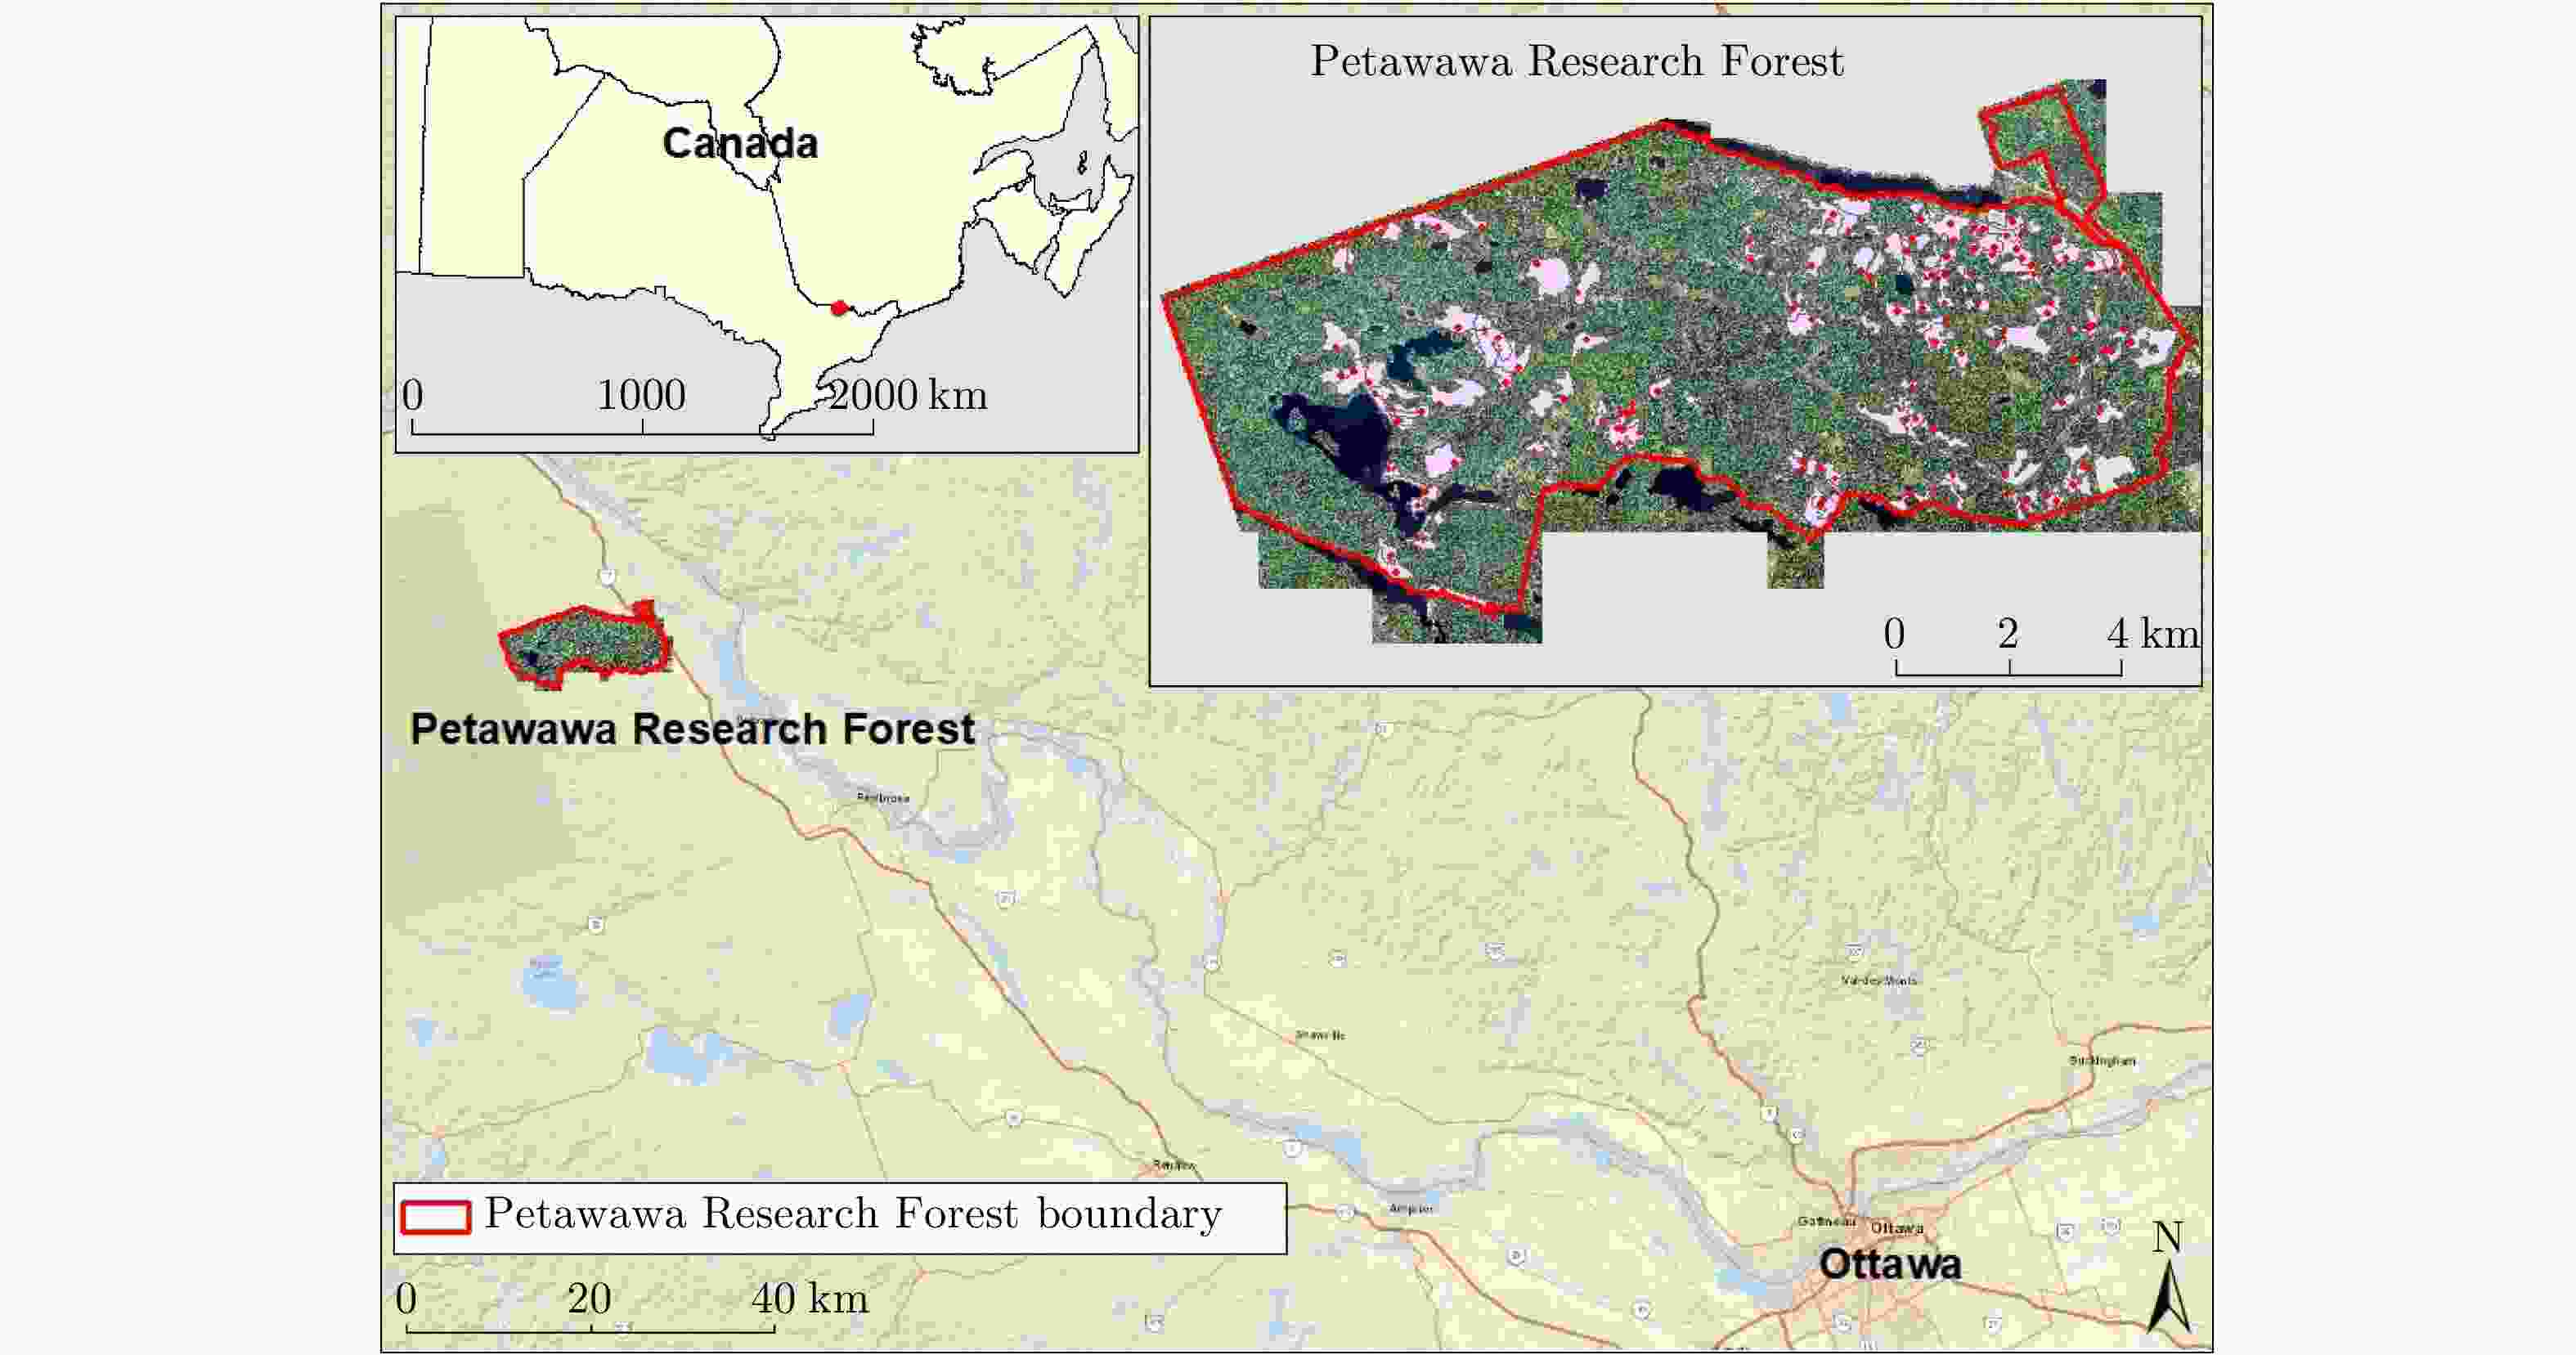
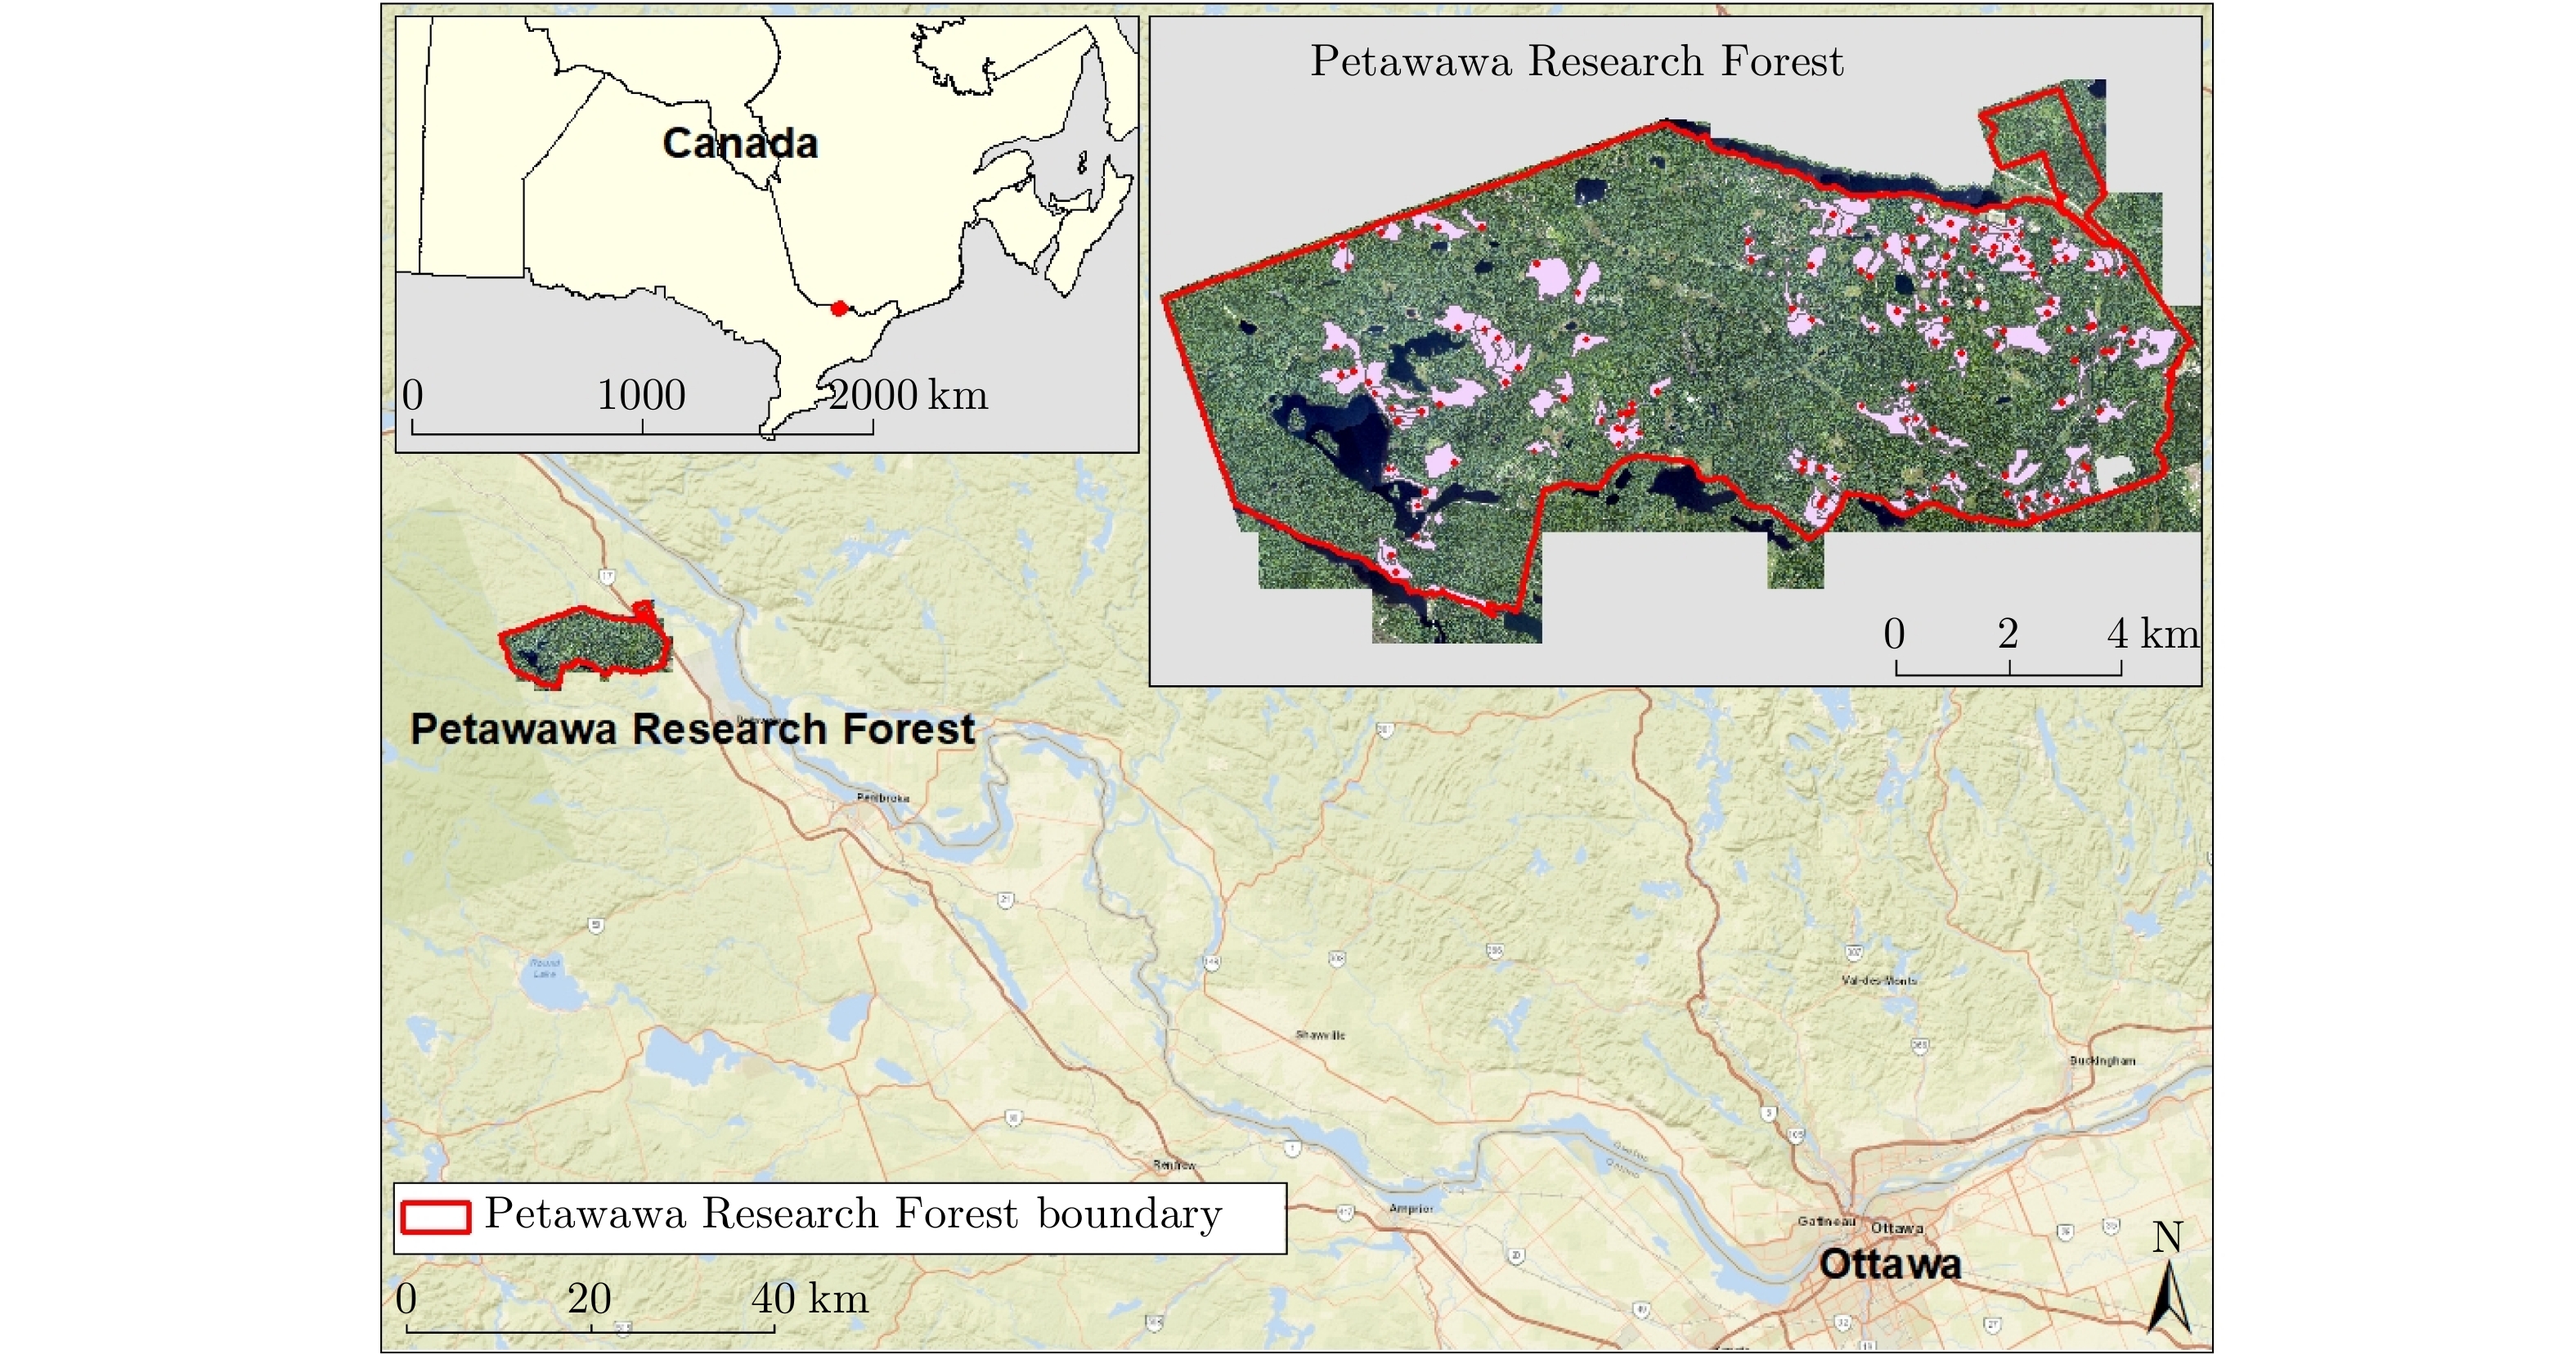
Figure 1. Study site—the Petawawa Research Forest (red polygon), where forest stand polygons (pink) and field plots (red dots) are situated
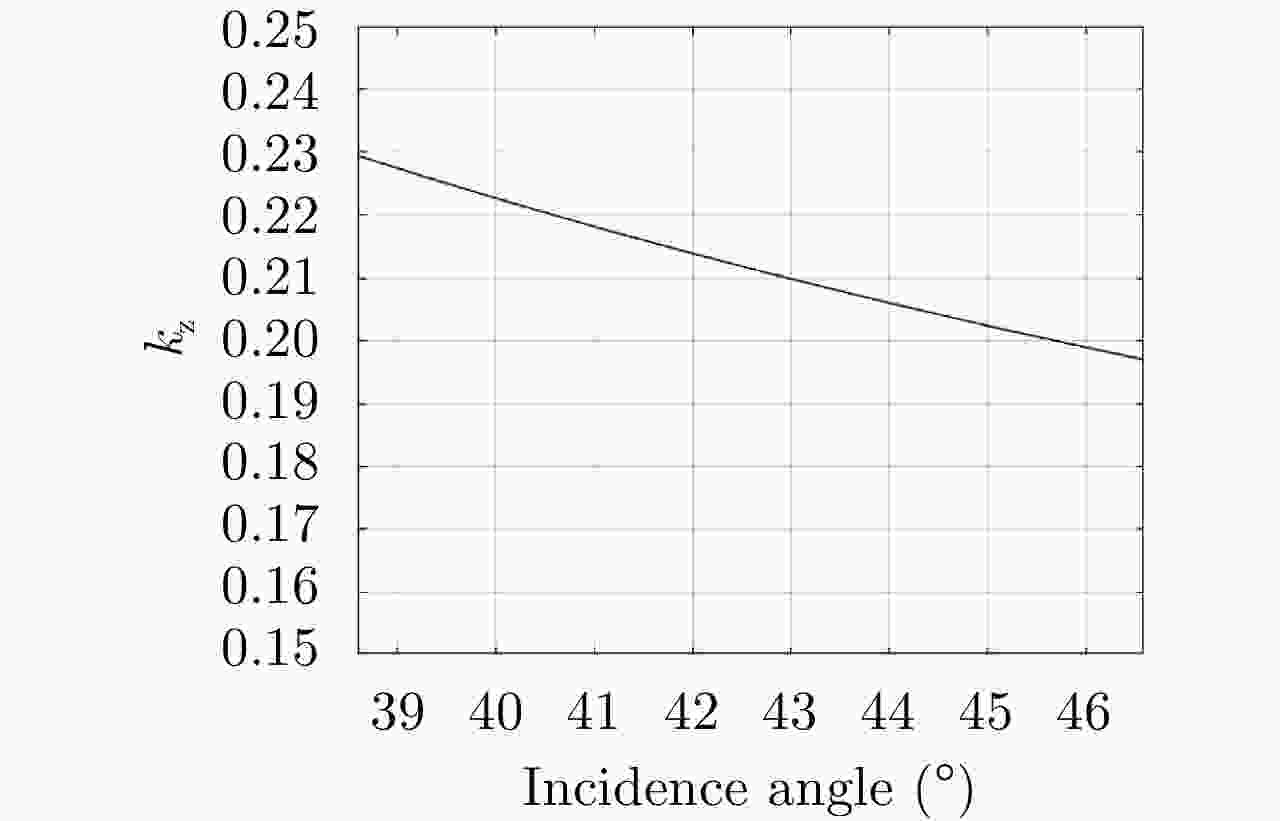
Figure 2. kz vs. local incidence angle (baseline incidence angle set to 42.6° at scene centre)

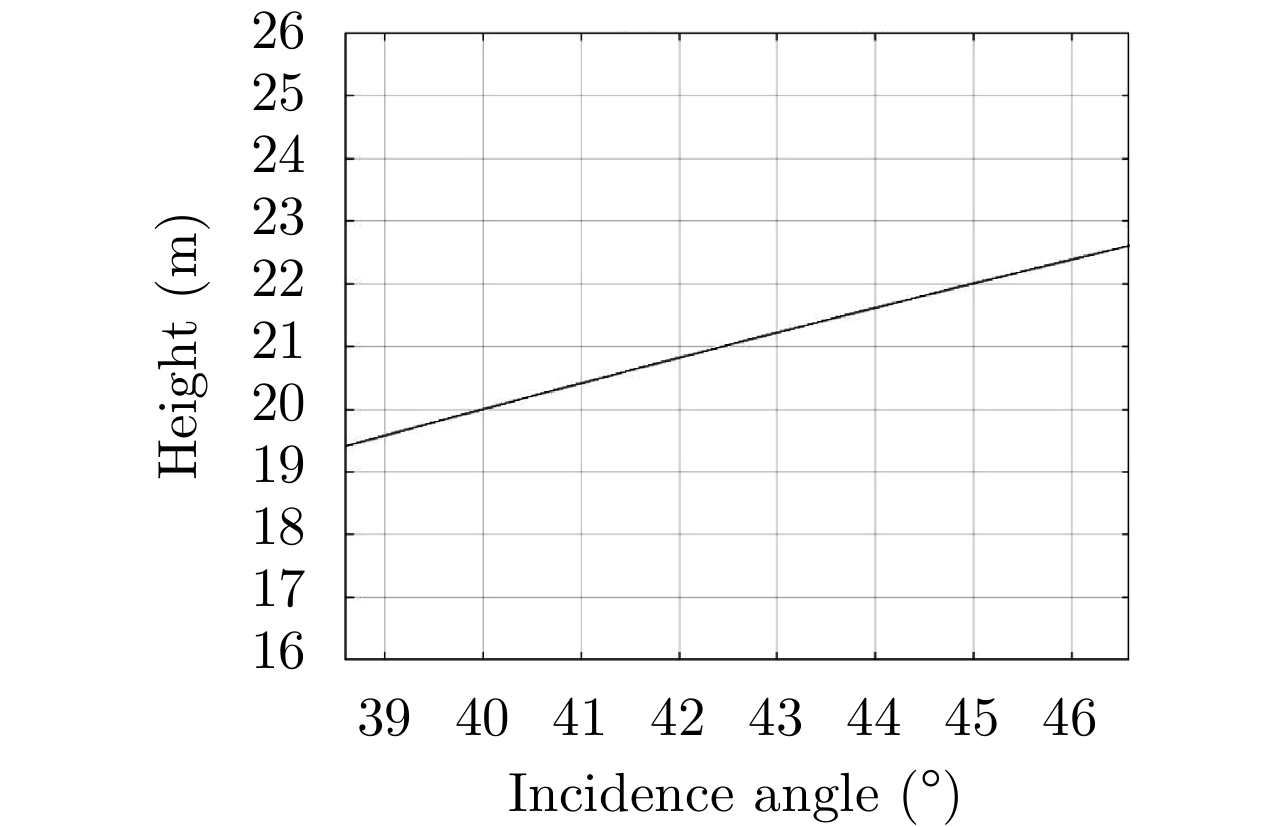
Figure 3. Height vs. local incidence angle (coherence set to 0.36 for average height of ~21 m)
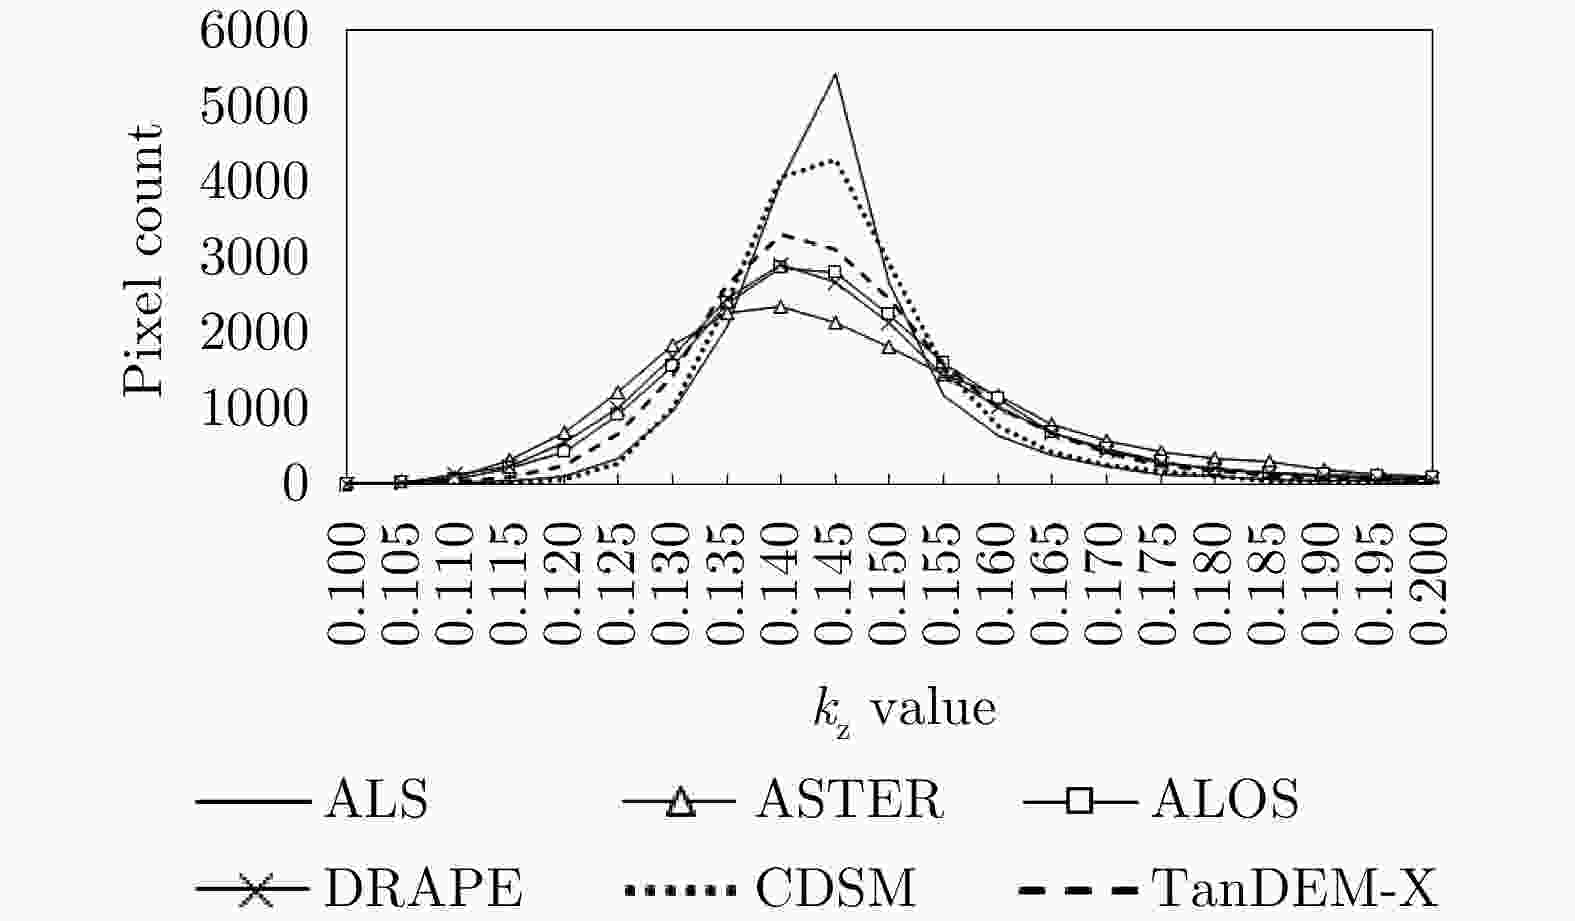
Figure 4. Histograms of the kz values for each candidate DSM and the reference data (2012 ALS DSM)
Table 1. kz differences when comparing to kz generated from 2012 ALS DSM
Diff of kz ASTER GDEM ALOS GDSM CDSM DRAPE DSM TanDEM-X DSM Max 0.1252 0.1296 0.1356 0.1389 0.1433 Mean 0.0435 0.0332 0.0097 0.0360 0.0204  下载: 导出CSV
Table 2. Height comparisons from 94 forest stands
Baseline DSM used in Eq. 2 Slope m Intercept c Adjusted R2 RMSE ALS P95 ASTER GDEM 0.64 10.38 0.759 1.69 ALOS GDSM 0.71 8.93 0.849 1.77 DRAPE DSM 0.75 8.14 0.842 1.92 CDSM 0.71 8.88 0.841 1.73 TanDEM-X DSM 0.66 9.72 0.806 1.70 ALS CDht ASTER GDEM 0.84 6.90 0.796 2.86 ALOS GDSM 0.92 5.14 0.885 3.18 DRAPE DSM 0.91 5.41 0.854 3.18 CDSM 0.92 5.14 0.873 3.12 TanDEM-X DSM 0.86 6.12 0.846 2.97 ALS Topht ASTER GDEM 1.00 3.17 0.791 3.20 ALOS GDSM 1.10 1.00 0.883 3.62 DRAPE DSM 1.09 1.26 0.855 3.62 CDSM 1.10 1.04 0.869 3.53 TanDEM-X DSM 1.03 2.28 0.841 3.35
下载: 导出CSV
-
[1] Natural Resources Canada. The state of Canada’s forests report[EB/OL]. https://www.nrcan.gc.ca/our-natural-resources/forests-forestry/state-canadas-forests-report/16496, 2019. [2] LEFSKY M A, HARDING D J, KELLER M, et al. Estimates of forest canopy height and aboveground biomass using ICESat[J]. Geophysical Research Letters, 2005, 32(22): L22S02. [3] HOUGHTON R A. Aboveground forest biomass and the global carbon balance[J]. Global Change Biology, 2005, 11(6): 945–958. doi: 10.1111/j.1365-2486.2005.00955.x [4] KÖHLER K and HUTH A. Towards ground-truthing of spaceborne estimates of above-ground life biomass and leaf area index in tropical rain forests[J]. Biogeosciences, 2010, 7(8): 2531–2543. doi: 10.5194/bg-7-2531-2010 [5] DUBAYAH R O and DRAKE J B. Lidar remote sensing for forestry[J]. Journal of Forestry, 2000, 98(6): 44–46. [6] BOLTON D K, COOPS N C, and WULDER M A. Investigating the agreement between global canopy height maps and airborne Lidar derived height estimates over Canada[J]. Canadian Journal of Remote Sensing, 2013, 39(S1): S139–S151. [7] NILSSON M. Estimation of tree heights and stand volume using an airborne Lidar system[J]. Remote Sensing of Environment, 1996, 56(1): 1–7. doi: 10.1016/0034-4257(95)00224-3 [8] MAGNUSSEN S and BOUDEWYN P. Derivations of stand heights from airborne laser scanner data with canopy-based quantile estimators[J]. Canadian Journal of Forest Research, 1998, 28(7): 1016–1031. doi: 10.1139/x98-078 [9] REUTEBUCH S E, MCGAUGHEY R J, ANDERSEN H E, et al. Accuracy of a high-resolution Lidar terrain model under a conifer forest canopy[J]. Canadian Journal of Remote Sensing, 2003, 29(5): 527–535. doi: 10.5589/m03-022 [10] MAHONEY C, HALL R J, HOPKINSON C, et al. A forest attribute mapping framework: A pilot study in a northern boreal forest, Northwest Territories, Canada[J]. Remote Sensing, 2018, 10(9): 1338. doi: 10.3390/rs10091338 [11] WULDER W A, WHITE J C, NELSON R F, et al. Lidar sampling for large-area forest characterization: A review[J]. Remote Sensing of Environment, 2012, 121: 196–209. doi: 10.1016/j.rse.2012.02.001 [12] LEFSKY M A. A global forest canopy height map from the moderate resolution imaging spectroradiometer and the geoscience laser altimeter system[J]. Geophysical Research Letters, 2010, 37(15): L15401. [13] SIMARD M, PINTO N, FISHER J B, et al. Mapping forest canopy height globally with spaceborne lidar[J]. Journal of Geophysical Research, 2011, 116(G4): G04021. [14] MATASCI G, HERMOSILLA T, WULDER M A, et al. Large-area mapping of Canadian boreal forest cover, height, biomass and other structural attributes using Landsat composites and lidar plots[J]. Remote Sensing of Environment, 2018, 209: 90–106. doi: 10.1016/j.rse.2017.12.020 [15] BEAUDOIN A, BERNIER P Y, VILLEMAIRE P, et al. Tracking forest attributes across Canada between 2001 and 2011 using a k nearest neighbors mapping approach applied to MODIS imagery[J]. Canadian Journal of Forest Research, 2018, 48(1): 85–93. doi: 10.1139/cjfr-2017-0184 [16] KUGLER F, SCHULZE D, HAJNSEK I, et al. TanDEM-X Pol-InSAR performance for forest height estimation[J]. IEEE Transactions on Geoscience and Remote Sensing, 2014, 52(10): 6404–6422. doi: 10.1109/TGRS.2013.2296533 [17] ASKNE J I H and SANTORO M. On the estimation of boreal forest biomass from TanDEM-X Data without training samples[J]. IEEE Geoscience and Remote Sensing Letters, 2015, 12(4): 771–775. doi: 10.1109/LGRS.2014.2361393 [18] SOJA M J, PERSSON H J, and ULANDER L M H. Estimation of forest biomass from two-level model inversion of single-pass InSAR data[J]. IEEE Transactions on Geoscience and Remote Sensing, 2015, 53(9): 5083–5099. doi: 10.1109/TGRS.2015.2417205 [19] CHEN Hao, CLOUDE S R, and GOODENOUGH D G. Forest canopy height estimation using tandem-X coherence data[J]. IEEE Journal of Selected Topics in Applied Earth Observations and Remote Sensing, 2016, 9(7): 3177–3188. doi: 10.1109/JSTARS.2016.2582722 [20] CHEN Hao, CLOUDE S R, GOODENOUGH D G, et al. Radar forest height estimation in mountainous terrain using tandem-X coherence data[J]. IEEE Journal of Selected Topics in Applied Earth Observations and Remote Sensing, 2018, 11(10): 3443–3452. doi: 10.1109/JSTARS.2018.2866059 [21] CHEN Hao, BEAUDOIN A, HILL D A, et al. Mapping forest height from TanDEM-X interferometric coherence data in northwest Territories, Canada[J]. Canadian Journal of Remote Sensing, 2019, 45(3/4): 290–307. doi: 10.1080/07038992.2019.1604119 [22] CAICOYA A T, KUGLER F, HAJNSEK I, et al. Large-scale biomass classification in boreal forests with tandem-X data[J]. IEEE Transactions on Geoscience and Remote Sensing, 2016, 54(10): 5935–5951. doi: 10.1109/TGRS.2016.2575542 [23] ABDULLAHI S, KUGLER F, and PRETZSCH H. Prediction of stem volume in complex temperate forest stands using TanDEM-X SAR data[J]. Remote Sensing of Environment, 2016, 174: 197–211. doi: 10.1016/j.rse.2015.12.012 [24] SADEGHI Y, ST-ONGE B, LEBLON B, et al. Effects of TanDEM-X acquisition parameters on the accuracy of digital surface models of a boreal forest canopy[J]. Canadian Journal of Remote Sensing, 2017, 43(2): 194–207. doi: 10.1080/07038992.2017.1291336 [25] OLESK A, PRAKS J, ANTROPOV O, et al. Interferometric SAR coherence models for characterization of hemiboreal forests using TanDEM-X data[J]. Remote Sensing, 2016, 8(9): 700. doi: 10.3390/rs8090700 [26] NASA/JPL. SRTM C-band data products[EB/OL]. https://www2.jpl.nasa.gov/srtm/cbanddataproducts.html, 2018. [27] NASA/METI/AIST/Japan Spacesystems and U.S./Japan ASTER Science Team. ASTER global digital elevation model[EB/OL]. https://lpdaac.usgs.gov/products/astgtmv002/, 2019. [28] JAXA. ALOS global digital surface model “ALOS World 3D - 30m (AW3D30)”[EB/OL]. https://www.eorc.jaxa.jp/ALOS/en/aw3d30/index.htm, 2019. [29] Natural Resources Canada. Canadian digital elevation model: Product specifications[EB/OL]. http://ftp.geogratis.gc.ca/pub/nrcan_rncan/elevation/cdem_mnec/doc/CDEM_product_specs.pdf, 2013. [30] GOUGEON F A and LECKIE D G. ITC analyses of the Petawawa research forest from satellite and aerial data[C]. The 32nd Canadian Symposium on Remote Sensing and the 14th Congress of L’Association Québécoise de Télédétection, Sherbrooke, Canada, 2011. [31] WHITE J C, CHEN Hao, WOODS M E, et al. The Petawawa research forest: Establishment of a remote sensing supersite[J]. The Forestry Chronicle, 2019, 95(3): 149–156. doi: 10.5558/tfc2019-024 [32] LECKIE D G. Advances in remote sensing technologies for forest surveys and management[J]. Canadian Journal of Forest Research, 1990, 20(4): 464–483. doi: 10.1139/x90-063 [33] WHITE J C, WULDER M A, VARHOLA A, et al. A best practices guide for generating forest inventory attributes from airborne laser scanning data using an area-based approach[J]. The Forestry Chronicle, 2013, 89(6): 722–723. doi: 10.5558/tfc2013-132 [34] RIEGLER G, HENNIG S D, and WEBER M. WorldDEM - A novel global foundation layer[C]. The International Archives of the Photogrammetry, Remote Sensing and Spatial Information Sciences, Munich, Germany, 2015: 183–187. [35] TACHIKAWA T, HATO M, KAKU M, et al. Characteristics of ASTER GDEM version 2[C]. 2011 IEEE International Geoscience and Remote Sensing Symposium, Vancouver, Canada, 2011: 3657–3660. [36] TAKAKU J, TADONO T, TSUTSUI K, et al. Validation of ‘AW3D’ global DSM generated from ALOS PRISM[C]. The ISPRS Annals of the Photogrammetry, Remote Sensing and Spatial Information Sciences, Prague, Czech Republic, 2016: 25–31. [37] Natural Resources Canada. Canadian digital elevation model, 1945–2011[EB/OL]. https://open.canada.ca/data/en/dataset/7f245e4d-76c2-4caa-951a-45d1d2051333, 2015. [38] Land Information Ontario. Digital raster acquisition project-East-2014[EB/OL]. https://dr6j45jk9xcmk.cloudfront.net/documents/2740/stdprod-108778.pdf, 2013. [39] WOODS M and PITT D. Field procedures manual for plot establishment in support of LiDAR derived inventory for the petawawa research forest: modified June 92014 for 2014 field season[R]. Canadian Wood Fibre Centre, 2014. [40] PAPATHANASSIOU K P and CLOUDE S R. Single-baseline polarimetric SAR interferometry[J]. IEEE Transactions on Geoscience and Remote Sensing, 2001, 39(11): 2352–2363. doi: 10.1109/36.964971 [41] CLOUDE S R and PAPATHANASSIOU K P. Three-stage inversion process for polarimetric SAR interferometry[J]. IEE Proceedings - Radar, Sonar and Navigation, 2003, 150(3): 125–134. doi: 10.1049/ip-rsn:20030449 [42] CLOUDE S R. Polarisation: Applications in Remote Sensing[M]. Oxford: Oxford University Press, 2010. doi: 10.1093/acprof:oso/9780199569731.001.0001. [43] GeoBC. Terrain resource information management 1: 20, 000 base map[EB/OL]. https://www2.gov.bc.ca/gov/content/data/geographic-data-services/topographic-data/terrain, 2019. [44] SWART L M T. Spectral filtering and oversampling for radar interferometry[D]. [Master dissertation], Delft University of Technology, 2000. -


计量
- 文章访问数:
- HTML全文浏览量:
- PDF下载量:
- 被引次数: 0

