
 作者中心
作者中心 专家审稿
专家审稿 责编办公
责编办公 编辑办公
编辑办公
Flooded Area Detection Method Based on Fusion of Optical and SAR Remote Sensing Images
-
摘要: 基于光学和合成孔径雷达(SAR)图像融合的洪灾区域检测方法可以全天候、高时效地检测洪灾区域。由于SAR图像中存在大量随机分布的相干斑噪声,传统洪灾区域检测方法的检测结果存在较高的虚警率。该文在模糊C均值聚类方法(FCM)的基础上提出了分级聚类算法(H-FCM),该方法将洪灾后的SAR图像与洪灾前的光学图像融合。基于融合图像,该方法利用提出的分级聚类模型获得洪灾区域的初步检测结果。此外,该算法在利用所提出的区域生长算法获得洪灾前河流位置后,将其作为初步检测结果的空间约束,进一步筛除疑似洪灾区域,并显著地提升了检测性能。该文的实验数据包括1999年英国格洛斯特洪灾前后的遥感图像和2019年中国南昌洪灾前后的遥感图像。通过对比实验,H-FCM算法的有效性得到验证。Abstract: The flooded area detection method based on the fusion of optical and Synthetic Aperture Radar (SAR) images is applicable for all weather conditions and times. However, due to the large number of randomly distributed intensive speckle noise in SAR images, the conventional methods of detection often trigger high false alarm rates at flood-stricken zones. Inspired by the Fuzzy C-Means (FCM) clustering method, a hierarchical clustering algorithm (Hierarchical Fuzzy C-Means, H-FCM) is proposed in this paper. This method fuses the SAR image captured after the flood with the optical image captured before the flood. Based on the fused image, this method uses the proposed hierarchical clustering model to obtain the preliminary detection results of the flooded area. Additionally, the algorithm uses the proposed region-growing algorithm to obtain the river location before the flood and uses it as a spatial constraint for the preliminary detection results to further screen out suspected flooded areas and significantly improve detection performance. The experimental data used in this paper include the remote sensing images captured before and after the Gloucester floods in the United Kingdom in 1999, as well as the remote sensing images captured before and after the Nanchang floods in China in 2019. The effectiveness and validity of the H-FCM algorithm are also supported by comparison experiments.
-
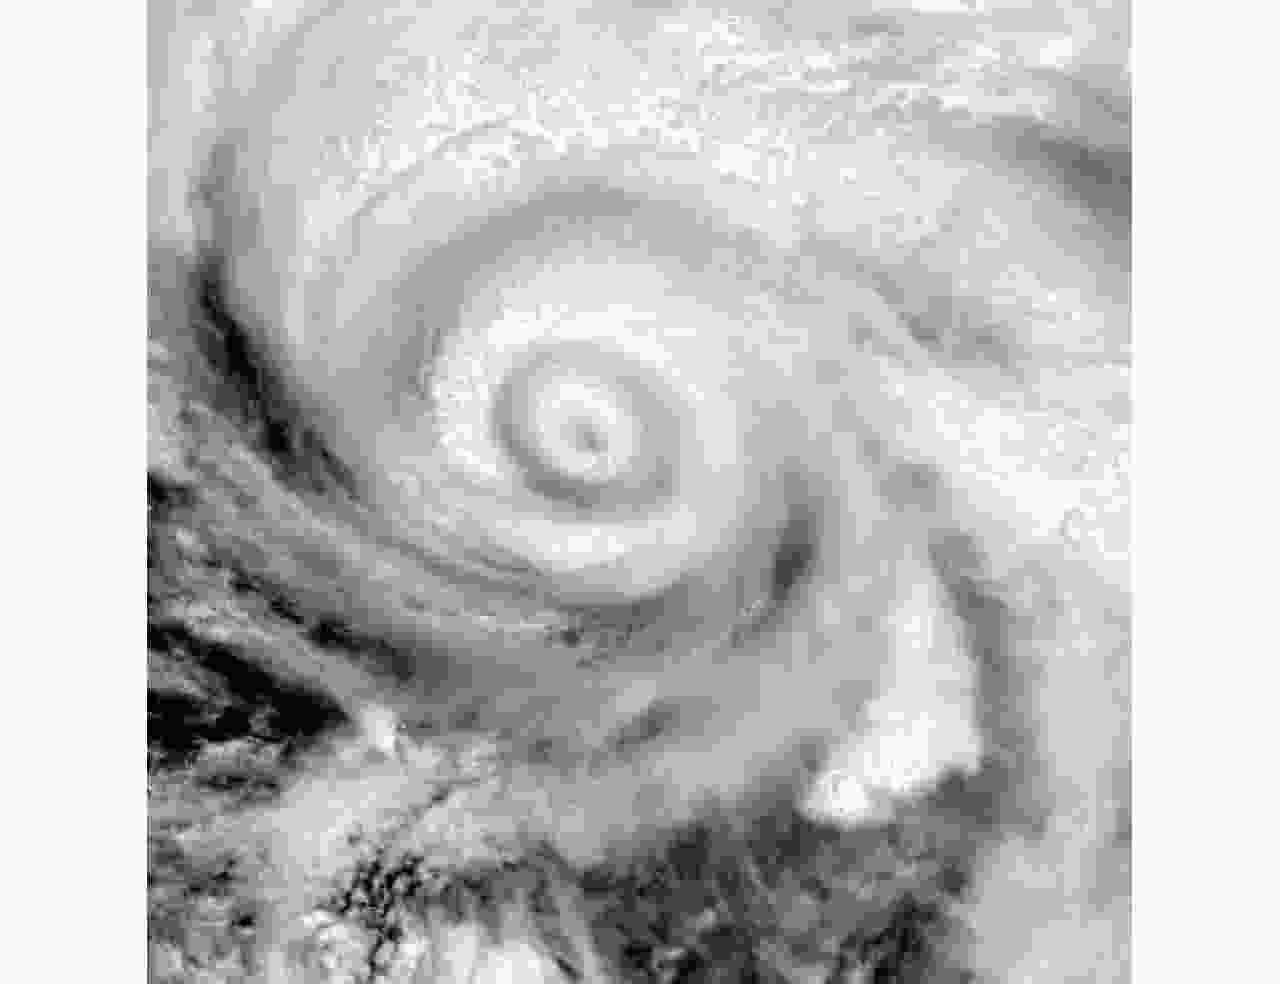
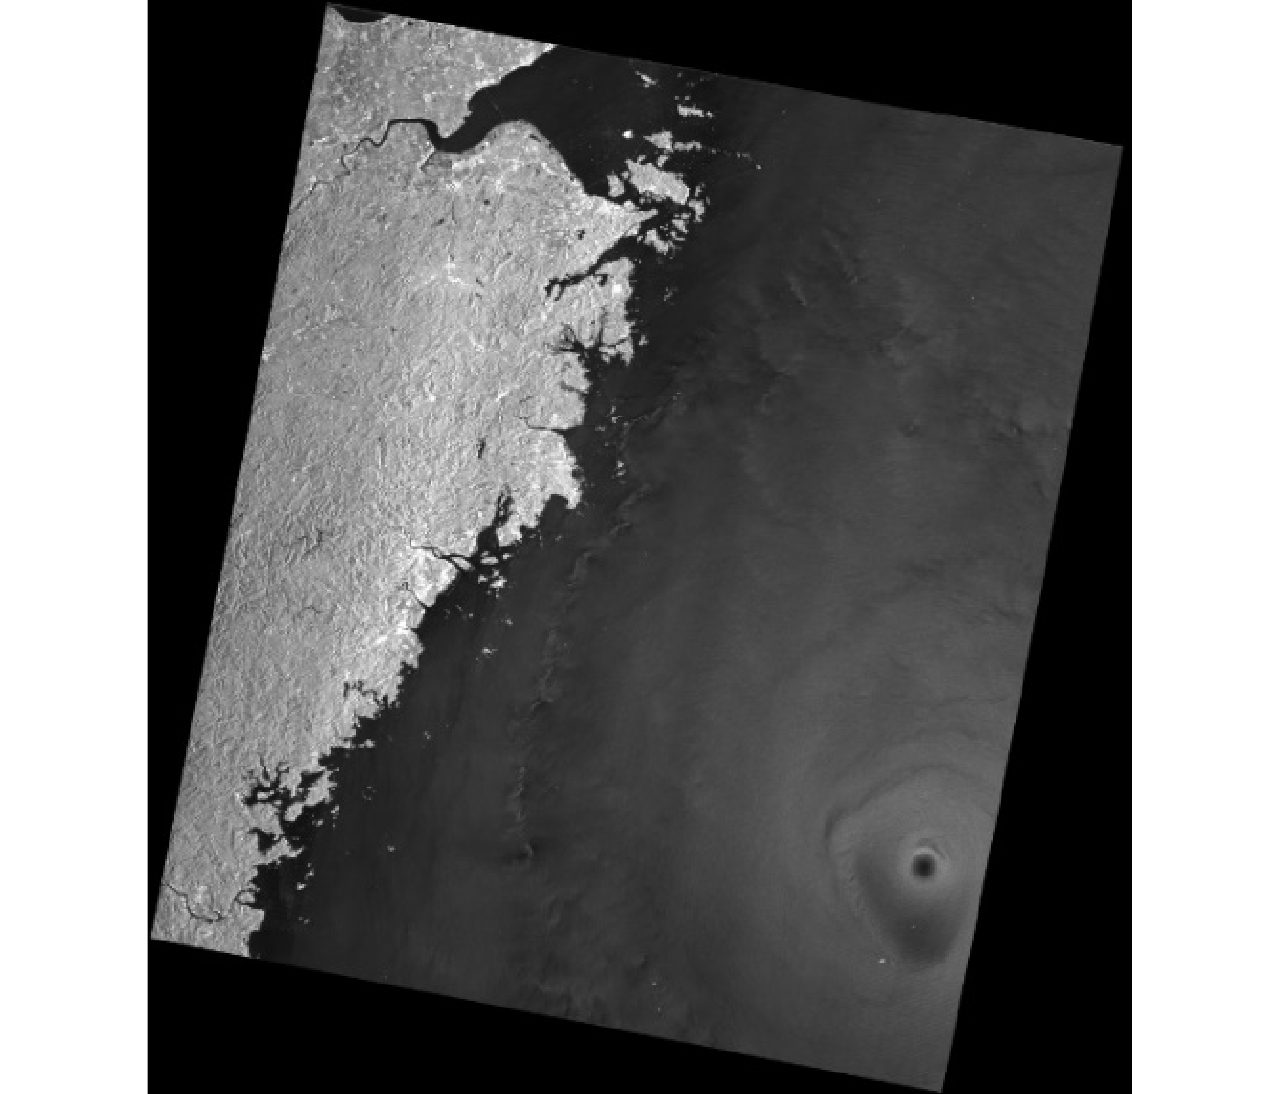
图 1 利奇马台风的GF4图像(资源卫星中心)
Figure 1. The GF4 image of Typhoon Lekima (Resource Satellite Centre)
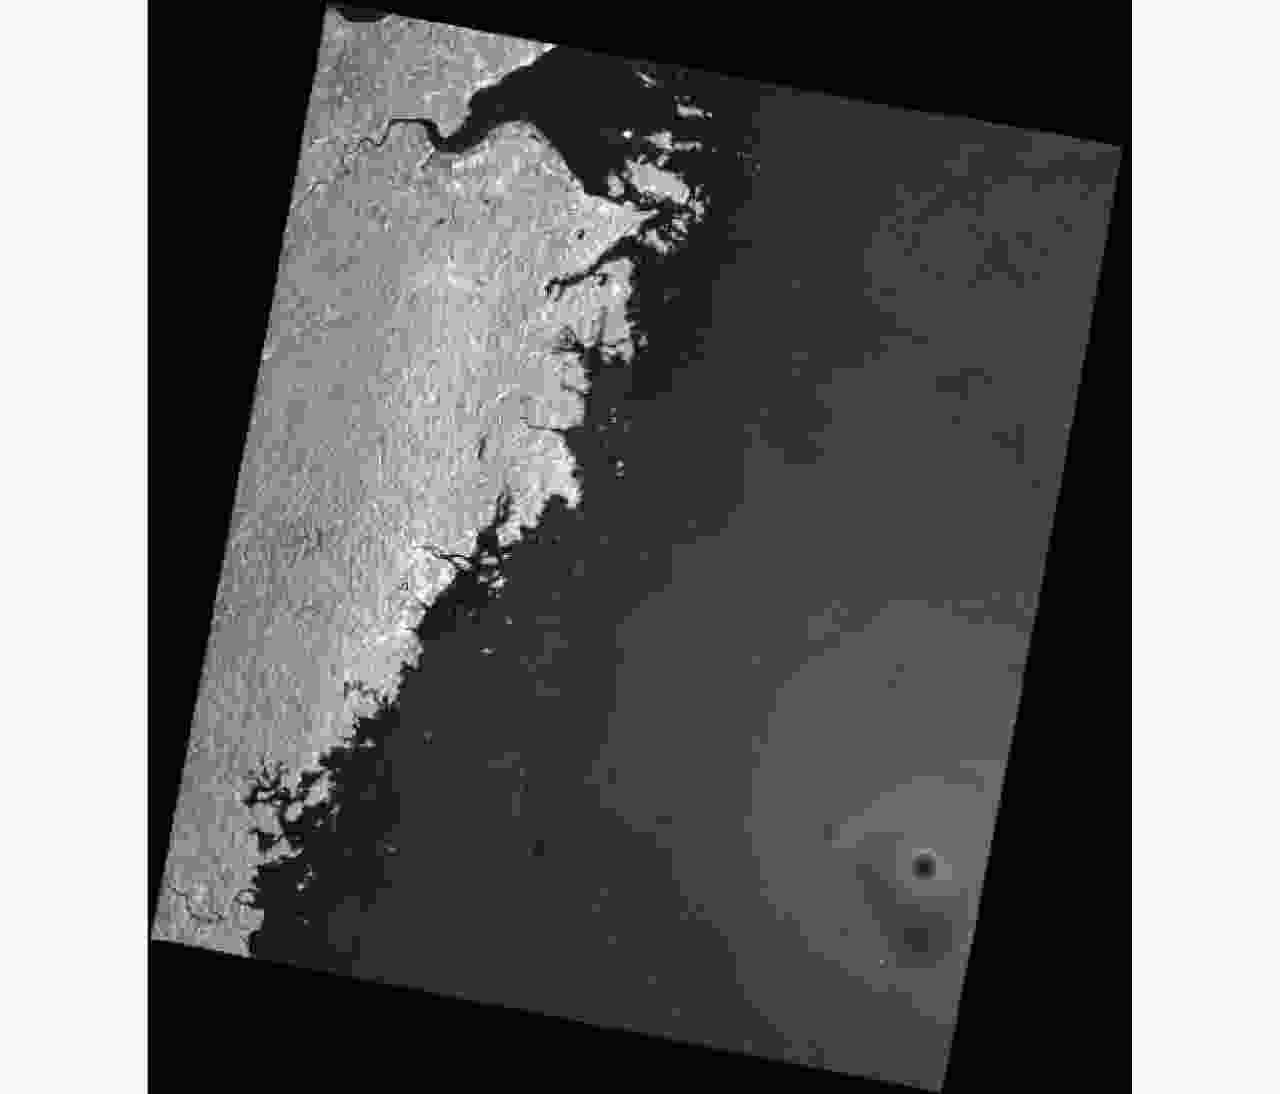
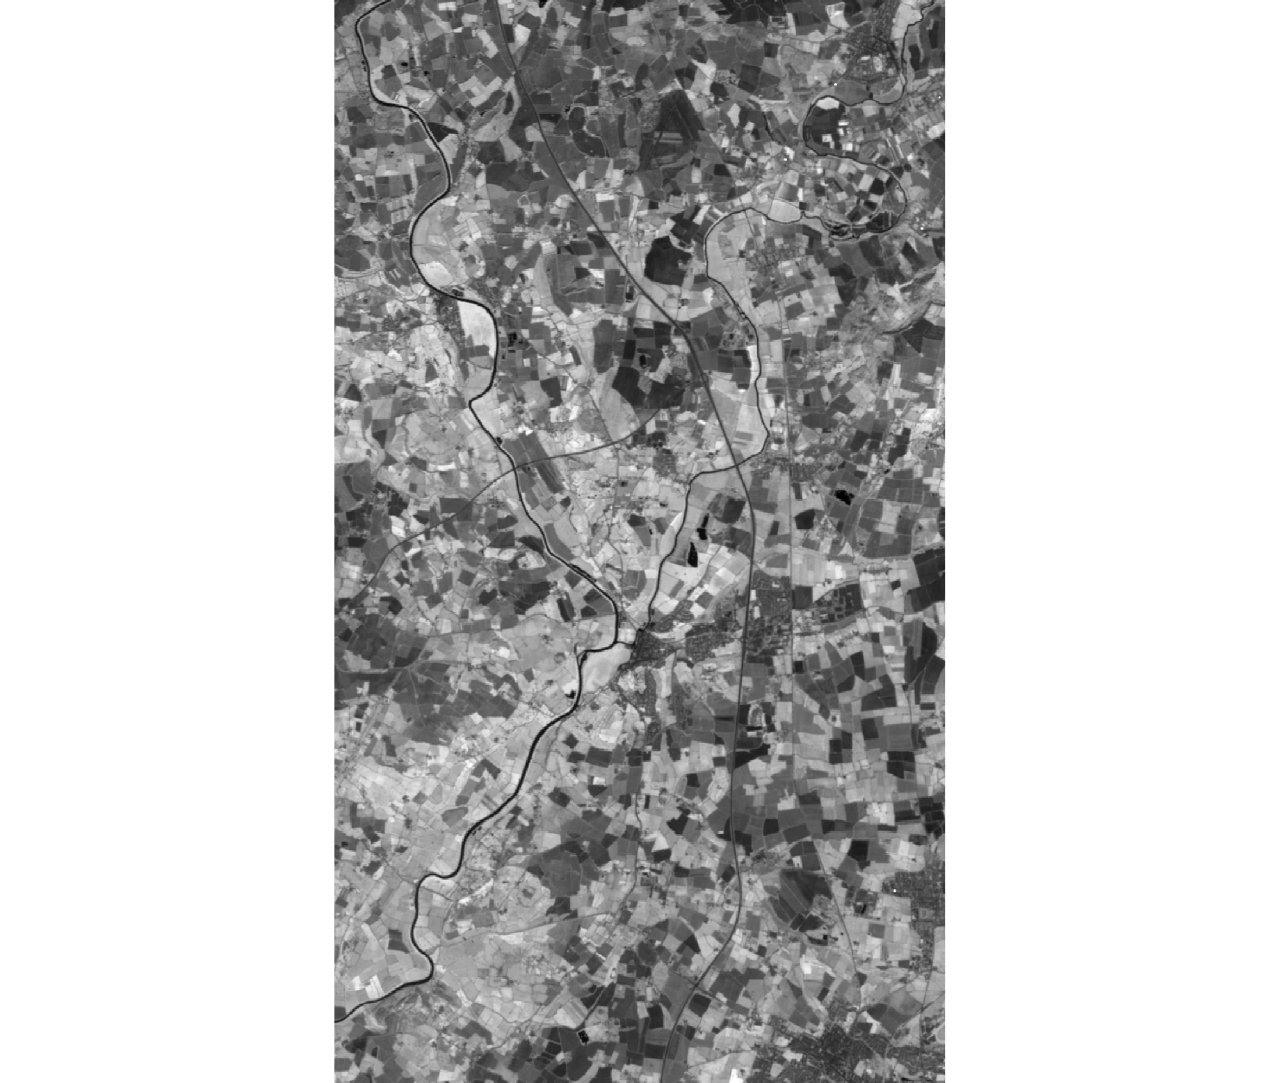
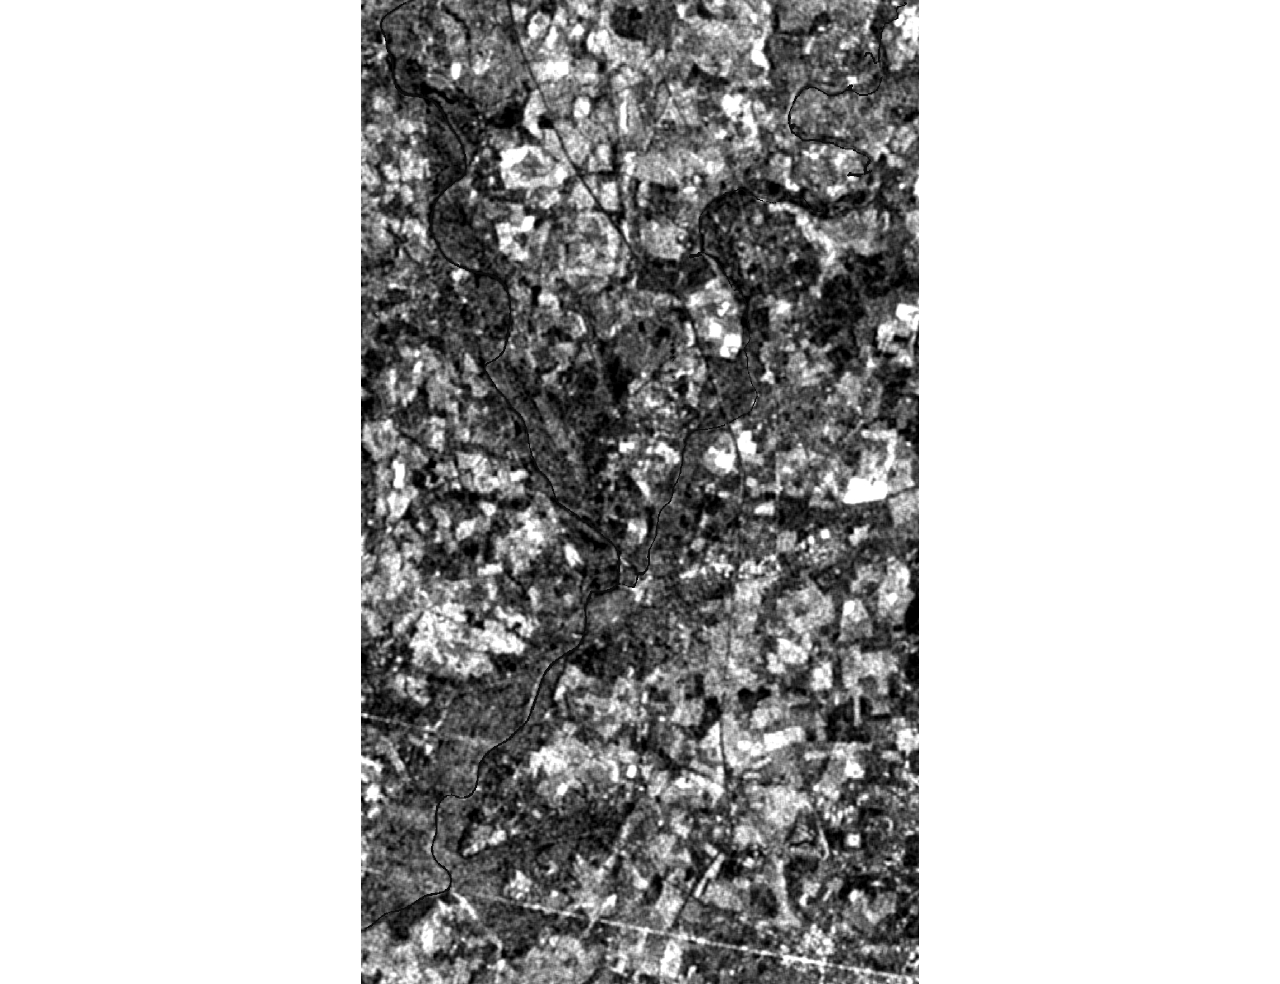
图 2 利奇马台风的GF3图像(资源卫星中心)
Figure 2. The GF3 image of Typhoon Lekima (Resource Satellite Centre)
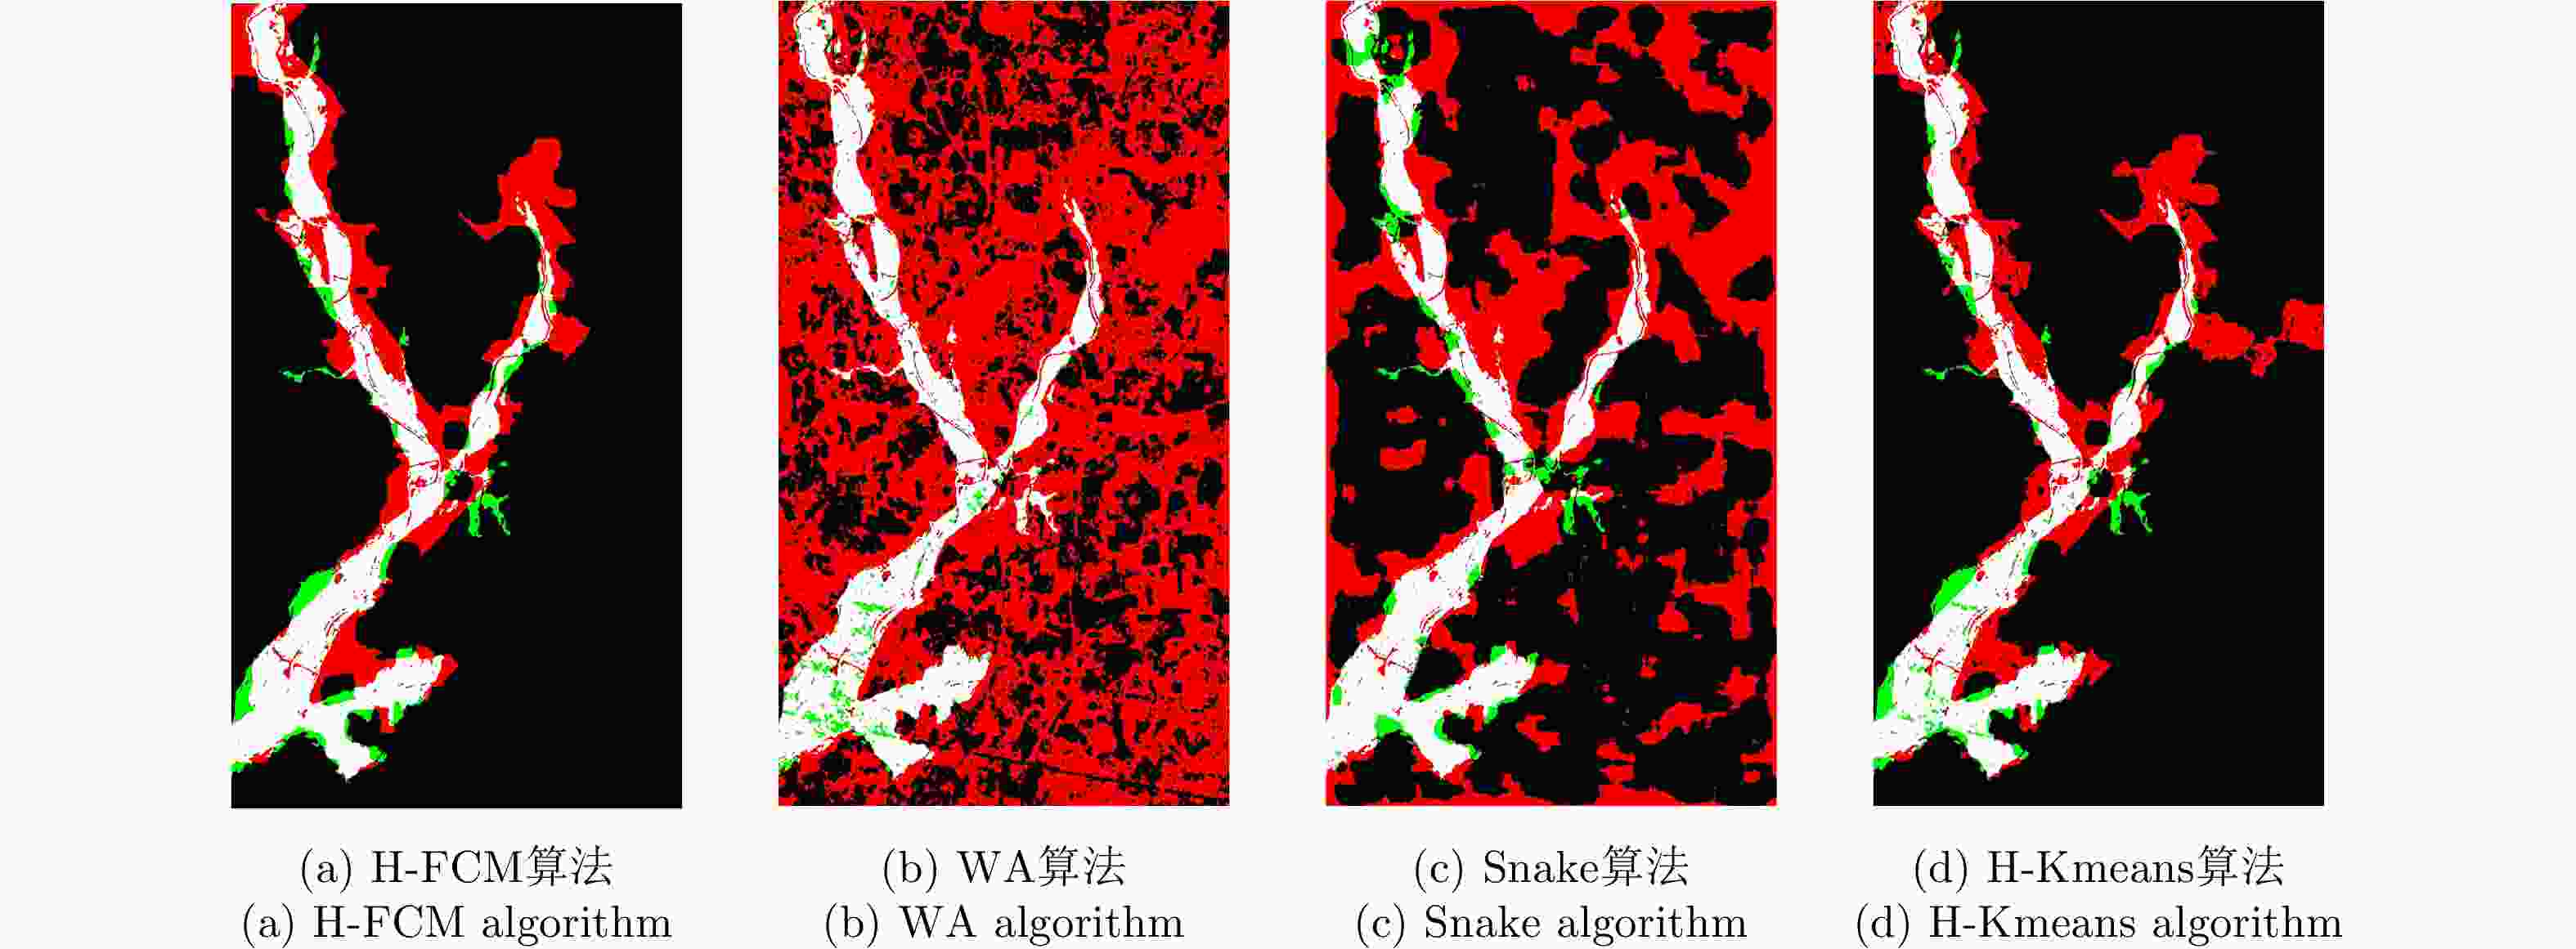
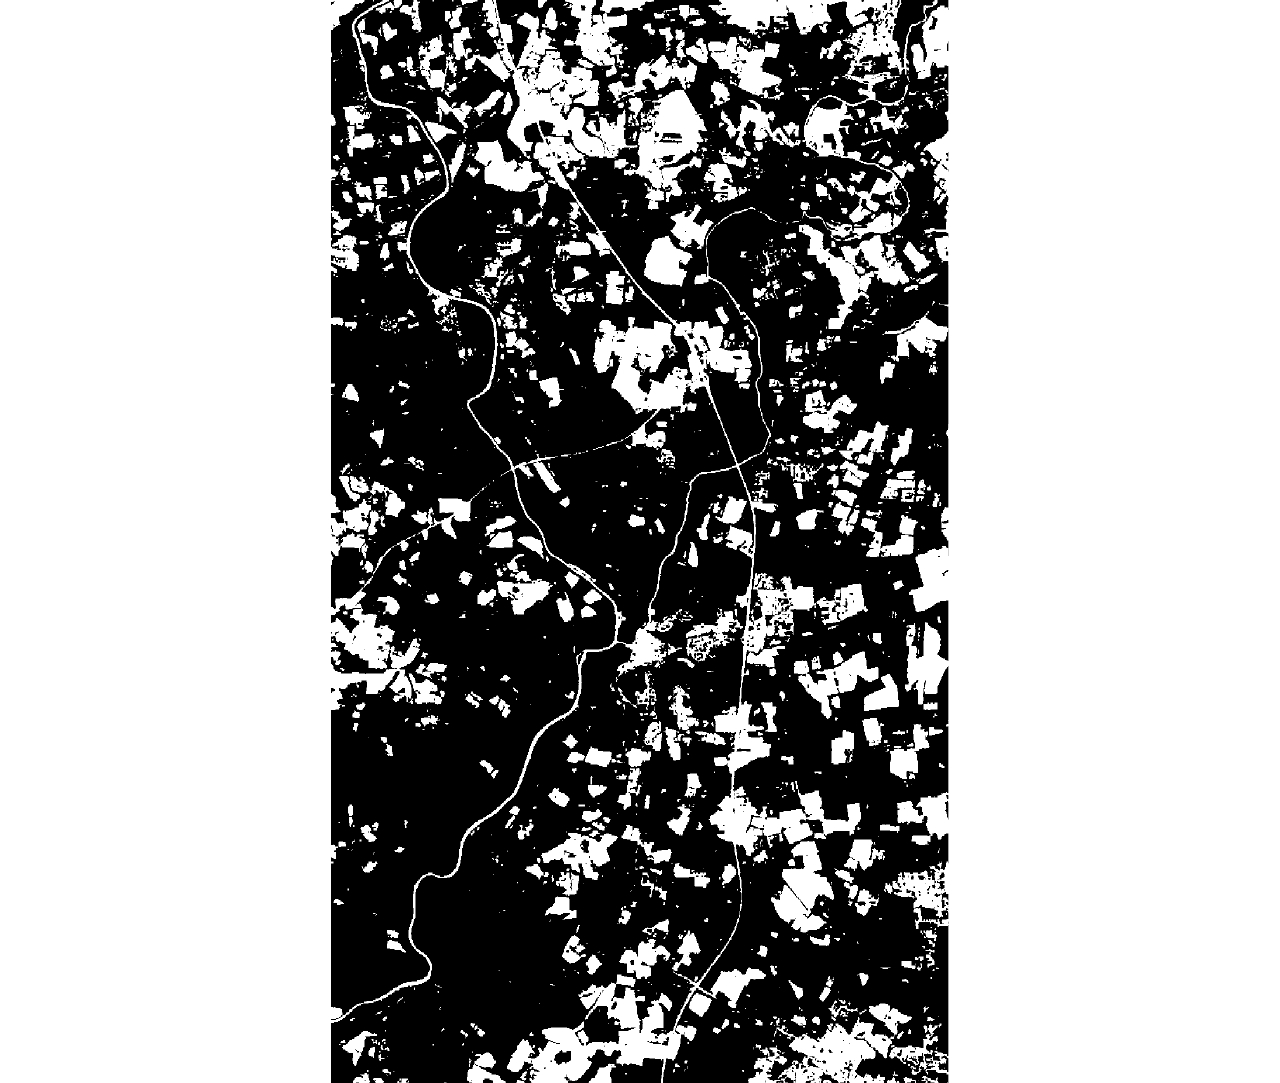
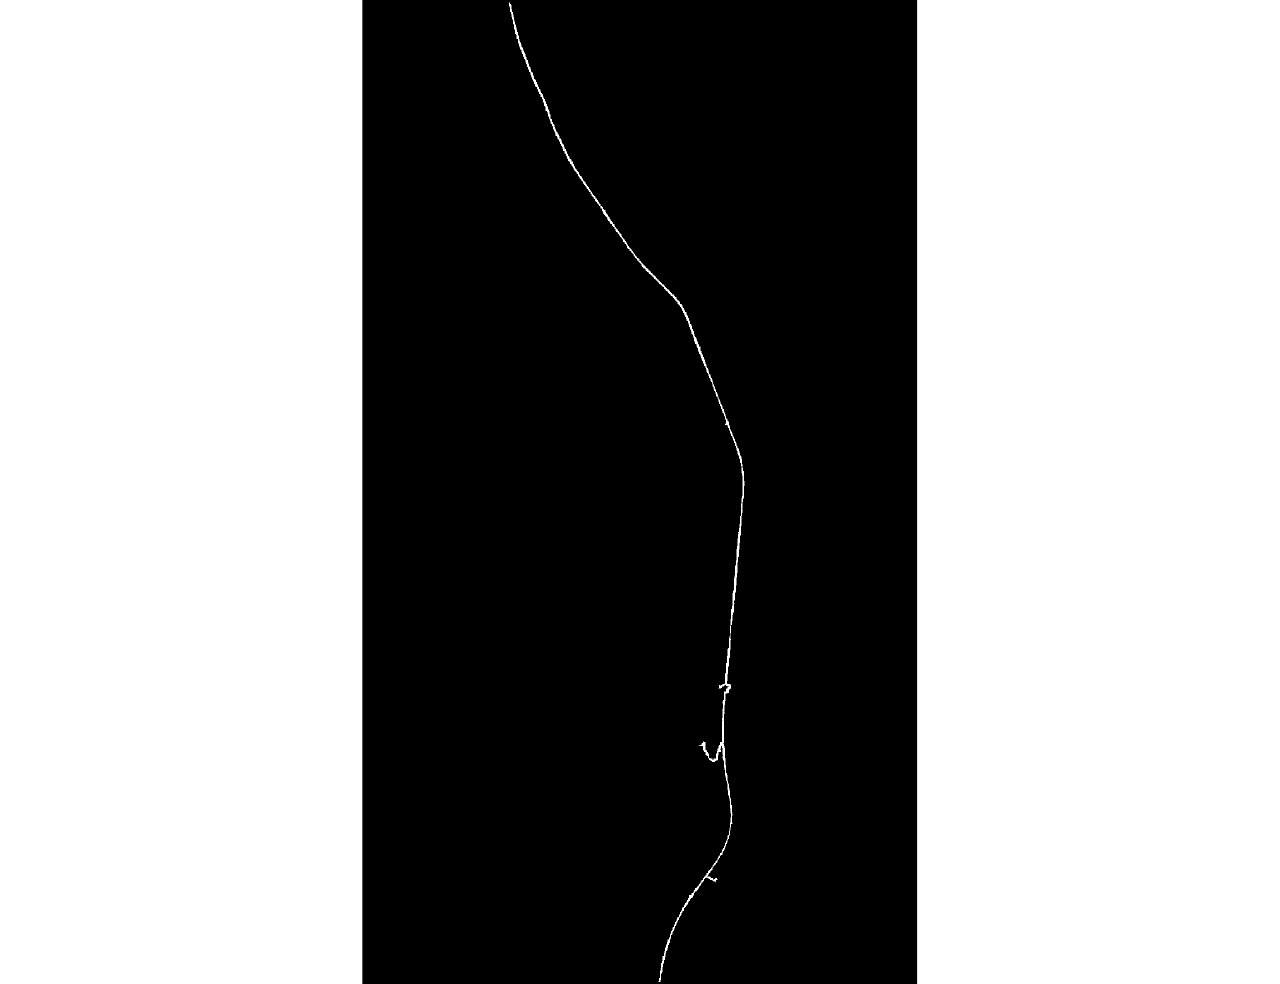
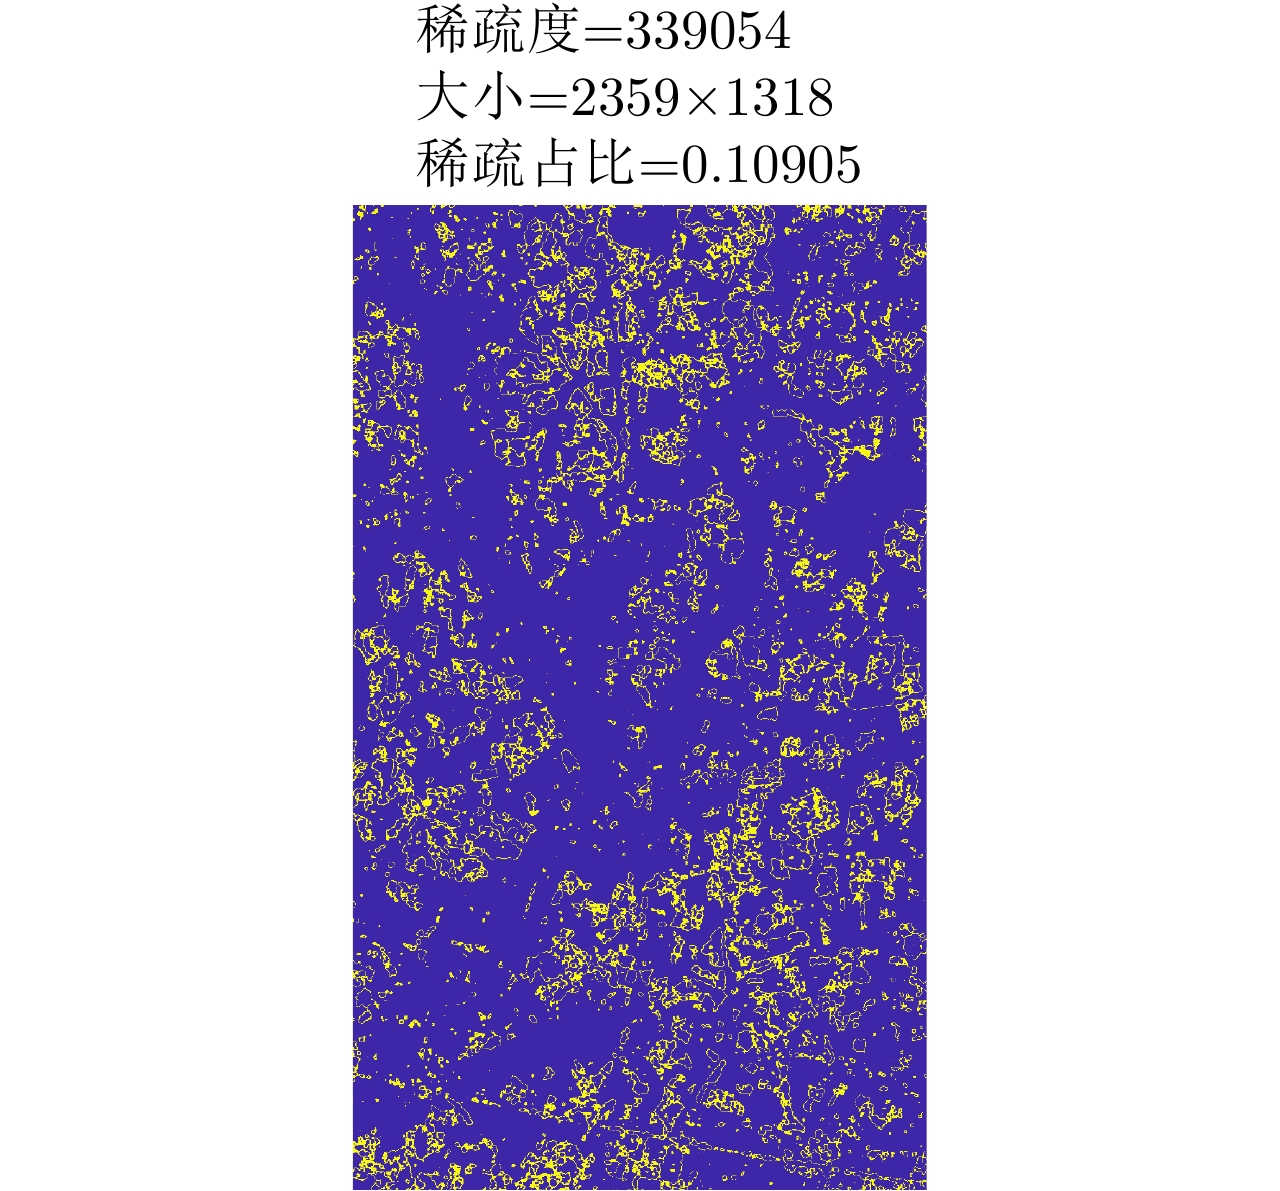
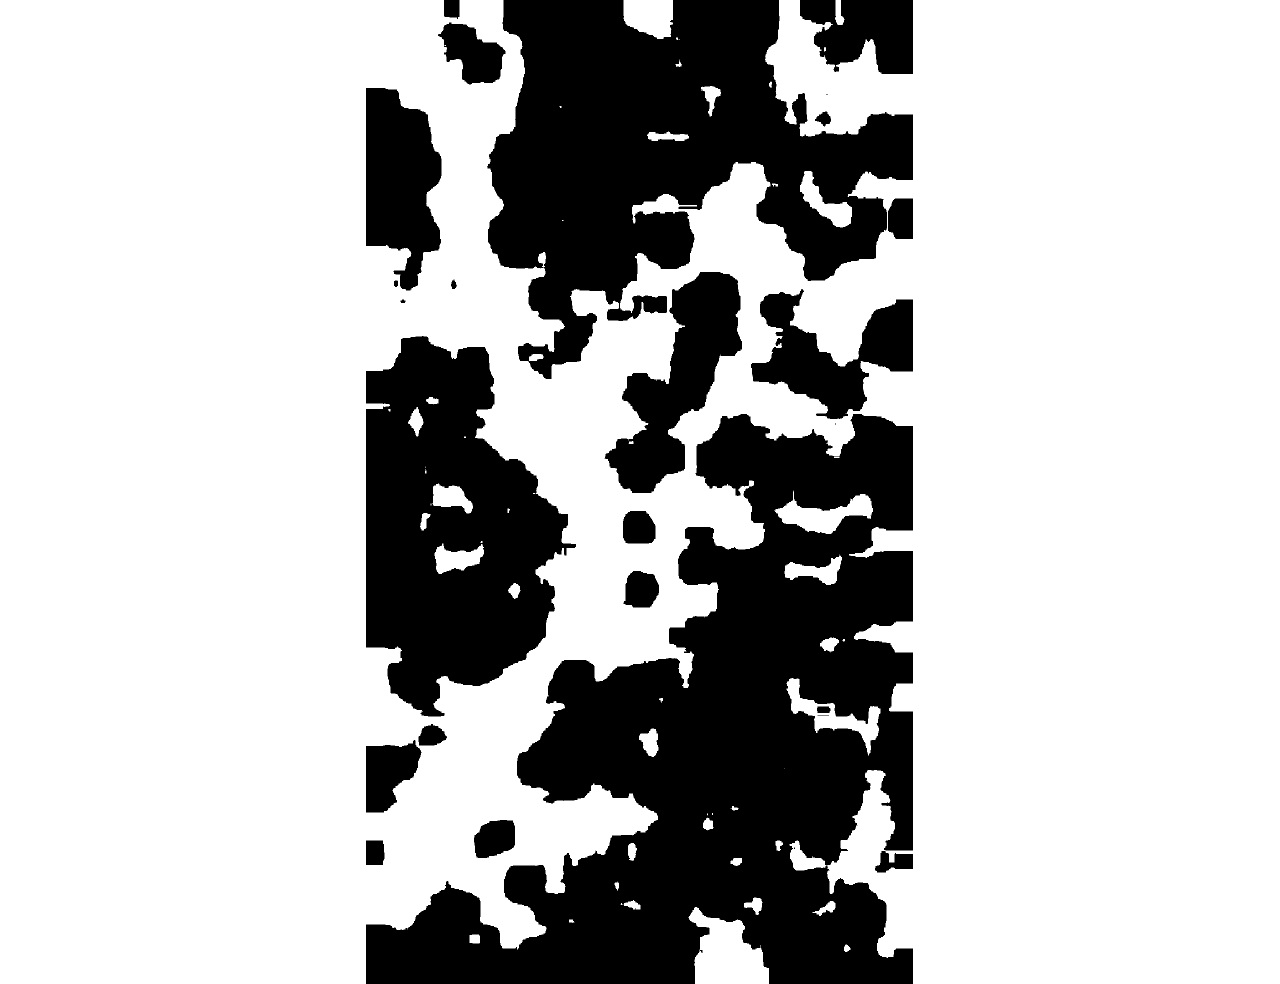
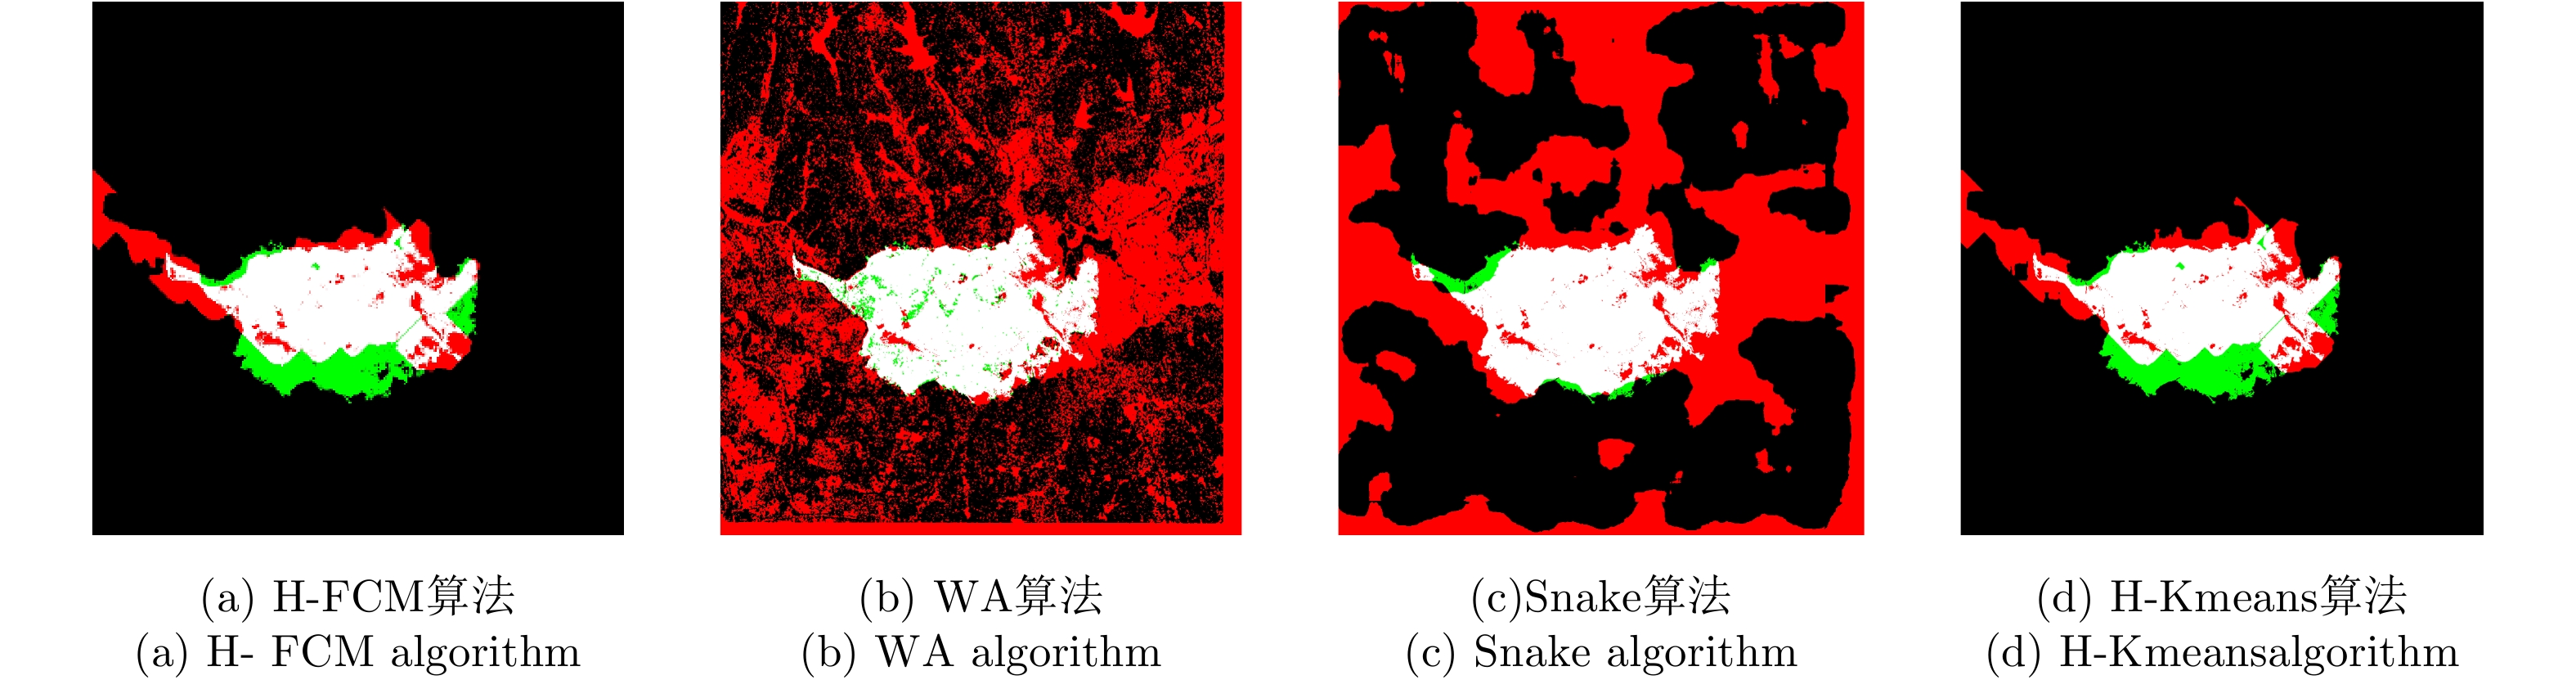
图 26 4种算法的洪灾区域检测结果
Figure 26. Detection results of flooded area based on four algorithms

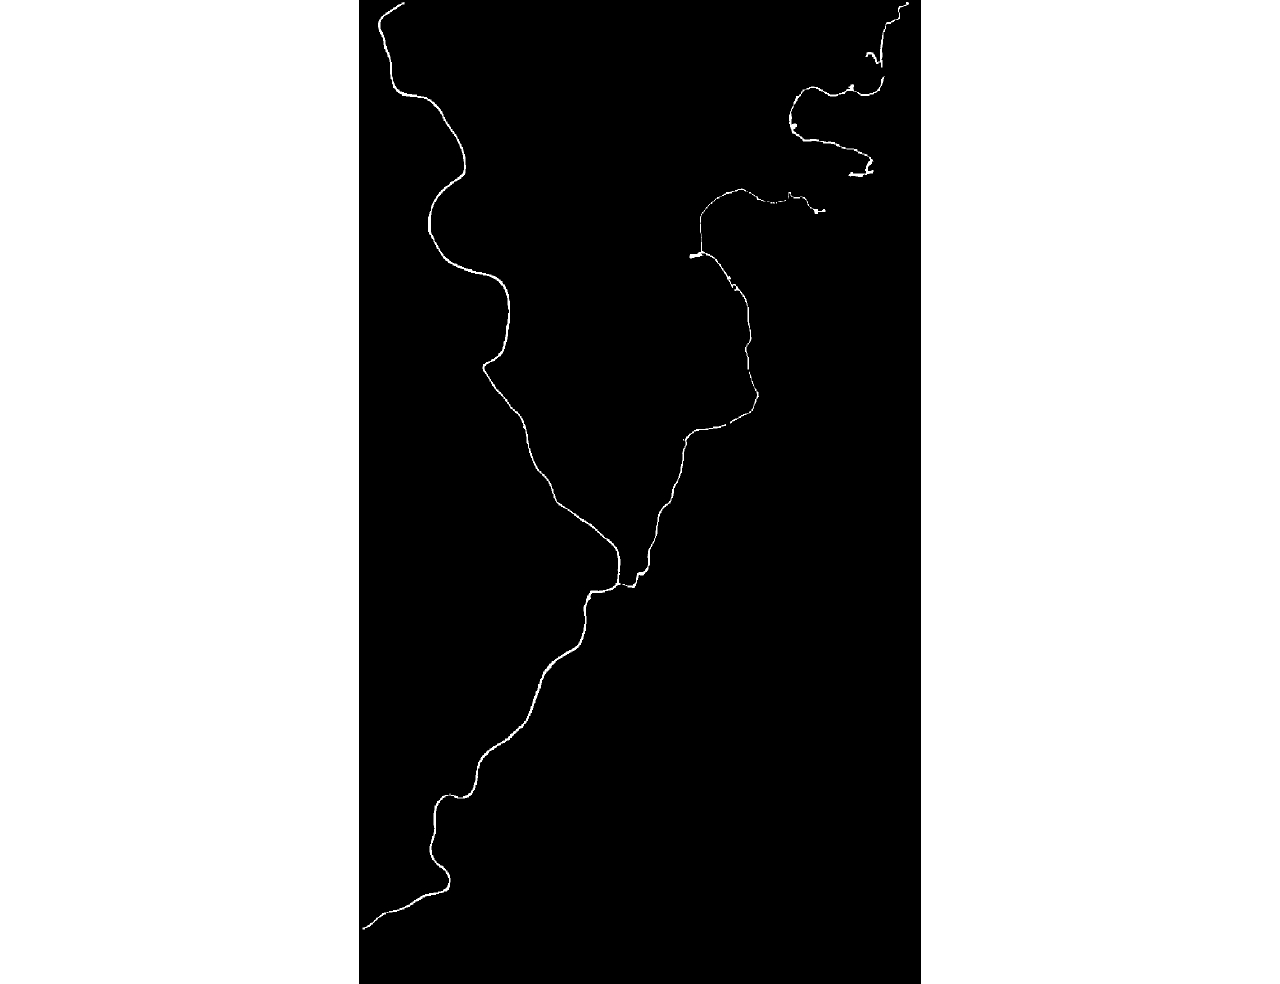
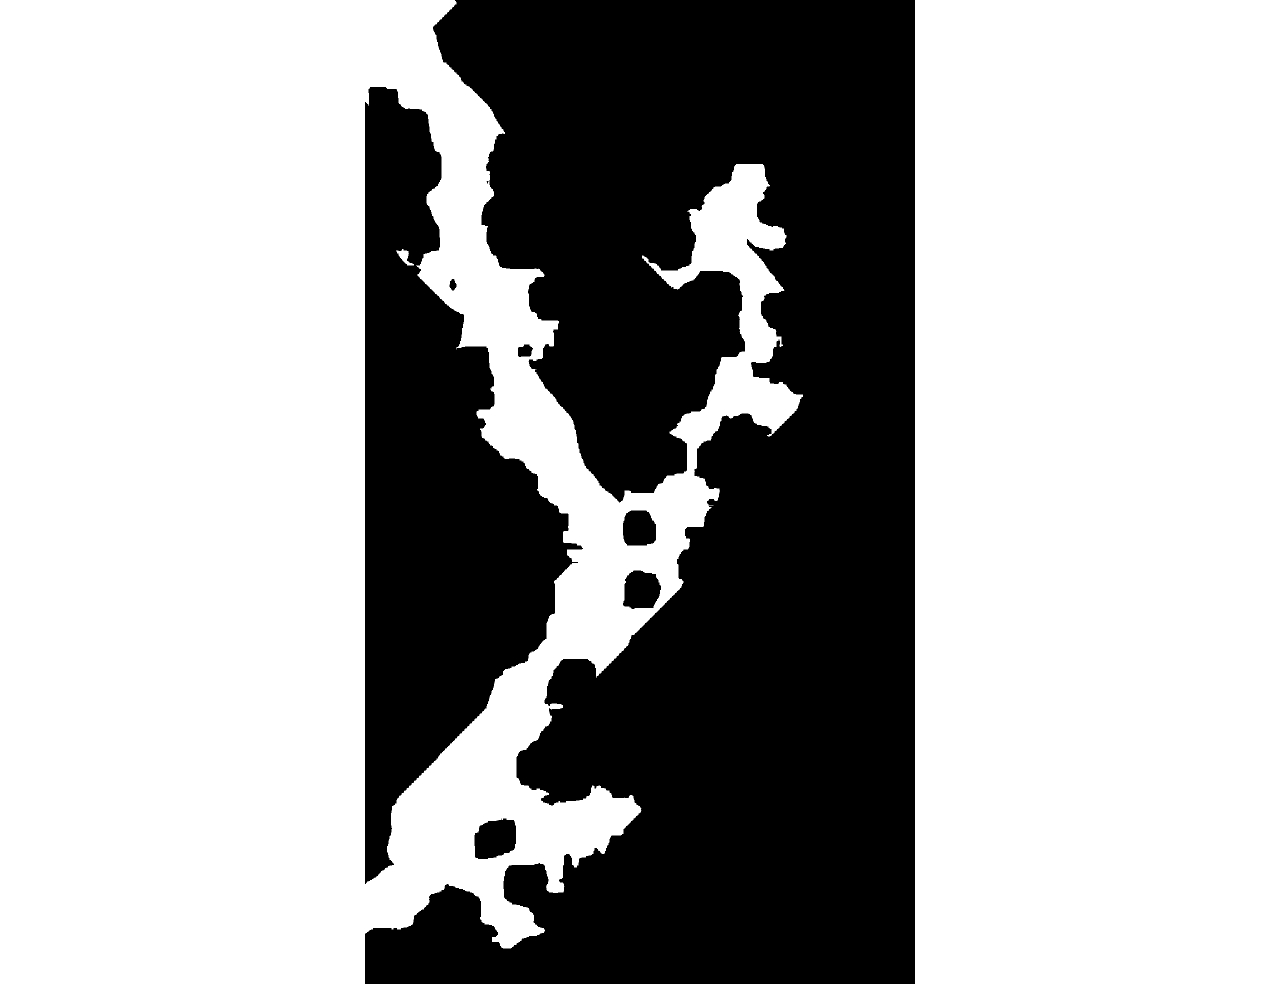
图 29 4种算法的洪灾区域检测结果
Figure 29. Detection results of flooded area based on four algorithms
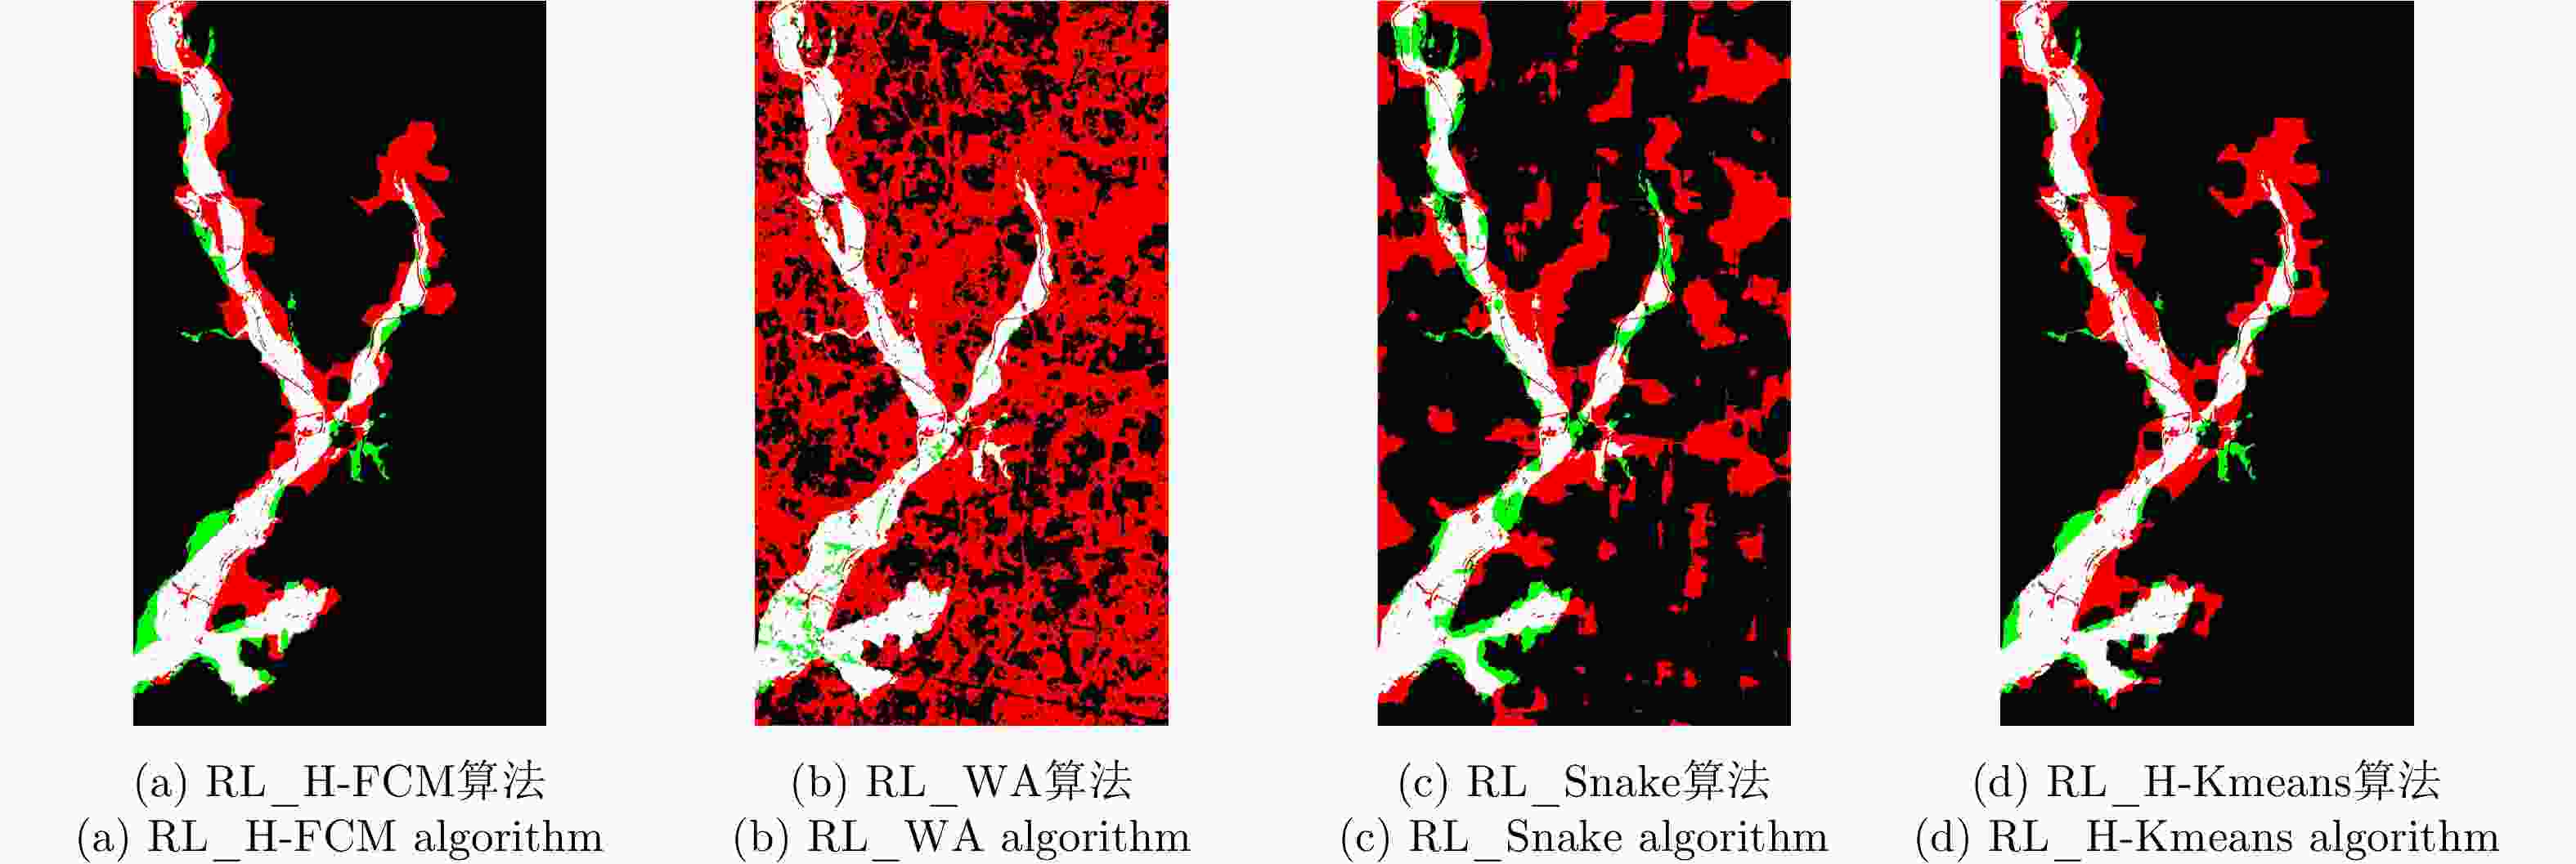
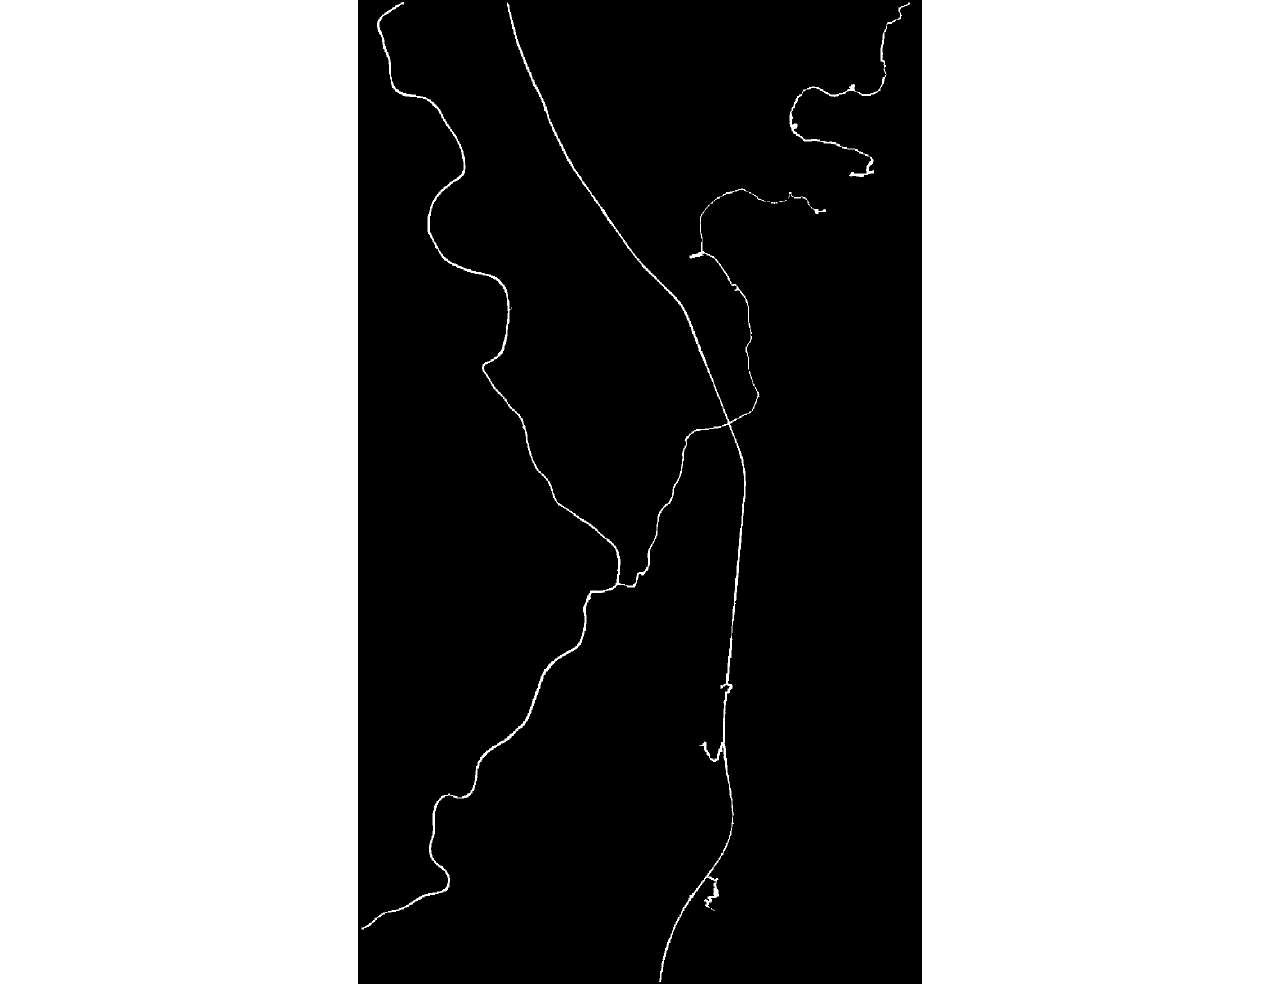
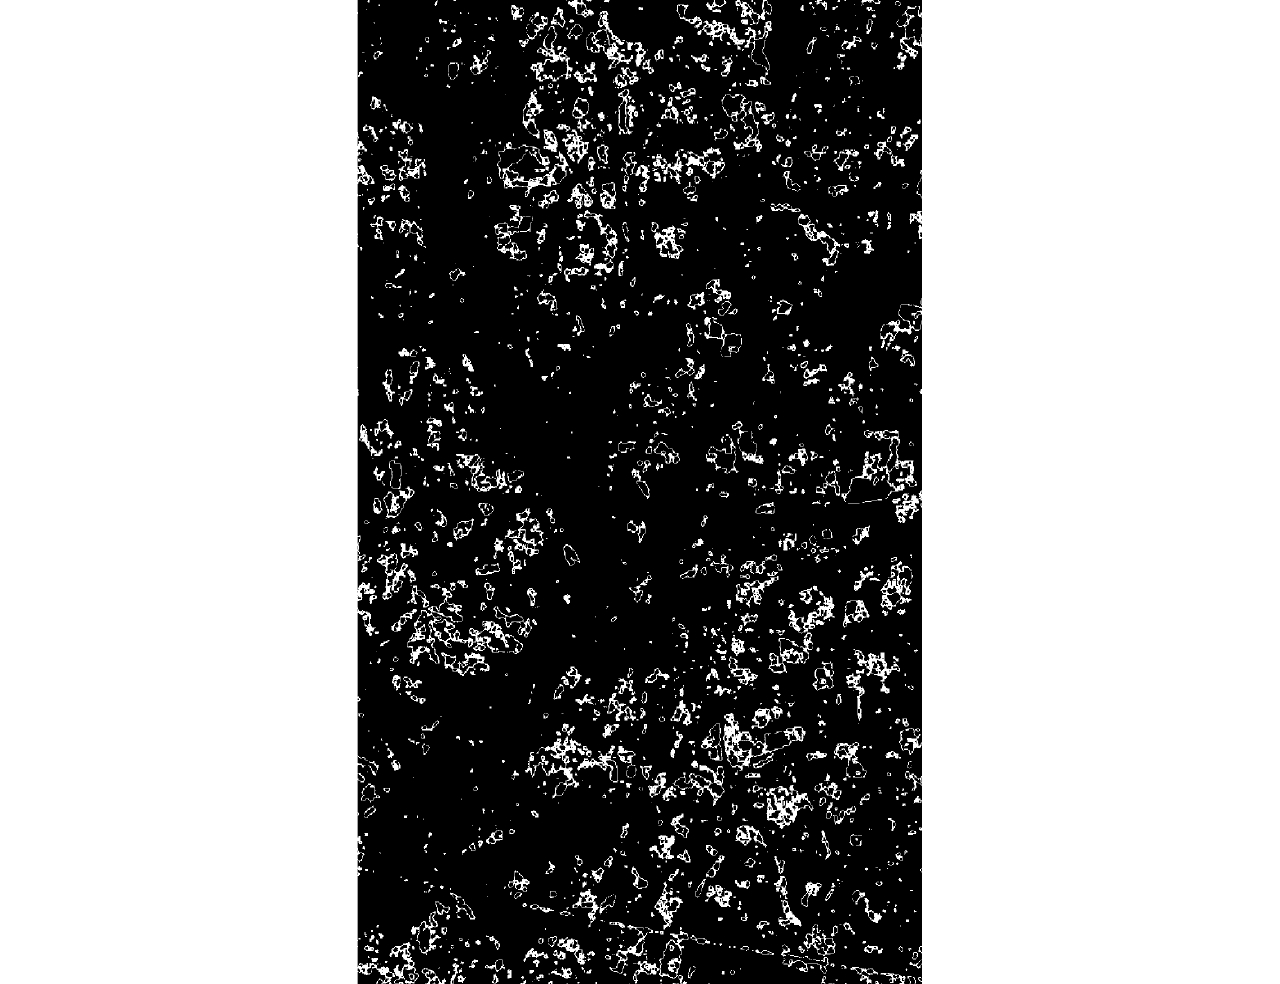
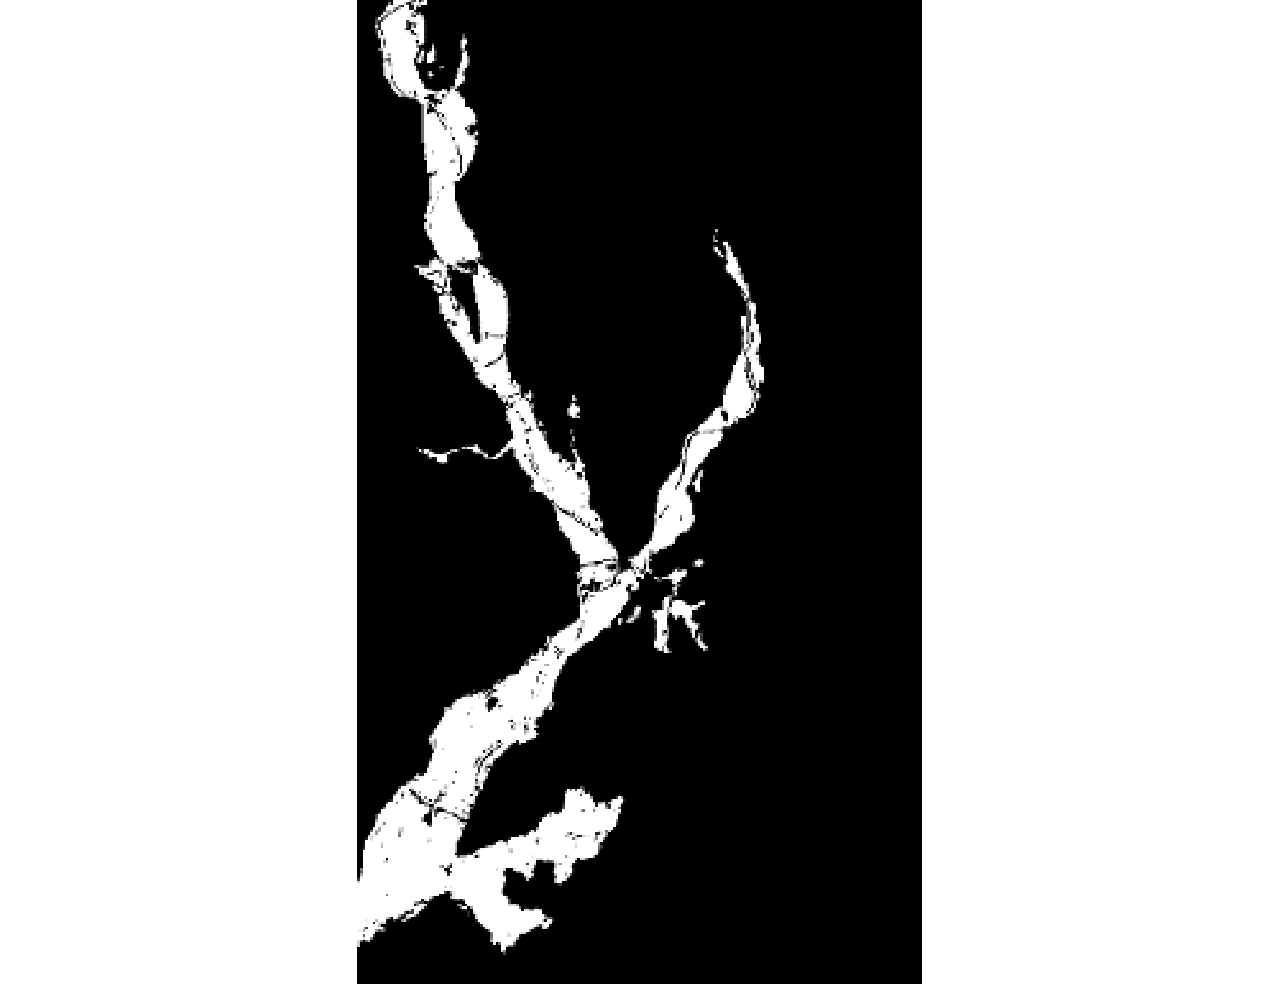
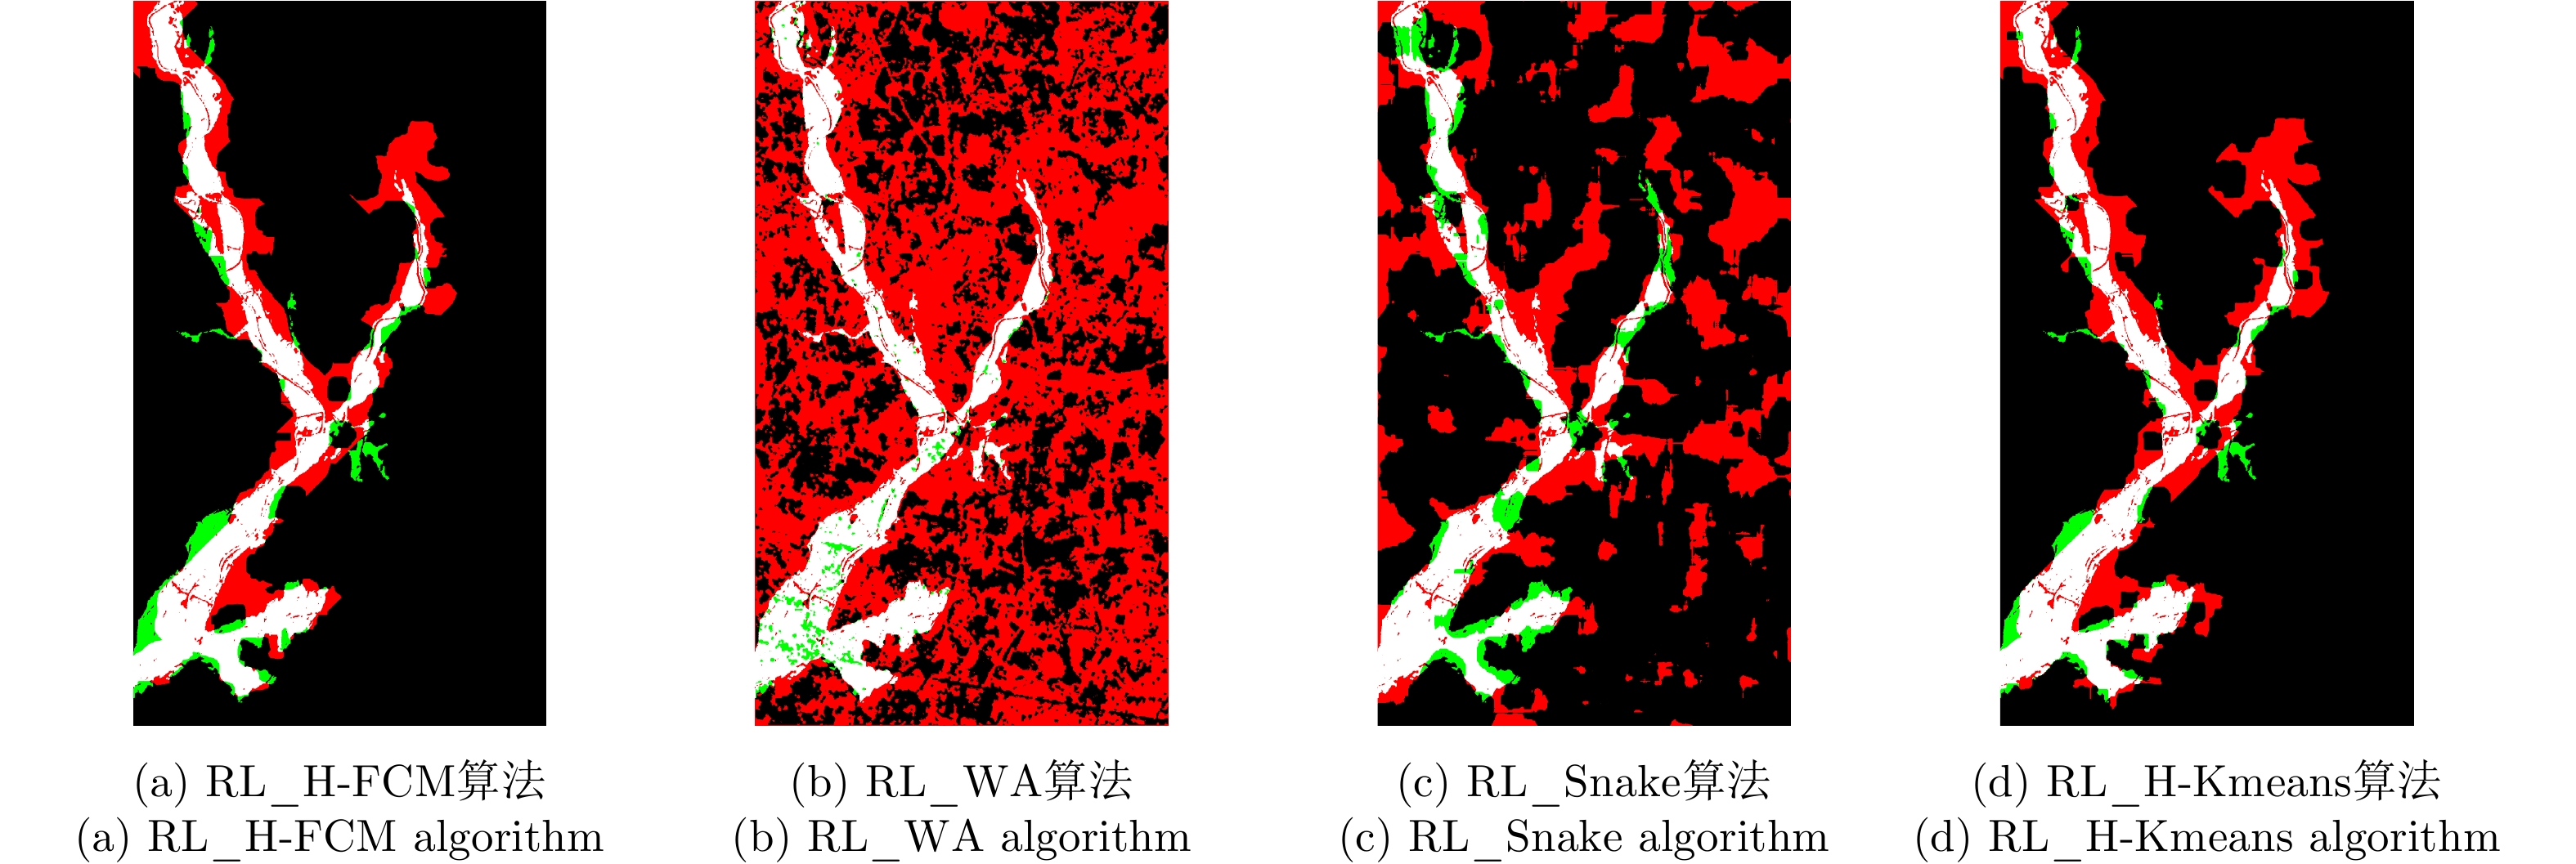
图 30 RL滤波后4种算法的洪灾区域检测结果
Figure 30. Detection results of flooded area based on four algorithms after RL filtering
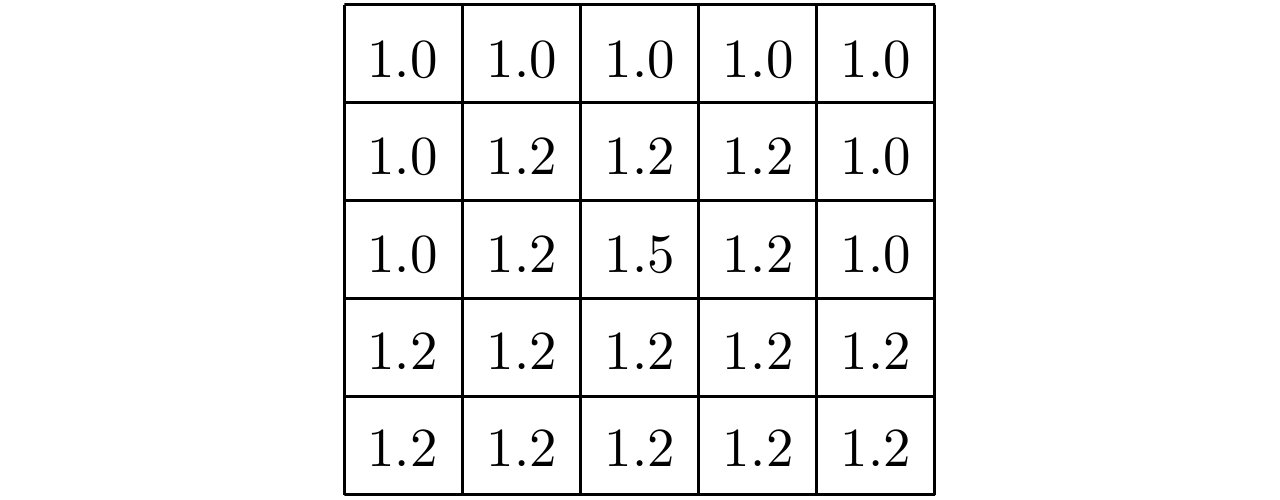
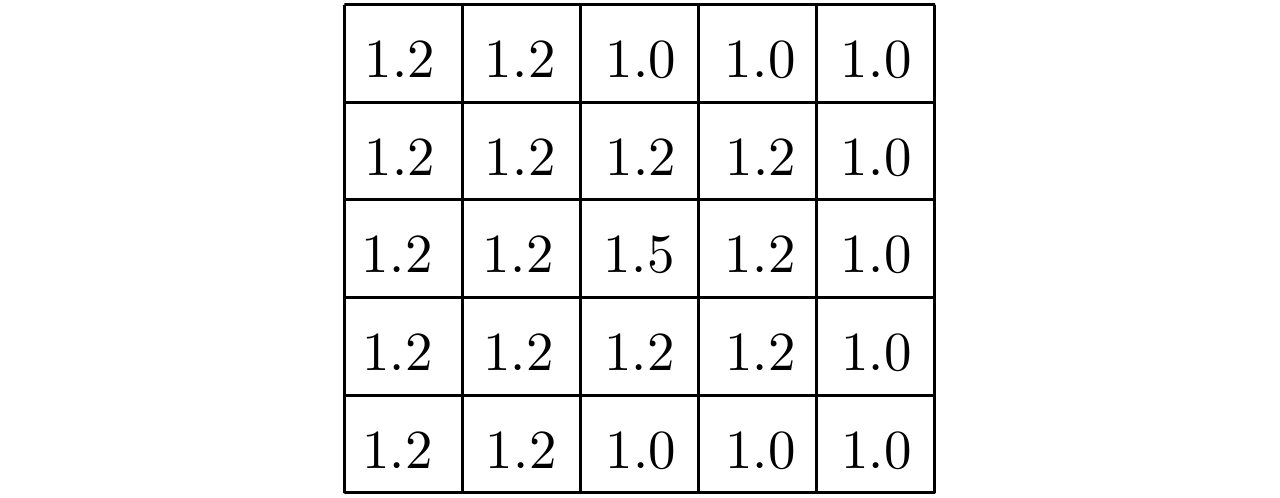
表 1 FCM算法
Table 1. FCM algorithm
(1) 给定聚类中心数目c,隶属度因子m,迭代次数t; (2) 初始化和为1的隶属度矩阵U; (3) 由式(4)确定c个聚类中心Ci; (4) 计算目标函数J的值; (5) 将Ci代入式(3),更新隶属度矩阵U; (6)重复步骤(3)—步骤(5),迭代次数为t。  下载: 导出CSV
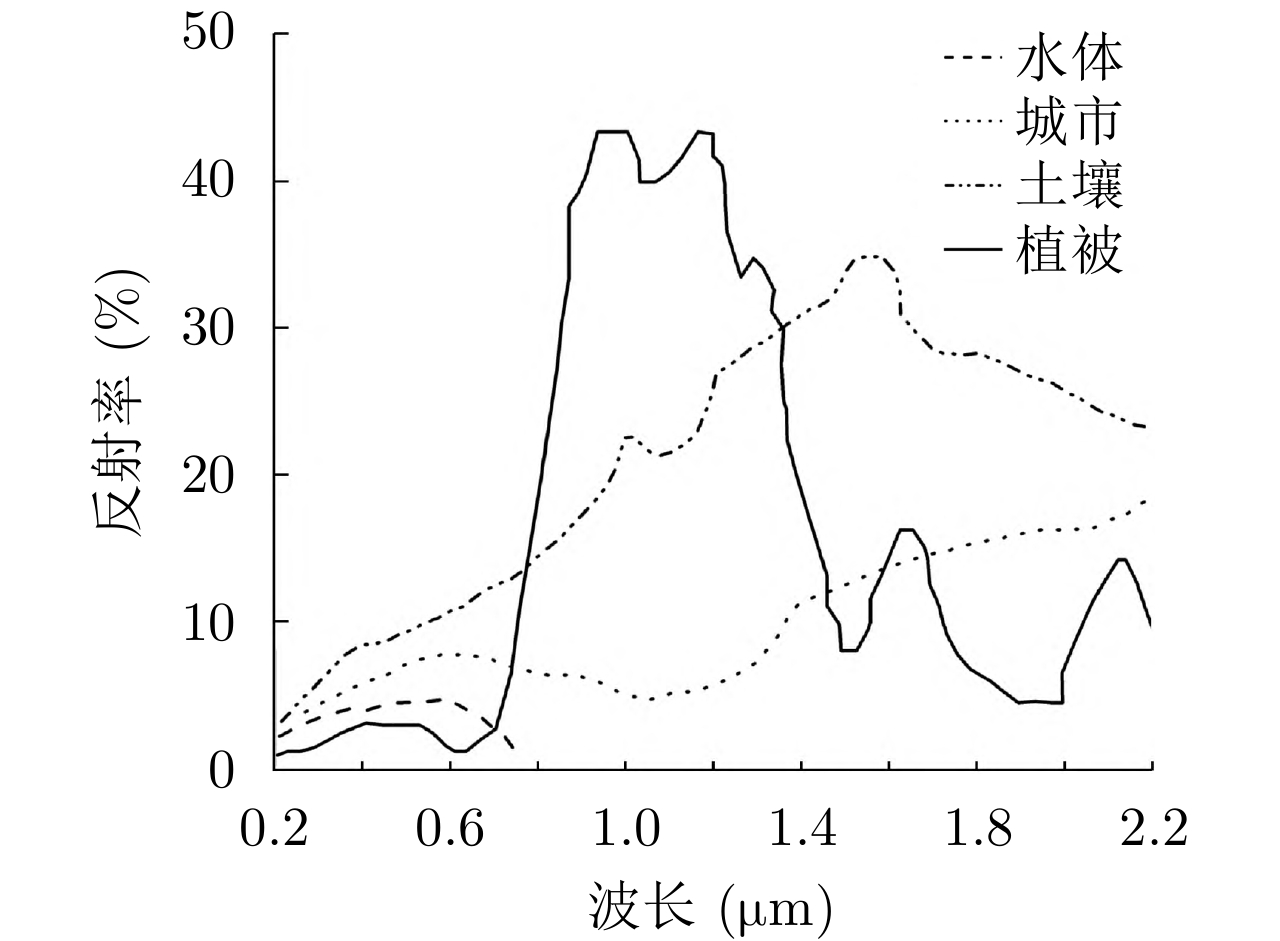
表 3 融合后SAR图像洪灾区域的检测结果
Table 3. Detection results of flooded area in fusioned SAR image
方法 H-FCM WA Snake H-Kmeans Righta 0.8946 0.4346 0.6757 0.8837 Missa 0.1523 0.0680 0.1607 0.1519 Wra 0.2513 0.7001 0.5070 0.2634 Kappa 0.6092 0.1840 0.2964 0.5837 Time(s) 51.98 2.72 2.53 73.27 Iter(次) 25 1 1 25
下载: 导出CSV
表 4 融合后SAR图像洪灾区域的检测结果
Table 4. Detection results of flooded area in the fusioned SAR image
方法 H-FCM WA Snake H-Kmeans Righta 0.9414 0.6230 0.6426 0.9391 Missa 0.2520 0.0555 0.0608 0.2434 Wra 0.2886 0.4690 0.4518 0.2836 Kappa 0.6911 0.2629 0.2749 0.6848 Time(s) 30.59 2.82 3.14 79.13 Iter(次) 25 1 1 25
下载: 导出CSV
表 5 RL滤波后SAR图像的洪灾区域检测结果
Table 5. Detection results of flooded area in the SAR image after RL filtering
方法 RL_H-FCM RL_WA RL_Snake RL_H-Kmeans Righta 0.8996 0.4391 0.7615 0.8899 Missa 0.1750 0.0660 0.2598 0.1351 Wra 0.2653 0.6933 0.4954 0.2418 Kappa 0.6147 0.1863 0.3460 0.6032 Time(s) 646.04 593.72 593.59 745.62 Iter(次) 25 1 1 25
下载: 导出CSV
-
[1] SABINS F F. Remote sensing for mineral exploration[J]. Ore Geology Reviews, 1999, 14(3/4): 157–183. doi: 10.1016/S0169-1368(99)00007-4 [2] 解金卫, 李真芳, 王帆, 等. 基于幅相不一致准则的建筑物SAR层析成像[J]. 雷达学报, 2020, 9(1): 154–165. doi: 12000/JR19062.XIE Jinwei, LI Zhenfang, WANG Fan, et al. SAR tomography imaging for buildings using an inconsistency criterion for amplitude and phase[J]. Journal of Radars, 2020, 9(1): 154–165, doi: 12000/JR19062. [3] BERNI J A J, ZARCO-TEJADA P J, SUÁREZ L, et al. Thermal and narrowband multispectral remote sensing for vegetation monitoring from an unmanned aerial vehicle[J]. IEEE Transactions on Geoscience and Remote Sensing, 2009, 47(3): 722–738. doi: 10.1109/TGRS.2008.2010457 [4] SAWAYA K E, OLMANSON L G, HEINERT N J, et al. Extending satellite remote sensing to local scales: Land and water resource monitoring using high-resolution imagery[J]. Remote Sensing of Environment, 2003, 88(1/2): 144–156. doi: 10.1016/j.rse.2003.04.006 [5] DONG Laigen and SHAN Jie. A comprehensive review of earthquake-induced building damage detection with remote sensing techniques[J]. ISPRS Journal of Photogrammetry and Remote Sensing, 2013, 84: 85–99. doi: 10.1016/j.isprsjprs.2013.06.011 [6] SANYAL J and LU X X. Application of remote sensing in flood management with special reference to monsoon Asia: A review[J]. Natural Hazards, 2004, 33(2): 283–301. doi: 10.1023/B:NHAZ.0000037035.65105.95 [7] 吴一全, 王志来. 基于联合稀疏表示的复Contourlet域SAR图像与红外图像融合(英文)[J]. 雷达学报, 2017, 6(4): 349–358. doi: 10.12000/JR17019WU Yiquan and WANG Zhilai. SAR and infrared image fusion in complex contourlet domain based on joint sparse representation[J]. Journal of Radars, 2017, 6(4): 349–358. doi: 10.12000/JR17019 [8] BELL J R, SCHULTZ L A, JONES M, et al. Using optical remote sensing and synthetic aperture radar for near-real-time response to the central U.S. flooding in April-May 2017[C]. The 98th 2018 American Meteorological Society Meeting, Austin, Texas, 2018. [9] KUSSUL N, SHELESTOV A, and SKAKUN S. Flood Monitoring from SAR Data[M]. KOGAN F, POWELL A, and FEDOROV O. Use of Satellite and In-Situ Data to Improve Sustainability. Dordrecht: Springer, 2011: 19-29. doi: 10.1007/978-90-481-9618-0_3. [10] LIU Zhunga, ZHANG Li, LI Gang, et al. Change detection in heterogeneous remote sensing images based on the fusion of pixel transformation[C]. The 2017 20th International Conference on Information Fusion, Xi’an, China, 2017: 1–6. doi: 10.23919/ICIF.2017.8009656. [11] LIU Zhunga, LI Gang, MERCIER G, et al. Change detection in heterogenous remote sensing images via homogeneous pixel transformation[J]. IEEE Transactions on Image Processing, 2018, 27(4): 1822–1834. doi: 10.1109/TIP.2017.2784560 [12] 李丹, 吴保生, 陈博伟, 等. 基于卫星遥感的水体信息提取研究进展与展望[J/OL]. 清华大学学报: 自然科学版. http://kns.cnki.net/kcms/detail/detail.aspx?doi=10.16511/j.cnki.qhdxxb.2019.22.038, 2020.LI Dan, WU Baosheng, CHEN Bowei, et al. Review of water body information extraction based on satellite remote sensing[J/OL]. Journal of Tsinghua University: Science and Technology. http://kns.cnki.net/kcms/detail/detail.aspx?doi=10.16511/j.cnki.qhdxxb.2019.22.038, 2020. [13] OTSU N. A threshold selection method from gray-level histograms[J]. IEEE Transactions on Systems, Man, and Cybernetics, 1979, 9(1): 62–66. doi: 10.1109/TSMC.1979.4310076 [14] 窦建方, 陈鹰, 翁玉坤. 基于序列非线性滤波SAR影像水体自动提取[J]. 测绘通报, 2008, (9): 37–39, 45.DOU Jianfang, CHEN Ying, and WENG Yukun. Automatic water body extraction from SAR images based on sequence non-linear filter[J]. Bulletin of Surveying and Mapping, 2008(9): 37–39, 45. [15] LEE J S and JURKEVICH I. Coastline detection and tracing in SAR images[J]. IEEE Transactions on Geoscience and Remote Sensing, 1990, 28(4): 662–668. doi: 10.1109/TGRS.1990.572976 [16] DESCOMBES X, MOCTEZUMA M, MAÎTRE H, et al. Coastline detection by a Markovian segmentation on SAR images[J]. Signal Processing, 1996, 55(1): 123–132. doi: 10.1016/S0165-1684(96)00125-9 [17] 滑文强, 王爽, 郭岩河, 等. 基于邻域最小生成树的半监督极化SAR图像分类方法[J]. 雷达学报, 2019, 8(4): 458–470. doi: 10.12000/JR18104HUA Wenqiang, WANG Shuang, GUO Yanhe, et al. Semi-supervised PolSAR image classification based on the neighborhood minimum spanning tree[J]. Journal of Radars, 2019, 8(4): 458–470. doi: 10.12000/JR18104 [18] 赵娟萍, 郭炜炜, 柳彬, 等. 基于概率转移卷积神经网络的含噪标记SAR图像分类[J]. 雷达学报, 2017, 6(5): 514–523. doi: 10.12000/JR16140ZHAO Juanping, GUO Weiwei, LIU Bin, et al. Convolutional neural network-based SAR image classification with noisy labels[J]. Journal of Radars, 2017, 6(5): 514–523. doi: 10.12000/JR16140 [19] HARTIGAN J A and WONG M A. Algorithm AS 136: A k-means clustering algorithm[J]. Journal of the Royal Statistical Society. Series C (Applied Statistics) , 1979, 28(1): 100–108. [20] BEZDEK J C, EHRLICH R, and FULL W. FCM: The fuzzy c-means clustering algorithm[J]. Computers & Geosciences, 1984, 10(2/3): 191–203. doi: 10.1016/0098-3004(84)90020-7 [21] VANNOTE R L, MINSHALL G W, CUMMINS K W, et al. The river continuum concept[J]. Canadian Journal of Fisheries and Aquatic Sciences, 1980, 37(1): 130–137. doi: 10.1139/f80-017 [22] 方佳佳, 王烜, 孙涛, 等. 河流连通性及其对生态水文过程影响研究进展[J]. 水资源与水工程学报, 2018, 29(2): 19–26. doi: 10.11705/j.issn.1672-643X.2018.02.04FANG Jiajia, WANG Xuan, SUN Tao, et al. Review of research on river connectivity and its impact on eco -hydrological process[J]. Journal of Water Resources and Water Engineering, 2018, 29(2): 19–26. doi: 10.11705/j.issn.1672-643X.2018.02.04 [23] 童庆禧, 田国良. 中国典型地物波谱及其特征分析[M]. 北京: 科学出版社, 1990.TONG Qingxi and TIAN Guoliang. Spectra and Analysis of Typical Earth Objects of China[M]. Beijing: Science Press, 1990. [24] CURCIO J A and PETTY C C. The near infrared absorption spectrum of liquid water[J]. Journal of the Optical Society of America, 1951, 41(5): 302–304. doi: 10.1364/JOSA.41.000302 [25] 章毓晋. 图像工程[M]. 4版. 北京: 清华大学出版社, 2018: 51–53.ZHANG Yujin. Image Engineering[M]. 4th ed. Beijing: Tsinghua University Press, 2018: 51–53. [26] DUDA R O and HART P E. A Generalized Hough Transformation for Detecting Lines in Pictures[M]. Artificial Intelligence Group, SRI International, 1970. [27] XU Hanqiu. Modification of normalised difference water index (NDWI) to enhance open water features in remotely sensed imagery[J]. International Journal of Remote Sensing, 2006, 27(14): 3025–3033. doi: 10.1080/01431160600589179 [28] LI Gang and BURKHOLDER R J. Hybrid matching pursuit for distributed through-wall radar imaging[J]. IEEE Transactions on Antennas and Propagation, 2015, 63(4): 1701–1711. doi: 10.1109/TAP.2015.2398115 [29] WANG Xueqian, LI Gang, QUAN Chen, et al. Distributed detection of sparse stochastic signals with quantized measurements: The generalized Gaussian case[J]. IEEE Transactions on Signal Processing, 2019, 67(18): 4886–4898. doi: 10.1109/TSP.2019.2932884 [30] BATES P D, HORRITT M S, ARONICA G, et al. Bayesian updating of flood inundation likelihoods conditioned on flood extent data[J]. Hydrological Processes, 2004, 18(17): 3347–3370. doi: 10.1002/hyp.1499 [31] MCEWEN L J, KRAUSE F, JONES O, et al. Sustainable flood memories, informal knowledge and the development of community resilience to future flood risk[J]. WIT Transactions on Ecology and the Environment, 2012, 159(12): 253–264. doi: 10.2495/FRIAR120211 [32] RAMBABU C, CHAKRABARTI I, and MAHANTA A. Flooding-based watershed algorithm and its prototype hardware architecture[J]. IEE Proceedings-Vision, Image and Signal Processing, 2004, 151(3): 224–234. doi: 10.1049/ip-vis:20040397 [33] DE ROO A, VAN DER KNIJFF J, HORRITT M, et al. Assessing flood damages of the 1997 Oder flood and the 1995 Meuse flood[C]. The 2nd International Symposium on Operationalization of Remote Sensing, Enschede, The Netherlands, 1999: 16–20. [34] LEE J S. Refined filtering of image noise using local statistics[J]. Computer Graphics and Image Processing, 1981, 15(4): 380–389. doi: 10.1016/S0146-664X(81)80018-4 -


计量
- 文章访问数:
- HTML全文浏览量:
- PDF下载量:
- 被引次数: 0

