
 作者中心
作者中心 专家审稿
专家审稿 责编办公
责编办公 编辑办公
编辑办公
PolSAR Terrain Classification Based on Fine-tuned Dilated Group-cross Convolution Neural Network
-
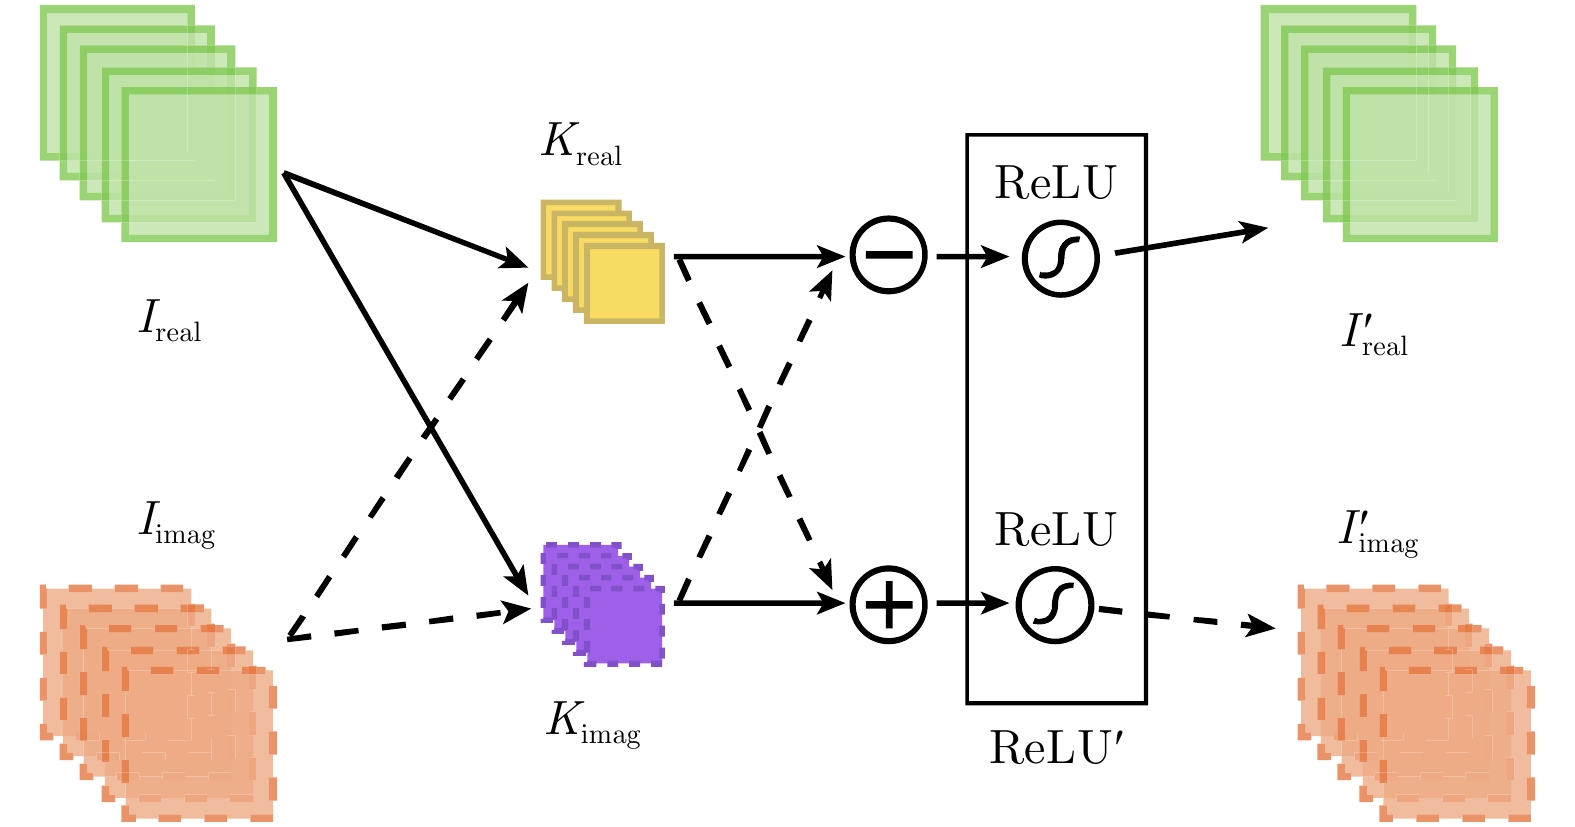
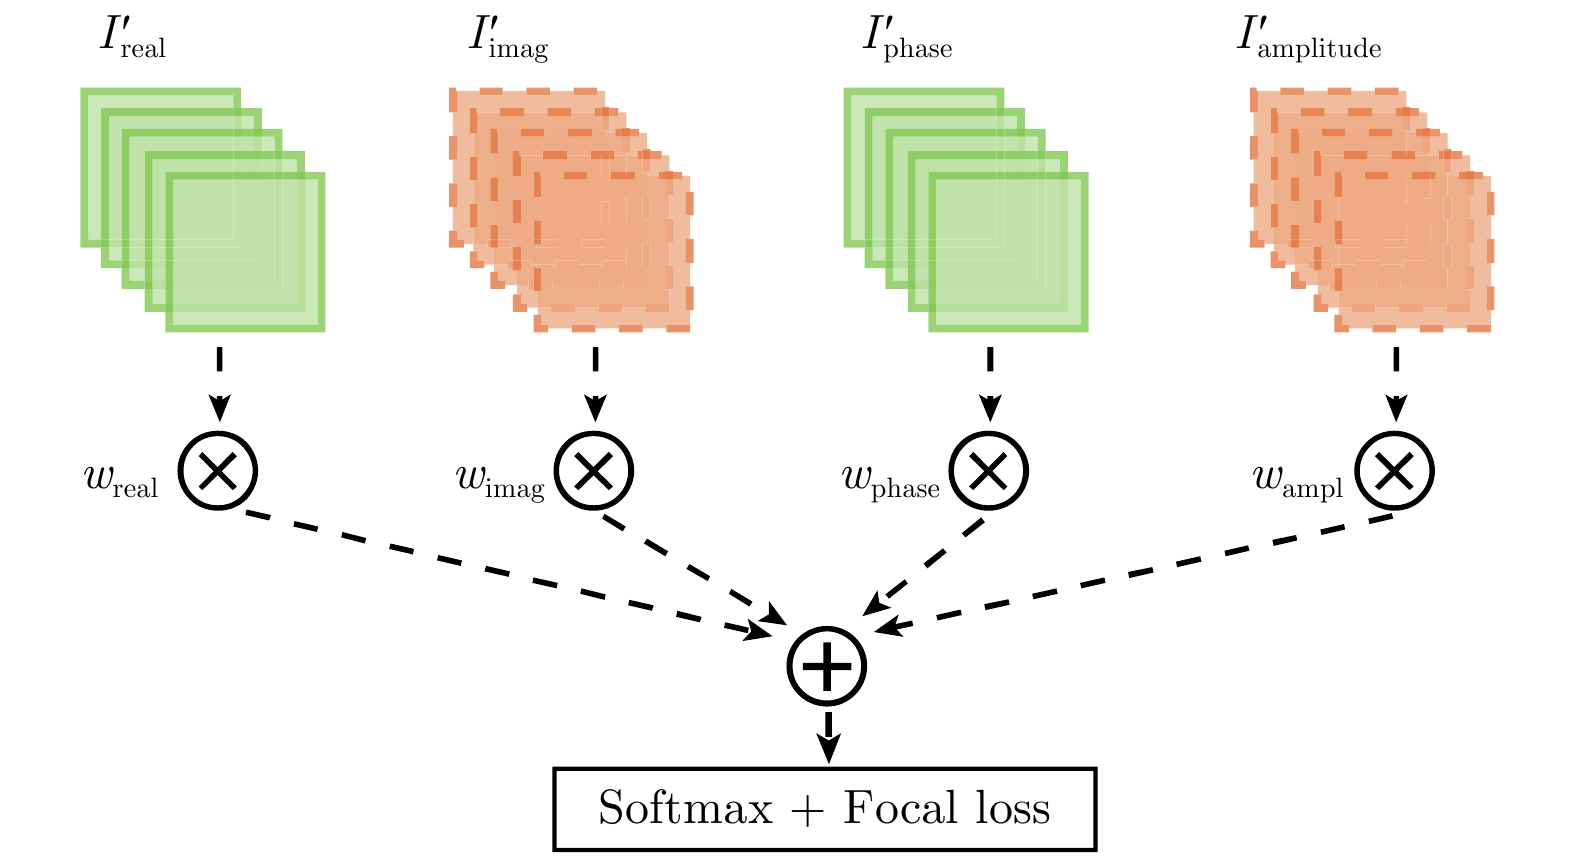
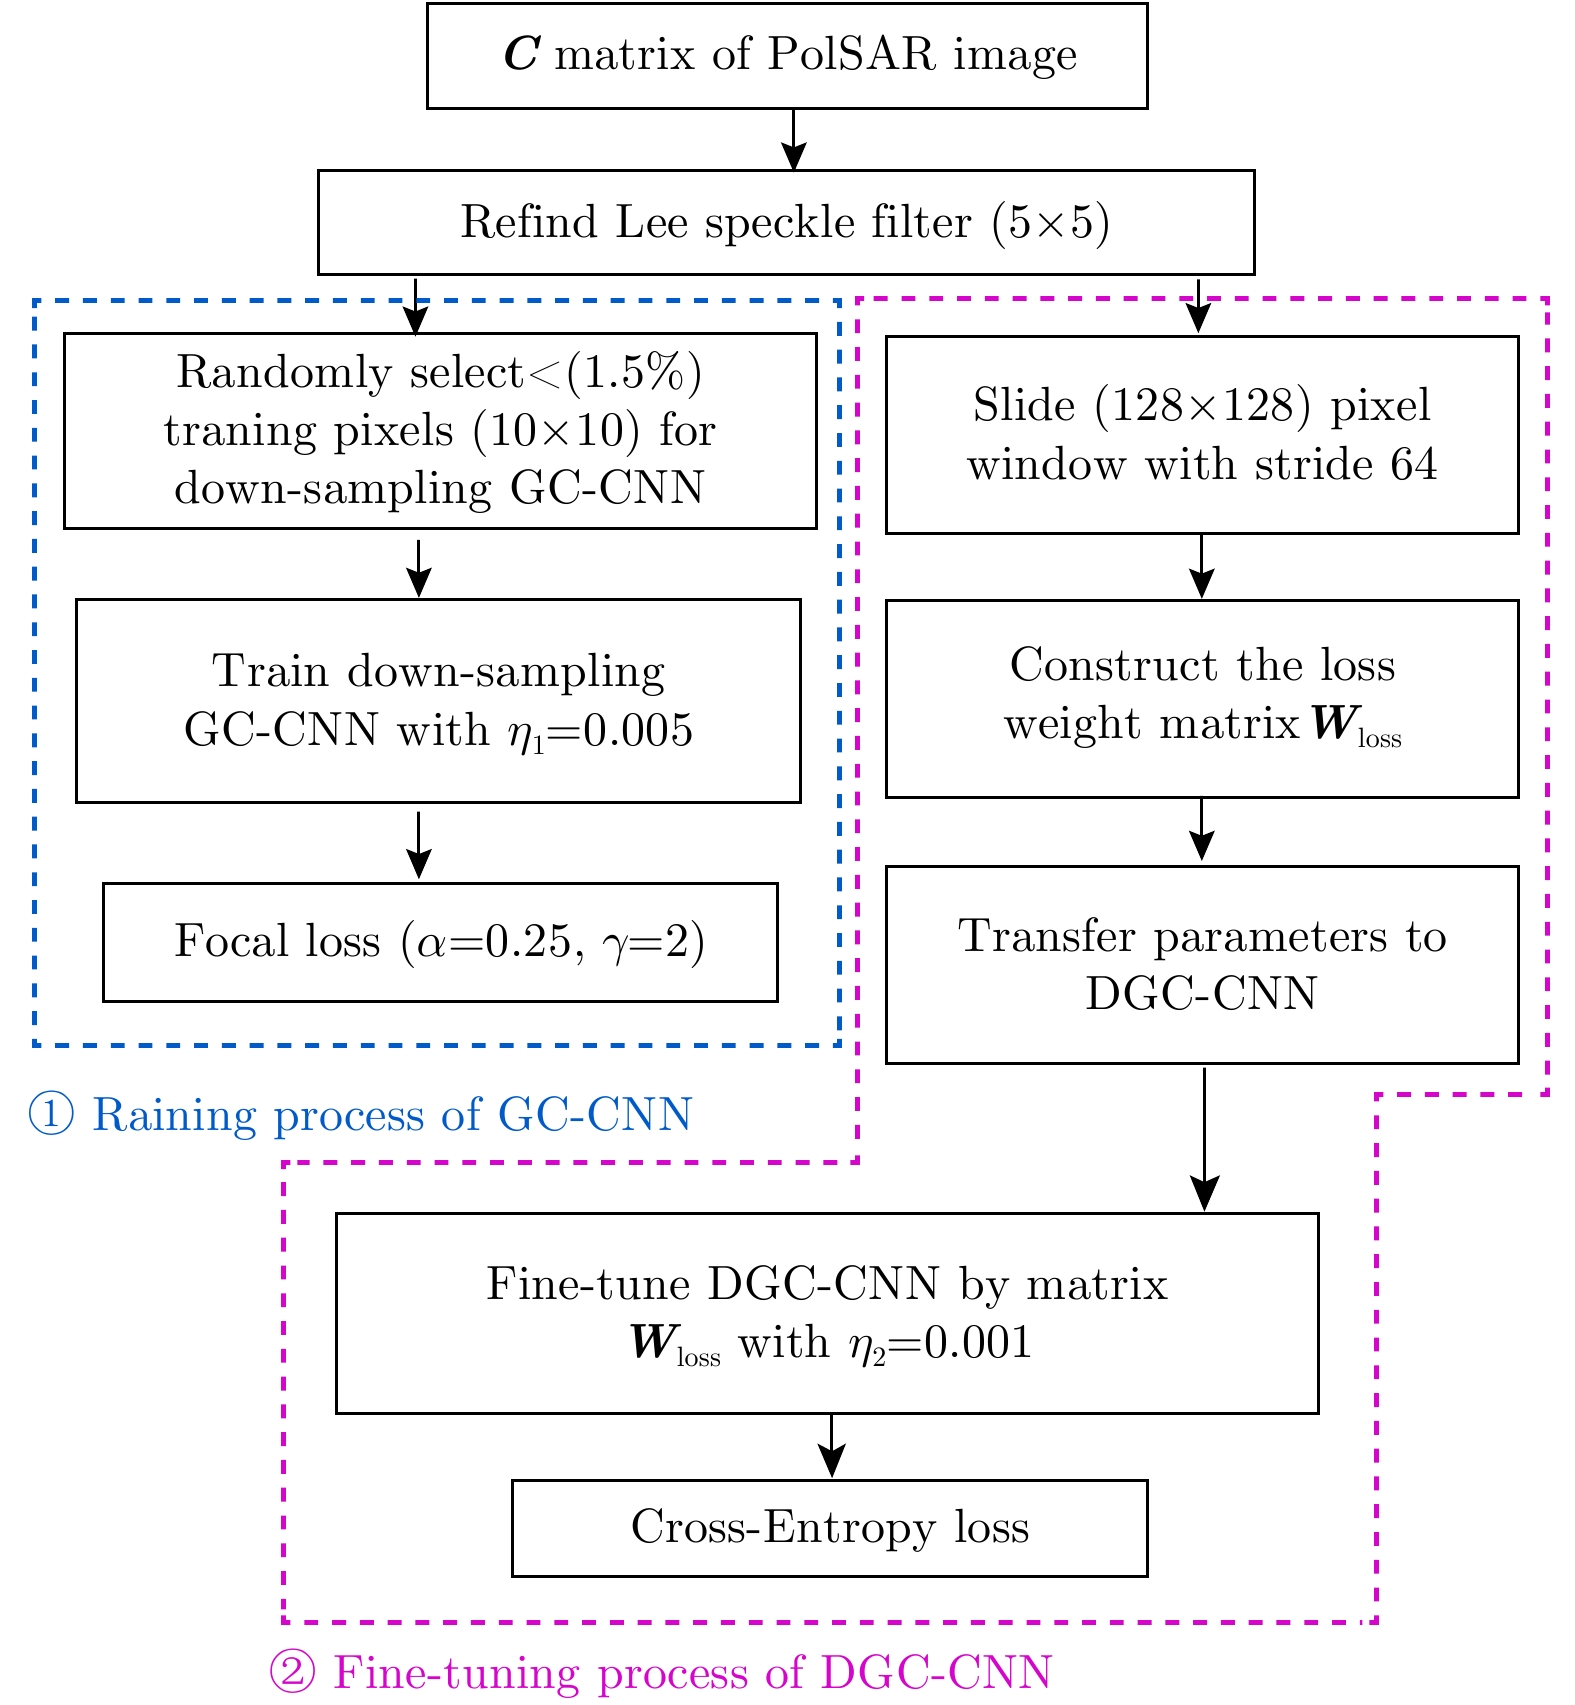
摘要: 在极化合成孔径雷达(PolSAR)地物分类研究中,基于实数CNN的分类算法无法充分利用PolSAR图像丰富的通道相位信息,并且在逐像素预测中存在大量冗余计算,导致分类效率较低。针对以上问题,该文采用一种复数域下的像素映射深度模型,实现低采样率下精确且高效的PolSAR地物分类。为充分使用PolSAR数据的通道相位信息,该文基于一种编组-交叉卷积网络(GC-CNN)将分类模型推广到复数域,并利用网络提取的复数特征及其对应的相位和幅度来实现更精确的分类;为加快分类速度,该文还采用了一种精调的膨胀编组-交叉卷积网络(FDGC-CNN)来实现像素到像素的直接映射,并进一步提升了分类精度。在基于AIRSAR平台的16类地物数据和E-SAR平台的4类地物数据的实验中,该文采用的FDGC-CNN模型相较于SVM分类器和实数CNN模型,能够更准确和更高效地实现多类别地物分类,全局分类精度分别为96.94%和90.07%、总耗时4.22 s和4.02 s。
-
关键词:
- 极化合成孔径雷达(PolSAR) /
- 地物分类 /
- 膨胀卷积 /
- 编组-交叉卷积
Abstract: In the study of the terrain classification based on the Polarimetric Synthetic Aperture Radar (PolSAR), the algorithms based on general CNN do not fully utilize the phase information in different channels, and the pixel-by-pixel classification strategy with extensive redundant computation is inefficient. To mitigate these problems, a deep pixel-to-pixel mapping model in the complex domain is used for achieving a fast and accurate PolSAR terrain classification at a low sampling rate. To completely utilize the phase information, this study uses Group-Cross CNN to extend the original model to the complex domain allowing complex-number input signals and significantly improving the classification accuracy. In addition, to speed up the algorithm, a Fine-tuned Dilated Group-Cross CNN (FDGC-CNN) was adopted to directly achieve pixel-to-pixel mapping as well as improve accuracy. We verified the adopted model on two PolSAR images comprising 16 classes terrains from the AIRSAR and 4 classes terrains from the E-SAR. According to our model, the overall classification accuracies were 96.94% and 90.07% respectively while the running time was 4.22 s and 4.02 s respectively. Therefore, FDGC-CNN achieved better accuracy with higher efficiency compared to SVM and traditional CNN.-
Key words:
- PolSAR /
- Terrain classification /
- Dilated convolution /
- Group-cross convolution
-

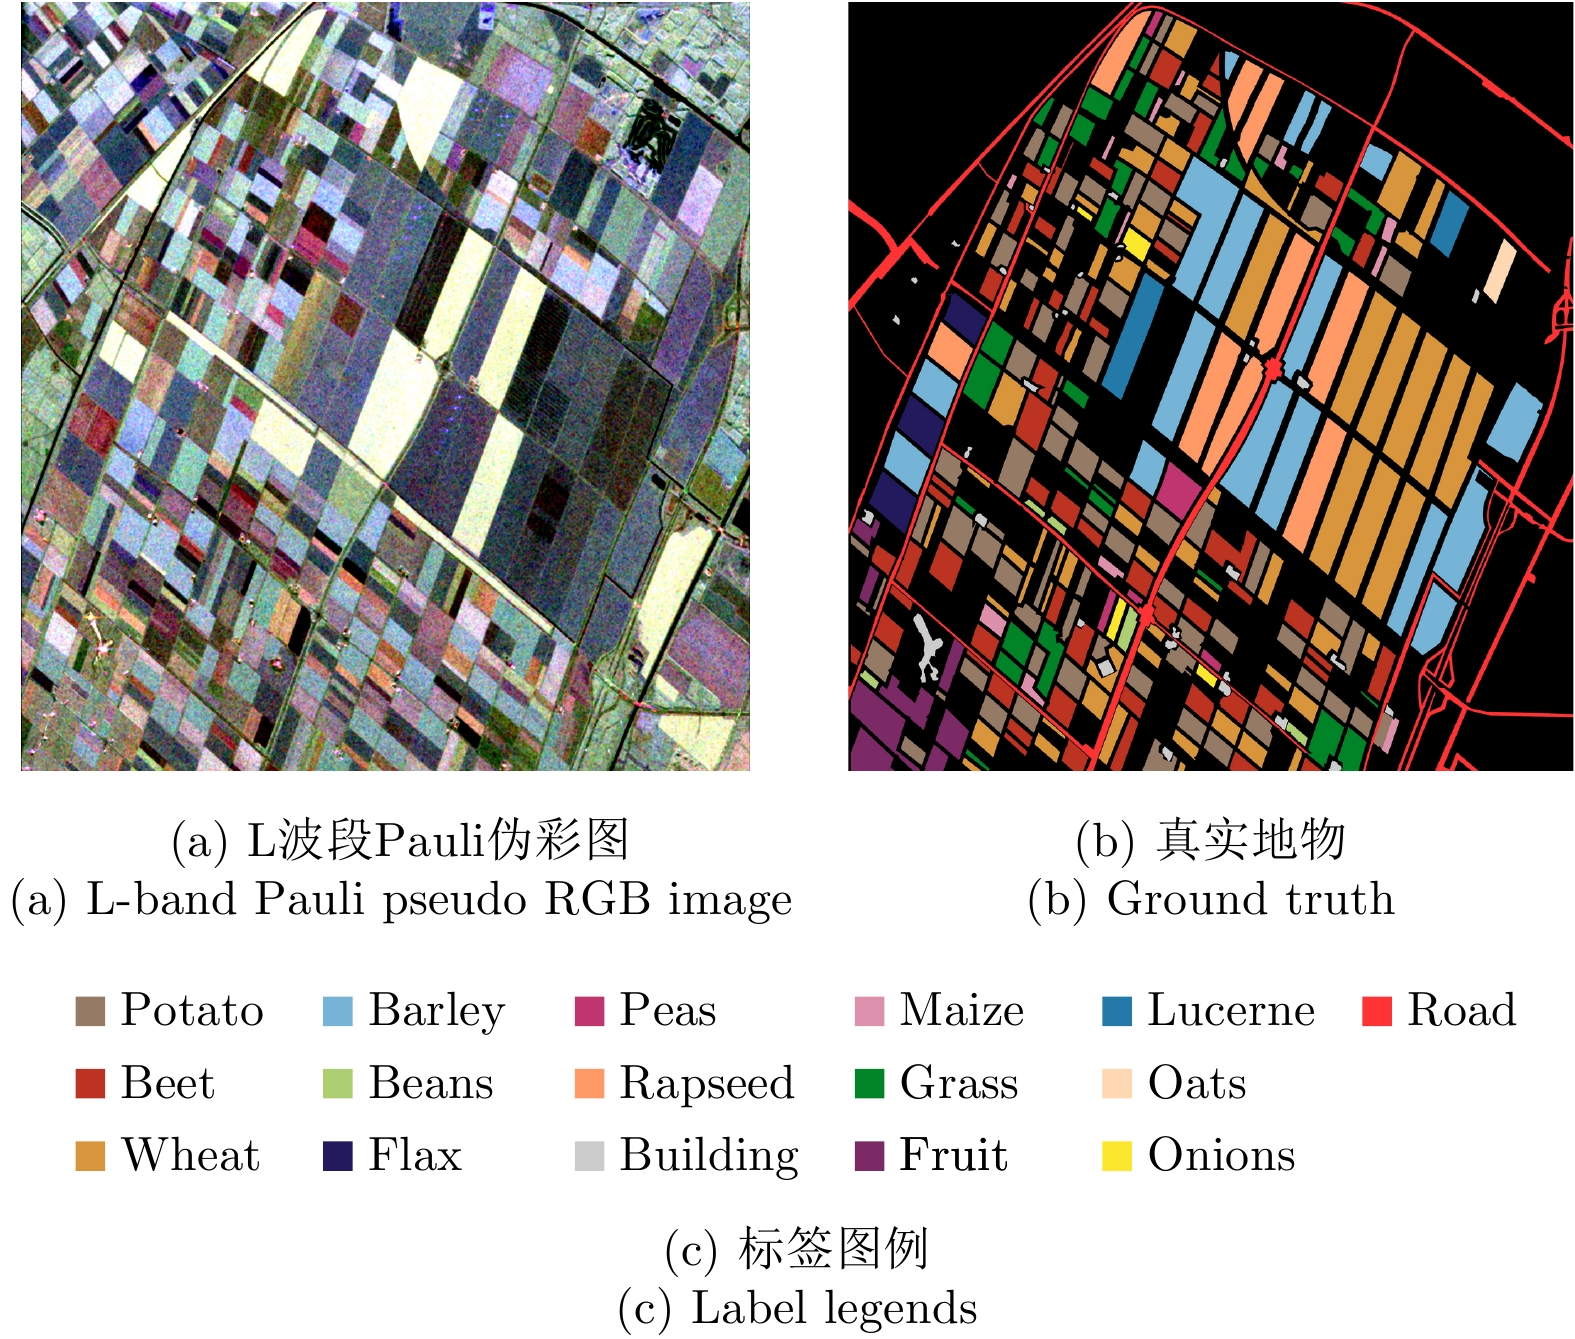
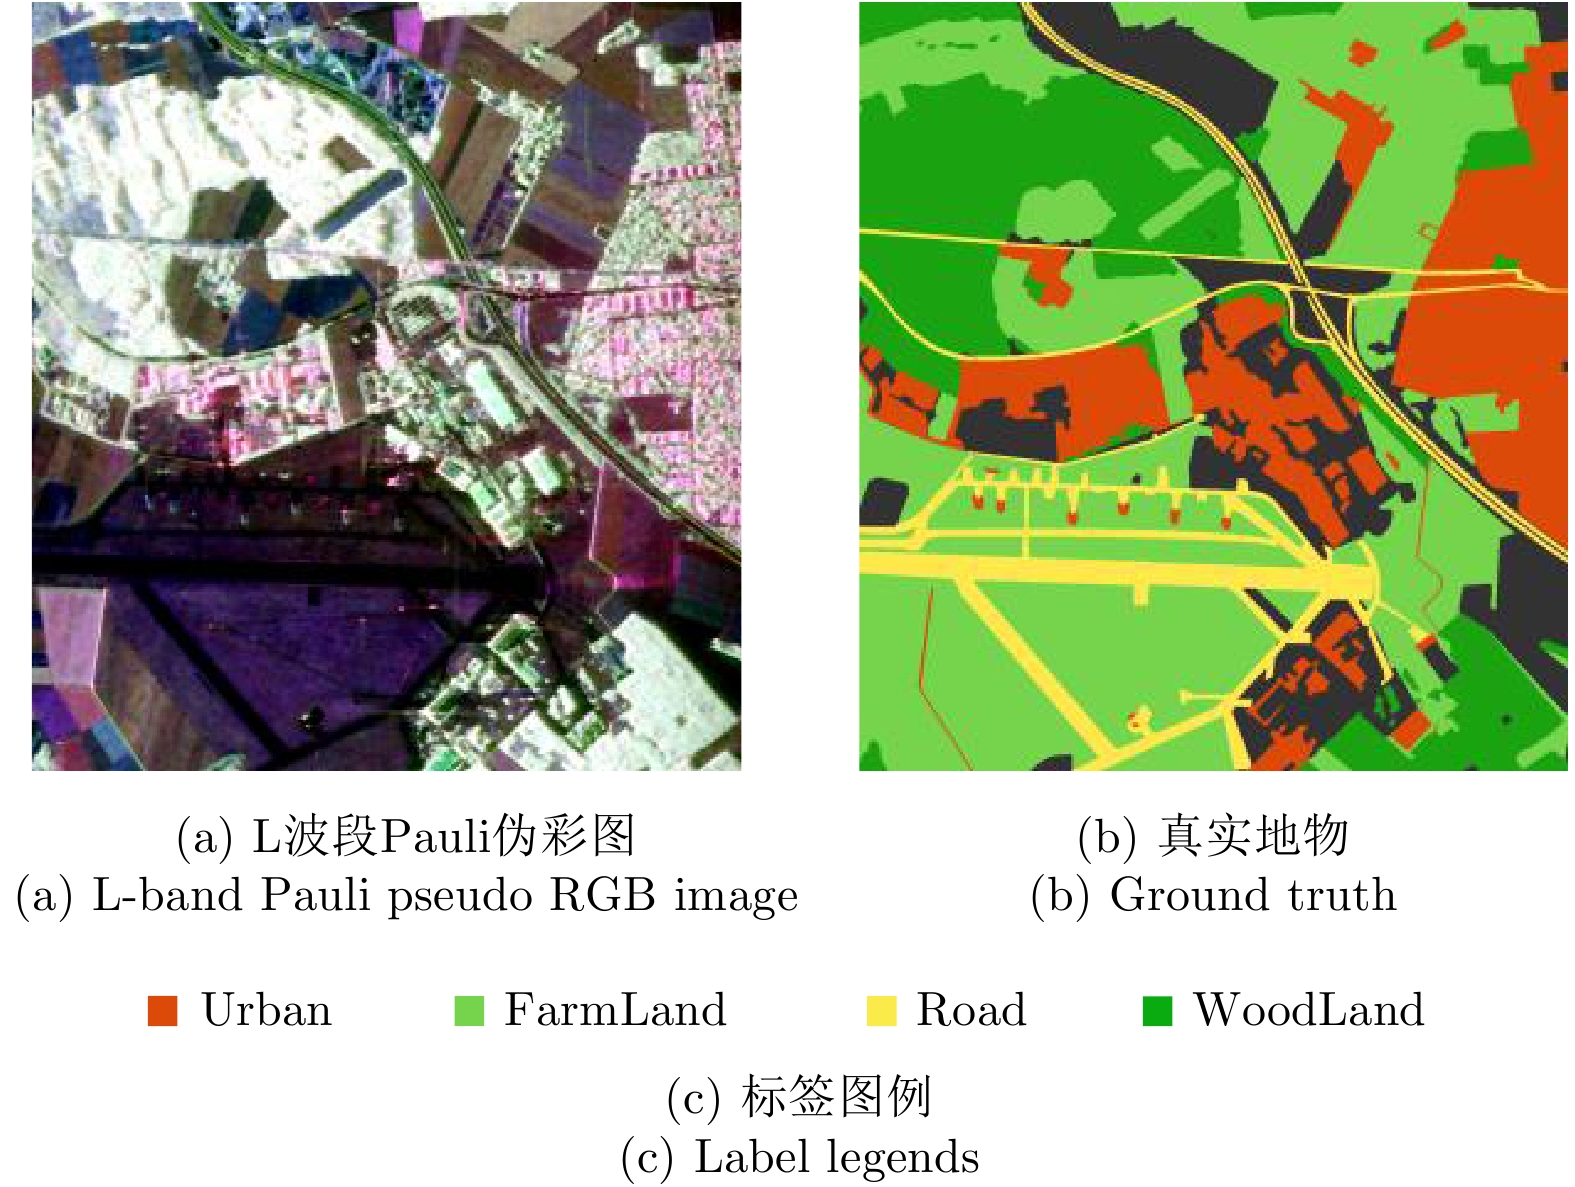
图 7 Flevoland-Netherlands地区L, P, C波段PolSAR数据
Figure 7. L, P, C-band PolSAR image data over the Flevoland-Netherlands region

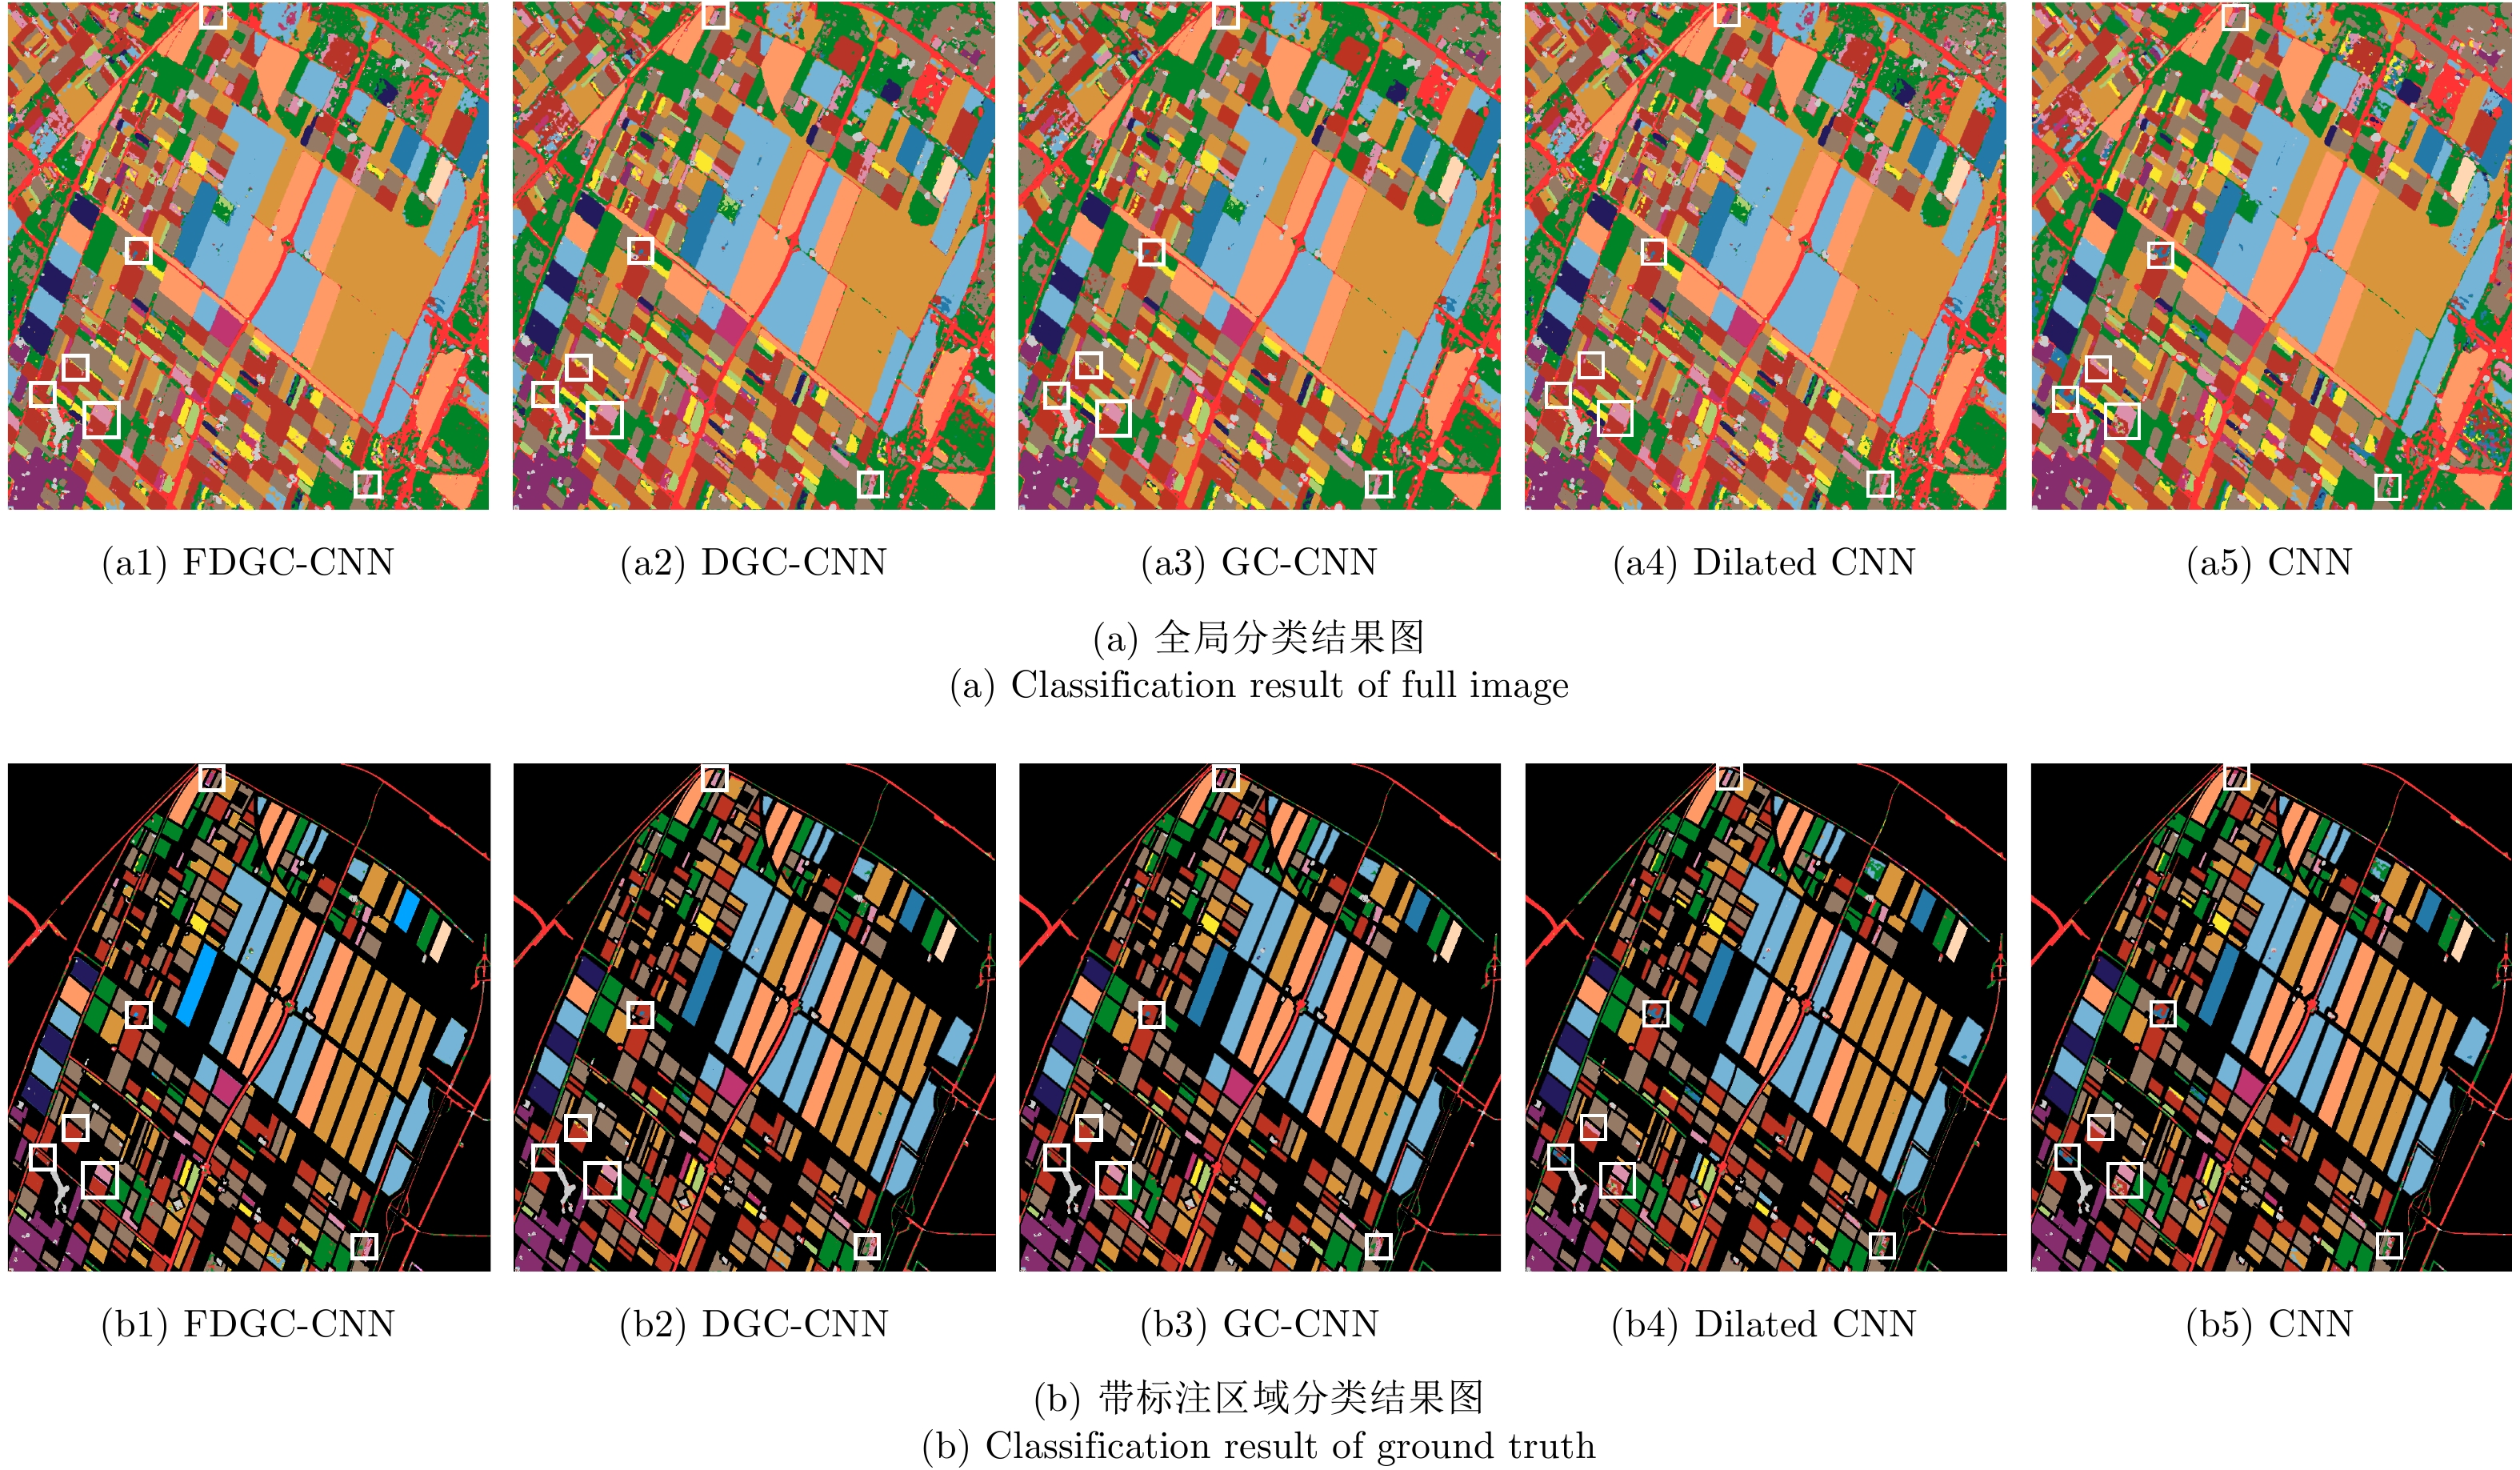
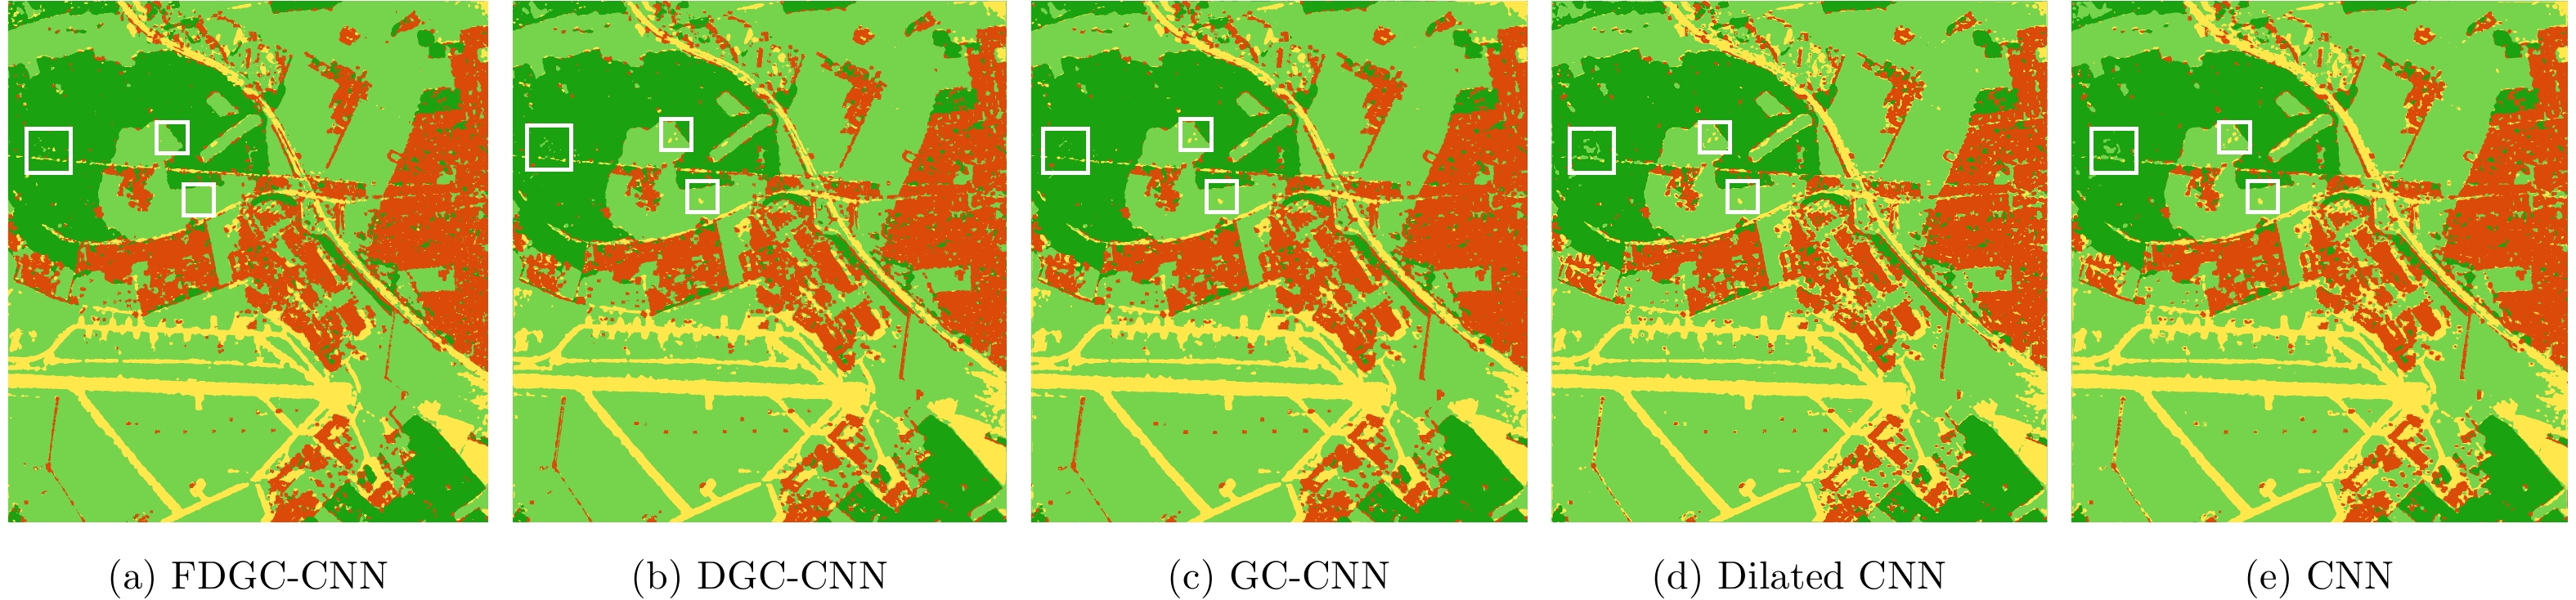
图 9 Flevoland-Netherlands地区分类结果图
Figure 9. Classification images of the Flevoland-Netherlands region

图 10 Oberpfaffenhofen地区L波段PolSAR数据
Figure 10. L-band PolSAR image data over the Oberpfaffenhofen region
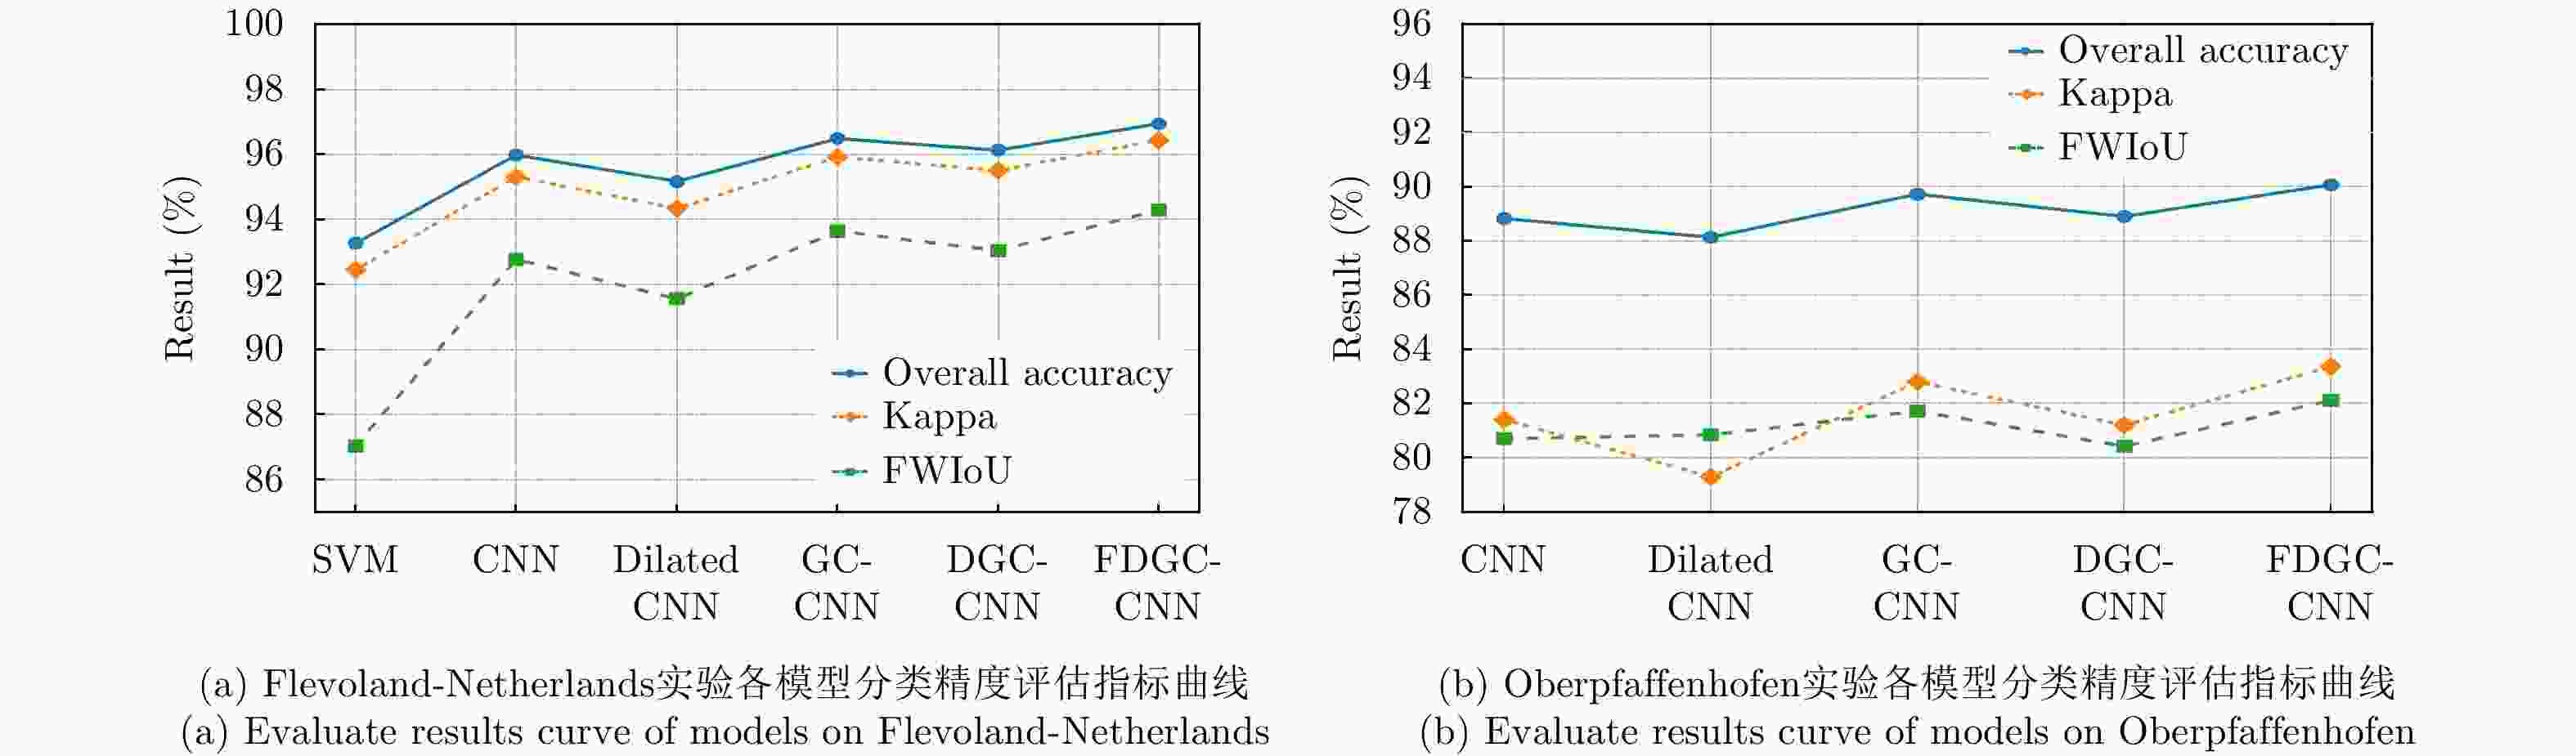
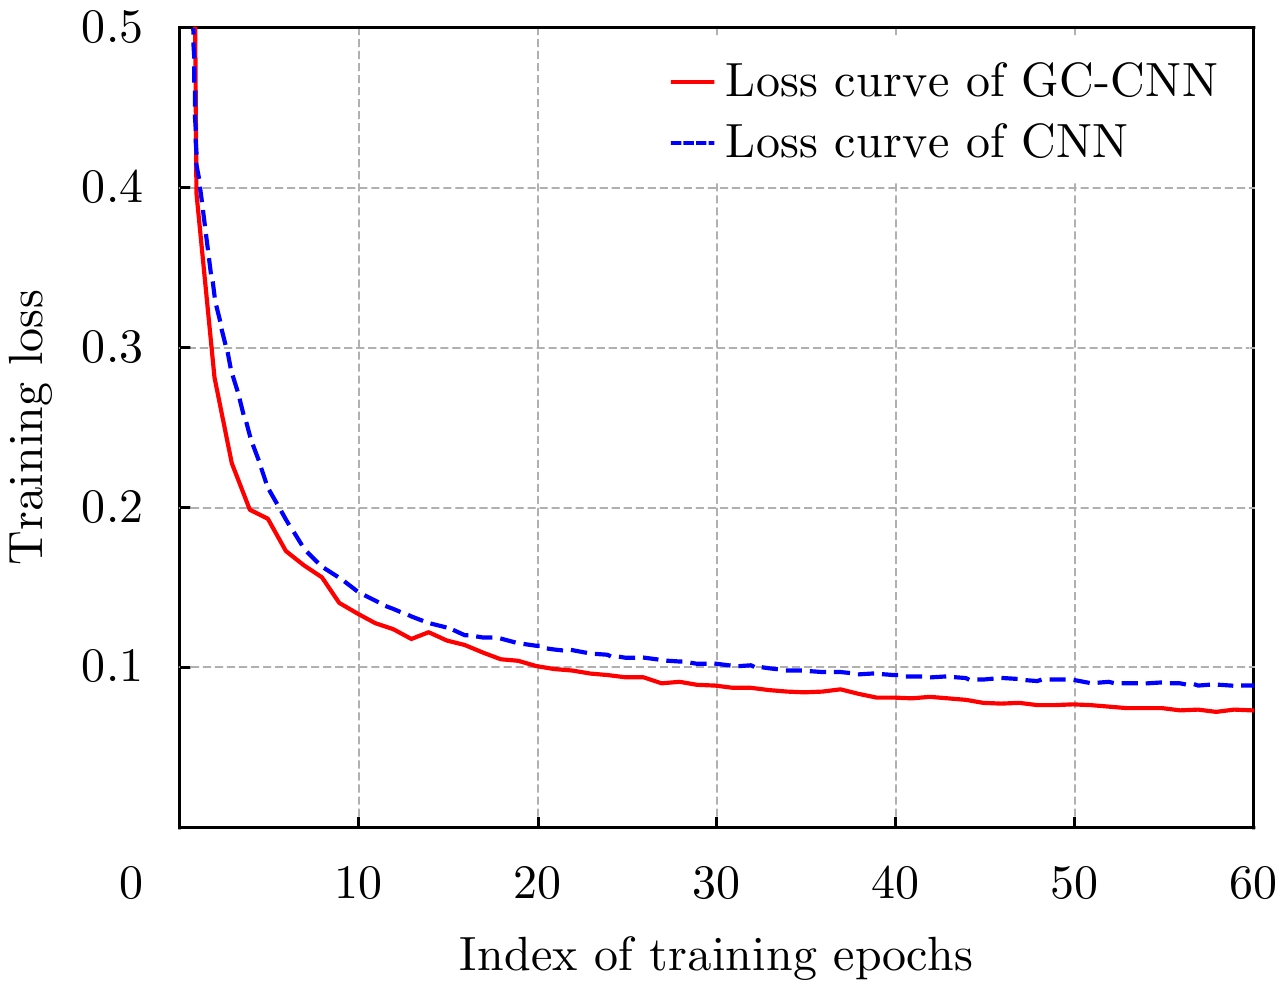
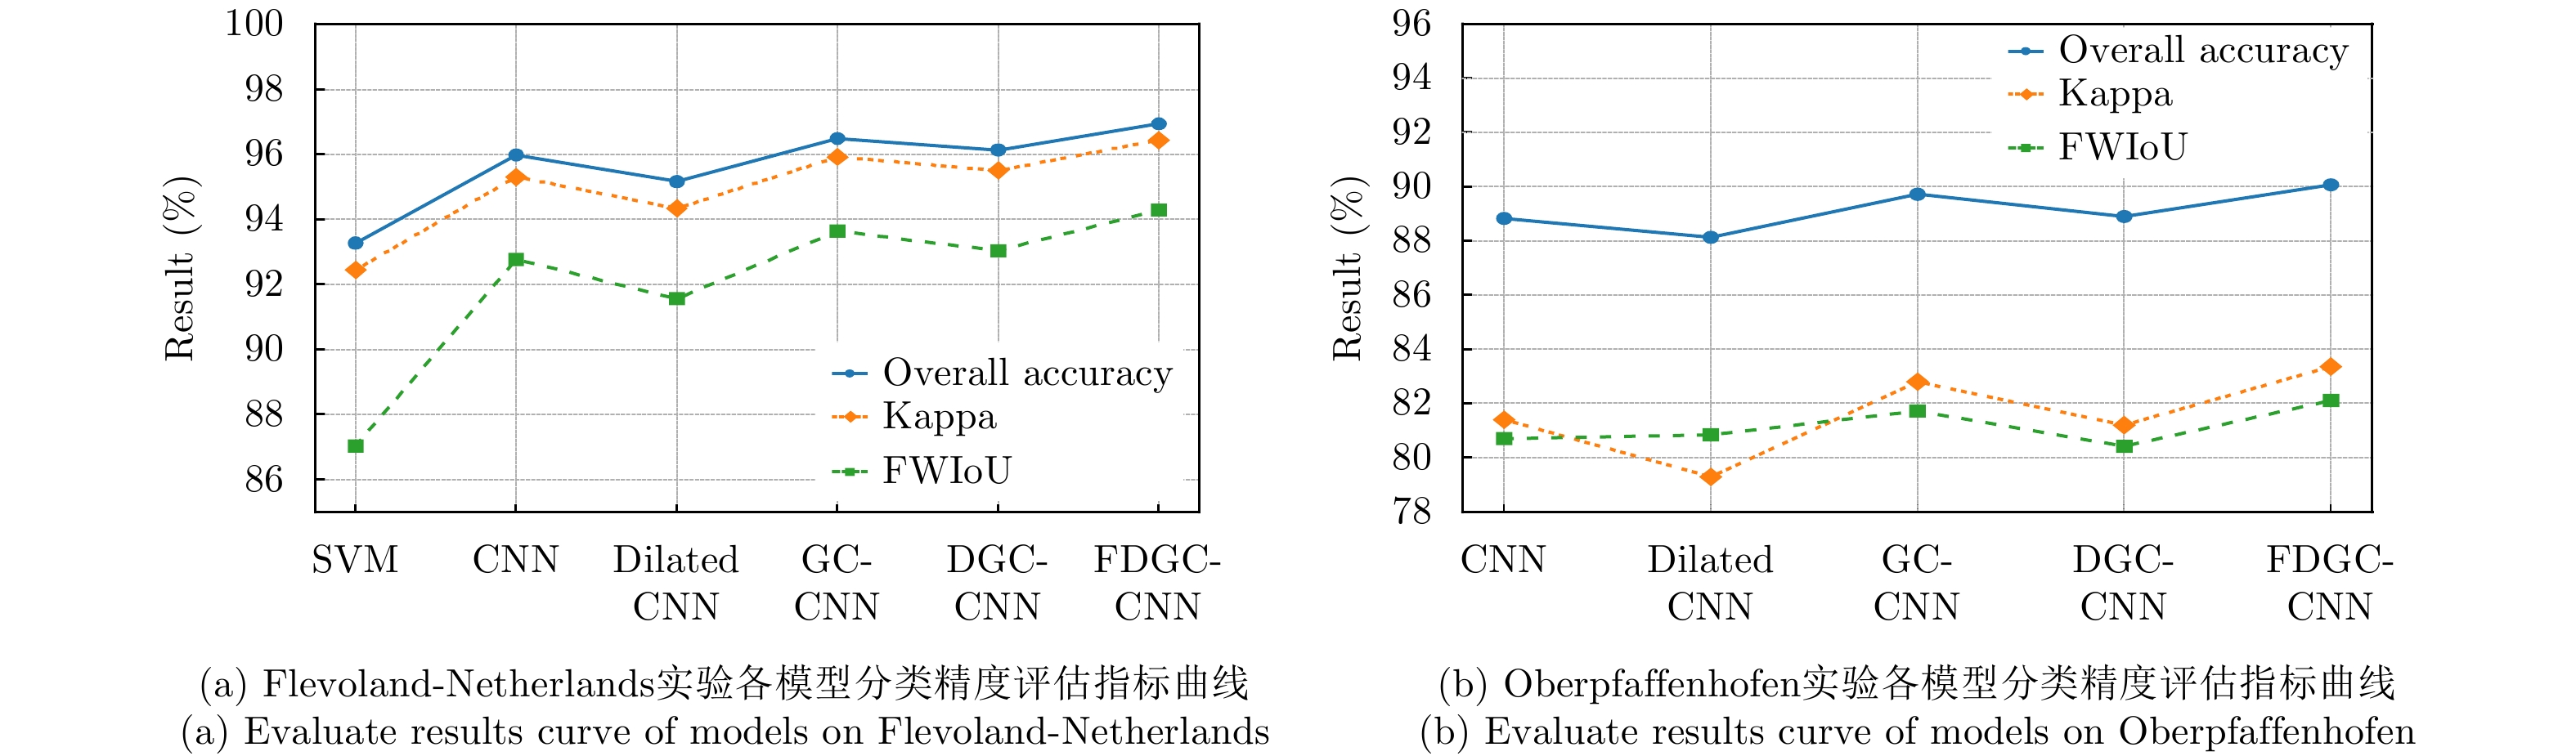
图 12 Flevoland-Netherlands和Oberpfaffenhofen地区实验各模型评估结果曲线
Figure 12. Evaluate results curve of models on Flevoland-Netherlands and Oberpfaffenhofen
表 1 Flevoland-Netherlands地区PolSAR图像分类结果表
Table 1. Classification results of Flevoland-Netherlands region
Class (%) 1 (2.0) 2 (4.9) 3 (0.9) 4 (0.6) 5 (1.6) 6 (1.5) 7 (1.0) 8 (7.2) 9 (5.2) 10 (5.0) Train 600 400 600 600 600 700 700 300 240 100 Total 29630 8031 66148 90681 38015 46583 68427 4155 4611 1982 SVM 92.47 97.89 97.52 98.77 95.28 92.46 96.34 96.57 89.42 95.67 CNN 97.81 99.35 98.99 98.93 99.96 97.05 99.21 96.21 83.65 88.27 Dilated CNN 97.66 99.48 98.79 98.79 99.91 96.78 98.68 94.12 79.03 84.79 GC-CNN 96.72 99.60 99.03 99.00 99.96 97.51 99.32 96.59 93.20 95.62 DGC-CNN 96.71 99.49 98.80 98.99 99.95 97.43 99.17 96.58 91.93 95.05 FDGC-CNN 96.63 99.29 98.90 98.59 99.95 98.65 99.59 97.11 91.32 97.01 Class (%) 11 (4.4) 12(4.5) 13(5.4) 14(4.9) 15(4.4) 16(1.1) OA Kappa FWIoU Time (s) Train 600 100 100 400 200 400 – – – – Total 13485 2206 1838 8203 4536 42861 – – – – SVM 98.34 93.02 98.89 98.56 28.54 57.68 93.27 92.44 87.04 669.00 CNN 97.81 96.48 99.93 99.56 86.69 69.36 95.72 95.31 92.77 220.31 Dilated CNN 97.81 91.10 99.83 99.67 78.99 63.02 95.16 94.34 91.56 3.94 GC-CNN 97.83 98.05 99.98 99.57 87.04 72.79 96.49 95.92 93.64 401.56 DGC-CNN 97.86 97.37 99.82 99.45 82.36 70.13 96.14 95.50 93.04 4.32 FDGC-CNN 96.49 98.85 99.98 99.73 89.61 77.99 96.94 96.44 94.29 4.32 *注: Grass(1); Flax(2); Potato(3); Wheat(4); Rapseed(5); Beet(6); Barly(7); Peas(8); Maize(9); Bean(10); Fruit(11); Onion(12); Oats(13); Lucerne(14); Building(15); Road(16)  下载: 导出CSV
表 2 Oberpfaffenhofen地区PolSAR图像分类结果表
Table 2. Classification results of oberpfaffenhofen region
Class (%) Train Total CNN Dilated CNN GC-CNN DGC-CNN FDGC-CNN WoodLand (1.0) 3000 290915 88.14 88.33 90.40 89.67 90.55 FarmLand (0.5) 3000 622739 94.02 94.23 93.54 94.27 95.30 Urban (1.1) 3000 274684 82.78 79.93 85.80 82.36 86.03 Roads (1.8) 2500 137400 78.89 76.45 78.82 76.08 73.65 OA – – 88.83 88.13 89.72 88.90 90.07 Kappa – – 81.40 79.26 82.80 81.20 83.36 FWIoU – – 80.70 80.44 81.72 80.42 82.11 Time (s) – – 262.47 2.60 513.43 3.21 4.02
下载: 导出CSV
-
[1] YANG Wen, ZHONG Neng, YANG Xiangli, et al. Rie-mannian sparse coding for classification of PolSAR images[C]. 2016 IEEE International Geoscience and Remote Sensing Symposium (IGARSS), Beijing, China, 2016: 5698–5701. doi: 10.1109/IGARSS.2016.7730488. [2] 张祥, 邓喀中, 范洪冬, 等. 基于目标分解的极化SAR图像SVM监督分类[J]. 计算机应用研究, 2013, 30(1): 295–298. doi: 10.3969/j.issn.1001-3695.2013.01.076ZHANG Xiang, DENG Kazhong, FAN Hongdong, et al. PolSAR SVM supervised classification method combining with polarimetric target decomposition[J]. Application Re-search of Computers, 2013, 30(1): 295–298. doi: 10.3969/j.issn.1001-3695.2013.01.076 [3] ZHANG Hongsheng, ZHANG Yuanzhi, and LIN Hui. Urban land cover mapping using random forest combined with optical and SAR data[C]. 2012 IEEE International Geoscience and Remote Sensing Symposium (IGARSS), Munich, Germany, 2012: 6809–6812. doi: 10.1109/IGARSS.2012.6352600. [4] ZHANG Guangyun and JIA Xiuping. Simplified conditional random fields with class boundary constraint for spec-tral-spatial based remote sensing image classification[J]. IEEE Geoscience and Remote Sensing Letters, 2012, 9(5): 856–860. doi: 10.1109/LGRS.2012.2186279 [5] ZHANG Zhimian, WANG Haipeng, XU Feng, et al. Complex-valued convolutional neural network and its application in polarimetric SAR image classification[J]. IEEE Transactions on Geoscience and Remote Sensing, 2017, 55(12): 7177–7188. doi: 10.1109/TGRS.2017.2743222 [6] 徐真, 王宇, 李宁, 等. 一种基于CNN的SAR图像变化检测方法[J]. 雷达学报, 2017, 6(5): 483–491. doi: 10.12000/JR17075XU Zhen, WANG R, LI Ning, et al. A novel approach to change detection in SAR images with CNN classification[J]. Journal of Radars, 2017, 6(5): 483–491. doi: 10.12000/JR17075 [7] BI Haixia, SUN Jian, and XU Zongben. A graph-based semisupervised deep learning model for PolSAR image classification[J]. IEEE Transactions on Geoscience and Remote Sensing, 2019, 57(4): 2116–2132. doi: 10.1109/TGRS.2018.2871504 [8] CHEN Siwei and TAO Chensong. PolSAR image classification using polarimetric-feature-driven deep convolutional neural network[J]. IEEE Geoscience and Remote Sensing Letters, 2018, 15(4): 627–631. doi: 10.1109/LGRS.2018.2799877 [9] CHEN Siwei, TAO Chensong, WANG Xuesong, et al. PolSAR target classification using polarimetric-feature-driven deep convolutional neural network[C]. 2018 IEEE International Geoscience and Remote Sensing Symposium (IGARSS), Valencia, Spain, 2018. doi: 10.1109/IGARSS.2018.8518529. [10] KONG J A, SWARTZ A A, YUEH H A, et al. Identification of terrain cover using the optimum polarimetric classifier[J]. Journal of Electromagnetic Waves and Applications, 1988, 2(2): 171–194. [11] LEE J S, GRUNES M R, and KWOK R. Classification of multi-look polarimetric SAR imagery based on complex Wishart distribution[J]. International Journal of Remote Sensing, 1994, 15(11): 2299–2311. doi: 10.1080/01431169408954244 [12] KOUSKOULAS Y, ULABY F T, and PIERCE L E. The Bayesian Hierarchical Classifier (BHC) and its application to short vegetation using multifrequency polarimetric SAR[J]. IEEE Transactions on Geoscience and Remote Sensing, 2004, 42(2): 469–477. doi: 10.1109/TGRS.2003.821066 [13] 邹焕新, 罗天成, 张月, 等. 基于组合条件随机场的极化SAR图像监督地物分类[J]. 雷达学报, 2017, 6(5): 541–553. doi: 10.12000/JR16109ZOU Huanxin, LUO Tiancheng, ZHANG Yue, et al. Combined conditional random fields model for supervised PolSAR images classification[J]. Journal of Radars, 2017, 6(5): 541–553. doi: 10.12000/JR16109 [14] YU F and KOLTUN V. Multi-scale context aggregation by dilated convolutions[J]. arXiv preprint arXiv: 1511.07122, 2015. [15] LONG J, SHELHAMER E, and DARRELL T. Fully convolutional networks for semantic segmentation[C]. 2015 IEEE Conference on Computer Vision and Pattern Recognition, Boston, MA, USA, 2015: 3431–3440. doi: 10.1109/CVPR.2015.7298965. [16] BADRINARAYANAN V, KENDALL A, and CIPOLLA R. Segnet: A deep convolutional encoder-decoder architecture for image segmentation[J]. arXiv preprint ar-Xiv: 1511.00561, 2015. [17] RONNEBERGER O, FISCHER P, and BROX T. U-net: Convolutional networks for biomedical image segmenta-tion[C]. Proceedings of 18th International Conference on Medical Image Computing and Computer-Assisted Inter-vention, Munich, Germany, 2015: 234–241. [18] BENGIO Y, LECUN Y, NOHL C, et al. LeRec: A NN/HMM hybrid for on-line handwriting recognition[J]. Neural Computation, 1995, 7(6): 1289–1303. doi: 10.1162/neco.1995.7.6.1289 [19] NAIR V and HINTON G E. Rectified linear units improve restricted boltzmann machines[C]. Proceedings of the 27th International Conference on Machine Learning (ICML-10), Haifa, Israel, 2010: 807–814. [20] SHANG W, SOHN K, ALMEIDA D, et al. Understanding and improving convolutional neural networks via concatenated rectified linear units[C]. International Conference on Machine Learning, 2016: 2217–2225. [21] HE Kaiming, ZHANG Xiangyu, REN Shaoqing, et al. Delving deep into rectifiers: Surpassing human-level per-formance on imagenet classification[C]. 2015 IEEE International Conference on Computer Vision, Santiago, Chile, 2015: 1026–1034. doi: 10.1109/ICCV.2015.123. [22] SIMONYAN K and ZISSERMAN A. Very deep convolu-tional networks for large-scale image recognition[J]. arXiv preprint arXiv: 1409.1556, 2014. [23] HE Kaiming, ZHANG Xiangyu, REN Shaoqing, et al.. Identity mappings in deep residual networks[C]. Proceedings of the 14th European Conference on Computer Vision, Amsterdam, The Netherlands, 2016: 630–645. [24] HE Kaiming, ZHANG Xiangyu, REN Shaoqing, et al. Deep residual learning for image recognition[C]. 2016 IEEE Conference on Computer Vision and Pattern Recognition, Las Vegas, NV, USA, 2016: 770–778. doi: 10.1109/CVPR.2016.90. [25] HUANG Gao, LIU Zhuang, VAN DER MAATEN L, et al. Densely connected convolutional networks[C]. 2017 IEEE Conference on Computer Vision and Pattern Recognition, Honolulu, HI, USA, 2017: 2261–2269. doi: 10.1109/CVPR.2017.243 [26] LIN T Y, GOYAL P, GIRSHICK R, et al. Focal loss for dense object detection[C]. 2017 IEEE International Conference on Computer Vision, Venice, Italy, 2017: 2999–3007. doi: 10.1109.ICCV.2017.324. [27] HOEKMAN D H and VISSERS M A M. A new polarimetric classification approach evaluated for agricultural crops[J]. IEEE Transactions on Geoscience and Remote Sensing, 2003, 41(12): 2881–2889. doi: 10.1109/TGRS.2003.817795 [28] HOU Biao, KOU Hongda, and JIAO Licheng. Classification of polarimetric SAR images using multilayer autoencoders and superpixels[J]. IEEE Journal of Selected Topics in Applied Earth Observations and Remote Sensing, 2016, 9(7): 3072–3081. doi: 10.1109/JSTARS.2016.2553104 [29] GUO Yanhe, WANG Shuang, GAO Chenqiong, et al. Wishart RBM based DBN for polarimetric synthetic radar data classification[C]. 2015 IEEE International Geoscience and Remote Sensing Symposium (IGARSS), Milan, Italy, 2015: 1841–1844. doi: 10.1109/IGARSS.2015.7326150. -


计量
- 文章访问数:
- HTML全文浏览量:
- PDF下载量:
- 被引次数: 0

