
 作者中心
作者中心 专家审稿
专家审稿 责编办公
责编办公 编辑办公
编辑办公
Semi-supervised PolSAR Image Classification Based on the Neighborhood Minimum Spanning Tree
-
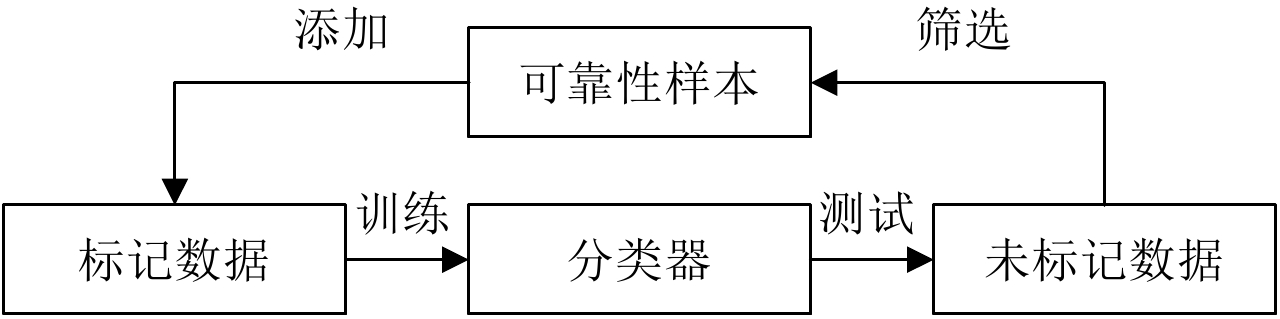
摘要: 该文针对极化SAR图像分类中只有少量标记样本的问题,提出了一种基于邻域最小生成树的半监督极化SAR图像分类方法。该方法针对极化SAR图像以像素为分类对象的特点,结合自训练方法的思想,利用极化SAR图像像素点的空间信息,提出了基于邻域最小生成树辅助学习的样本选择策略,增加自训练过程中被选择无标记样本的可靠性,扩充标记样本数量,训练更好的分类器。最终用训练好的分类器对极化SAR图像进行测试。对3组真实的极化SAR图像进行测试,实验结果表明,该方法在只有少量标记样本的情况下能获得满意的分类结果,且分类正确率明显优于传统的分类算法。Abstract: In this paper, a novel semi-supervised classification method based on the Neighborhood Minimum Spanning Tree (NMST) is proposed to solve the Polarimetric Synthetic Aperture Radar (PolSAR) terrain classification when labeled samples are few. Combining the idea of self-training method and spatial information of the pixels in PolSAR image, a new help-training sample selection strategy based on spatial neighborhood information is proposed, named as NMST, to select the high reliable unlabeled samples to enlarge the training set and improve the base classifier. Finally, the PolSAR image is classified by this improved classifier. The experiments results tested on three PolSAR data sets show that the proposed method achieves a better performance than existing classification methods when the number of labeled samples is few.
-
Key words:
- PolSAR /
- Terrain classification /
- Semi-supervised learning /
- Minimum spanning tree
-
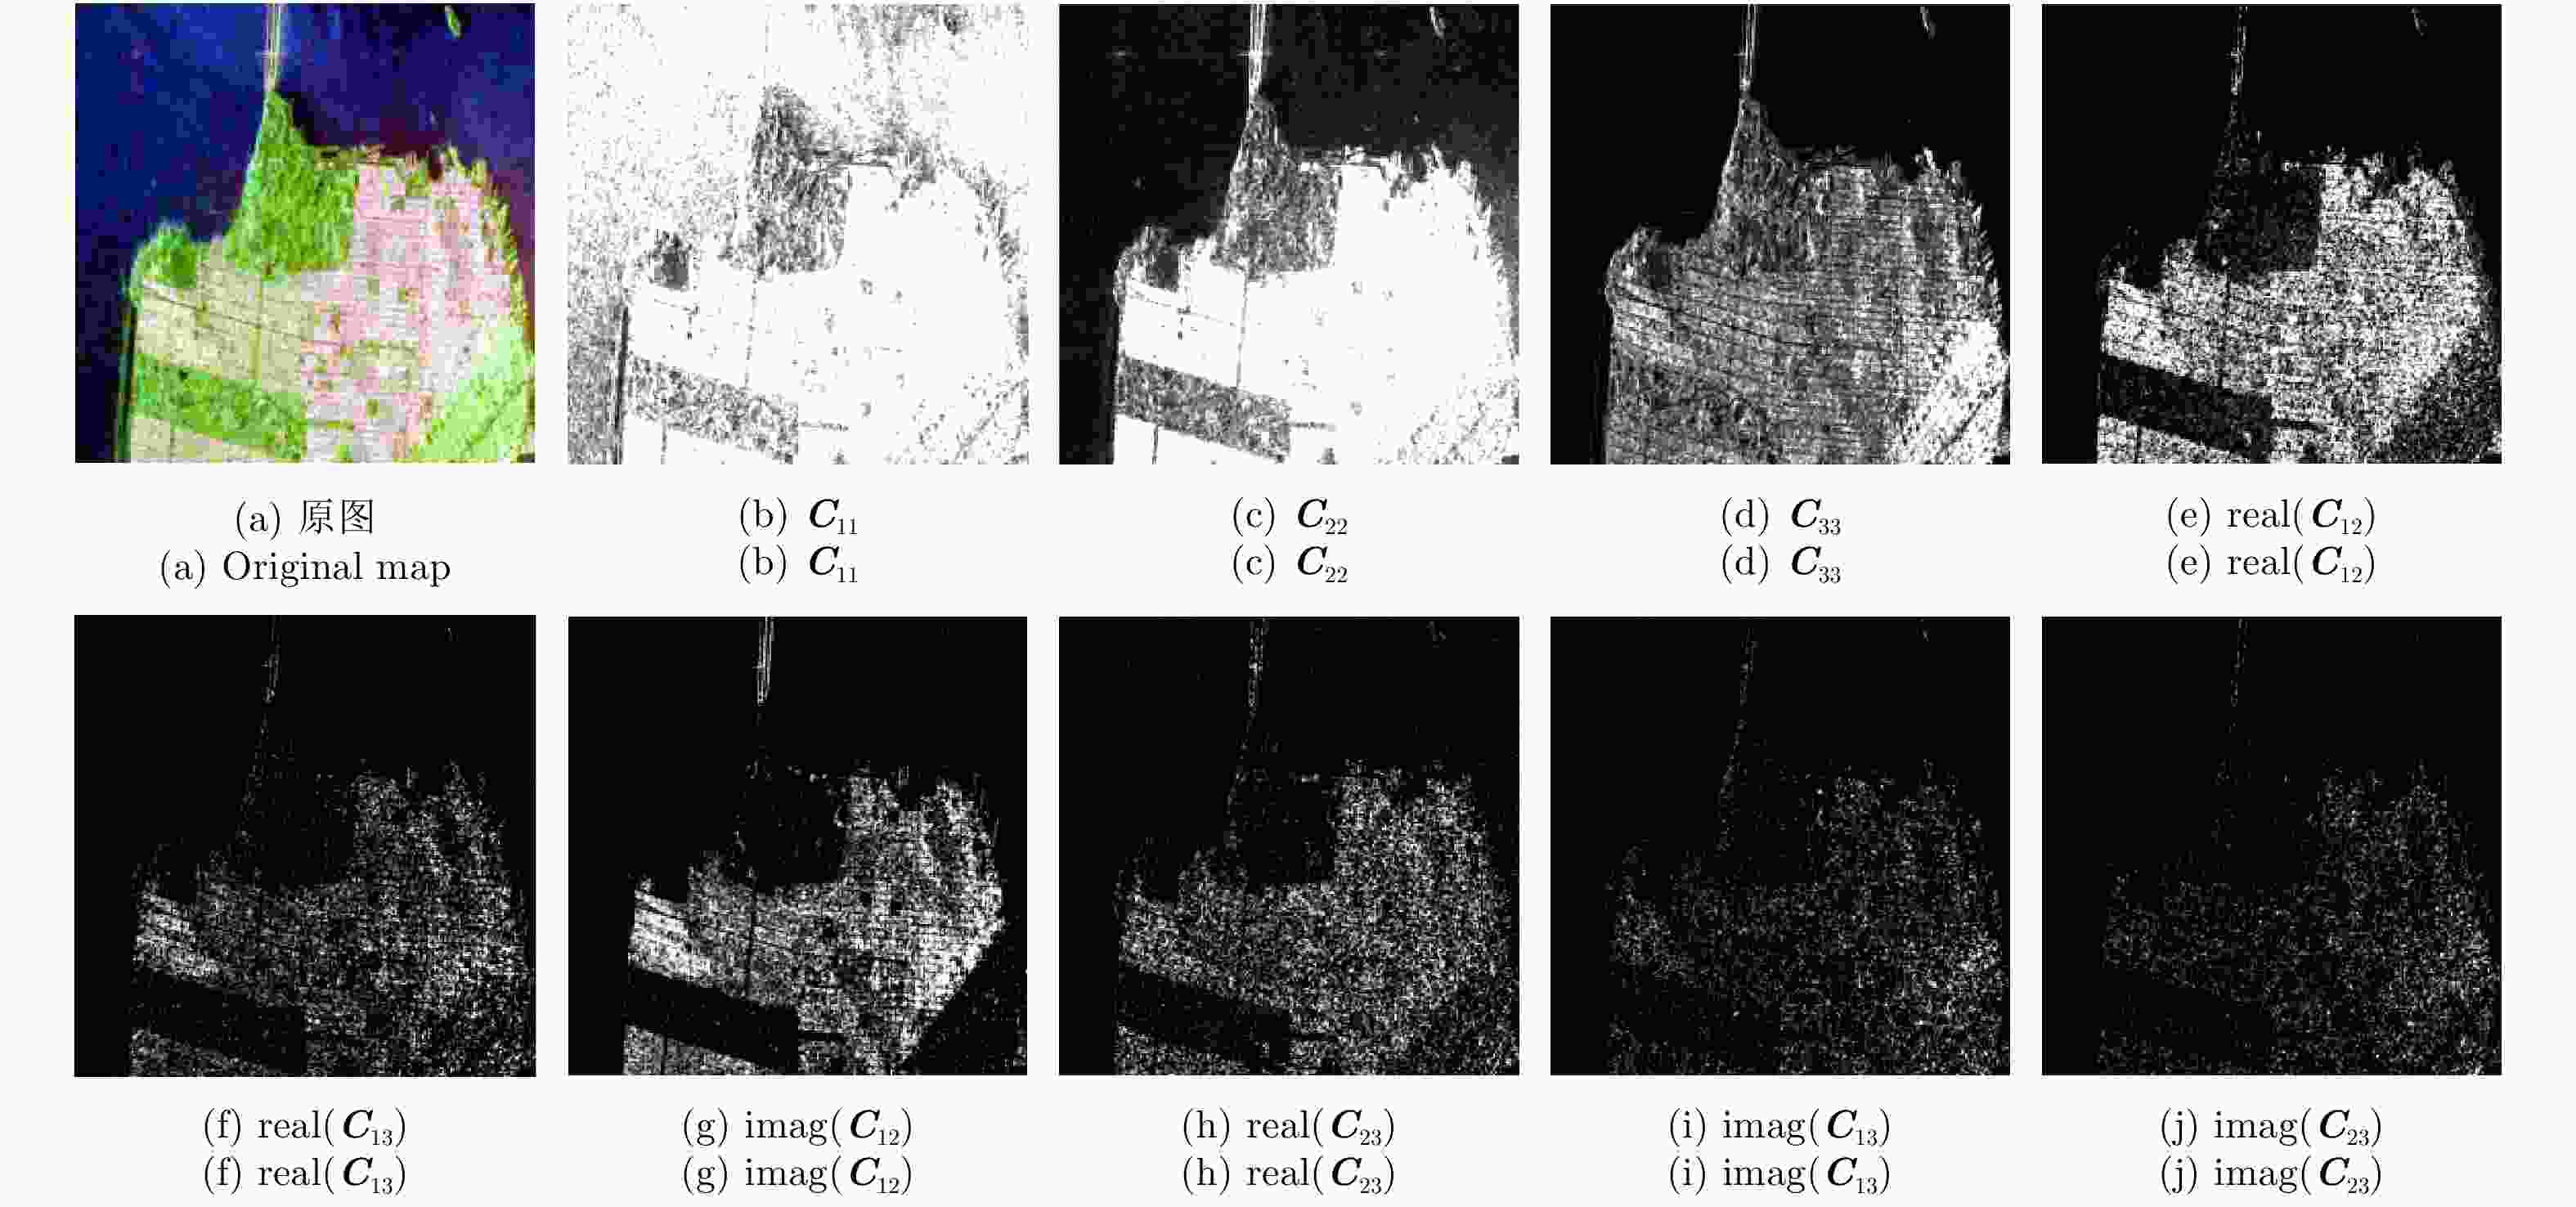
图 2 极化SAR协方差矩阵中9个元素的灰度值
Figure 2. The gray value of 9 elements in PolSAR covariance matrix
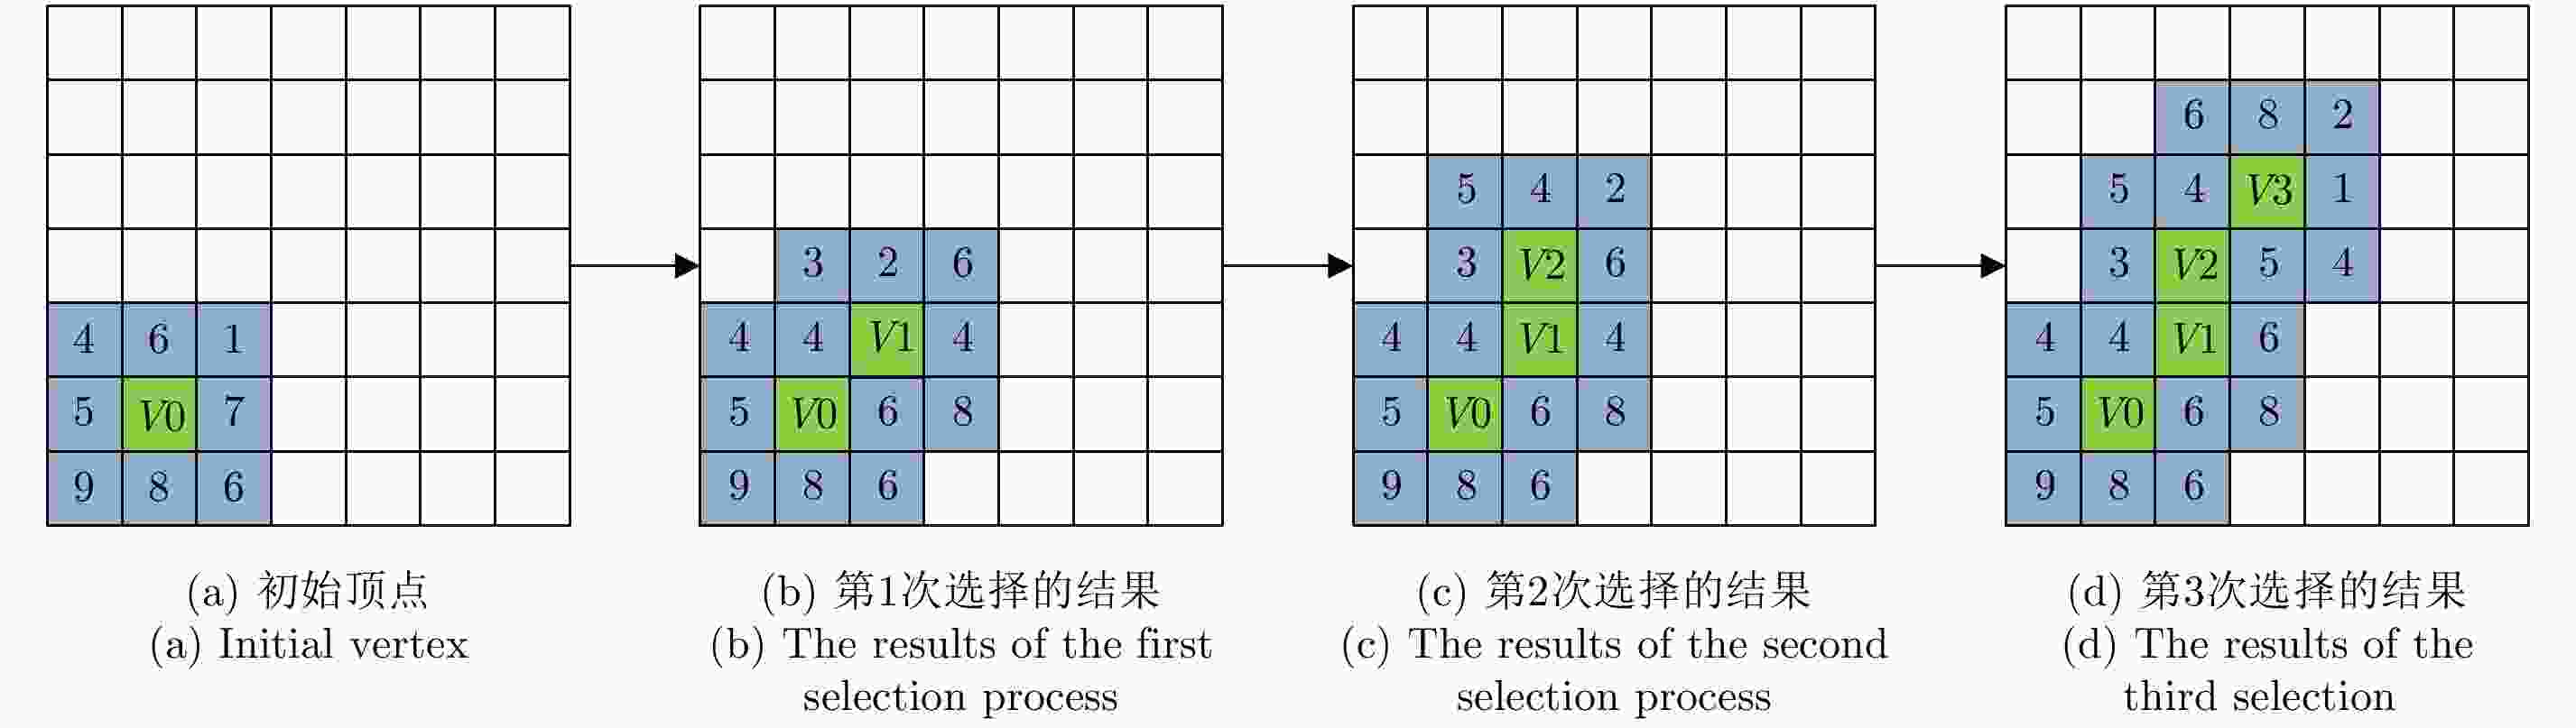
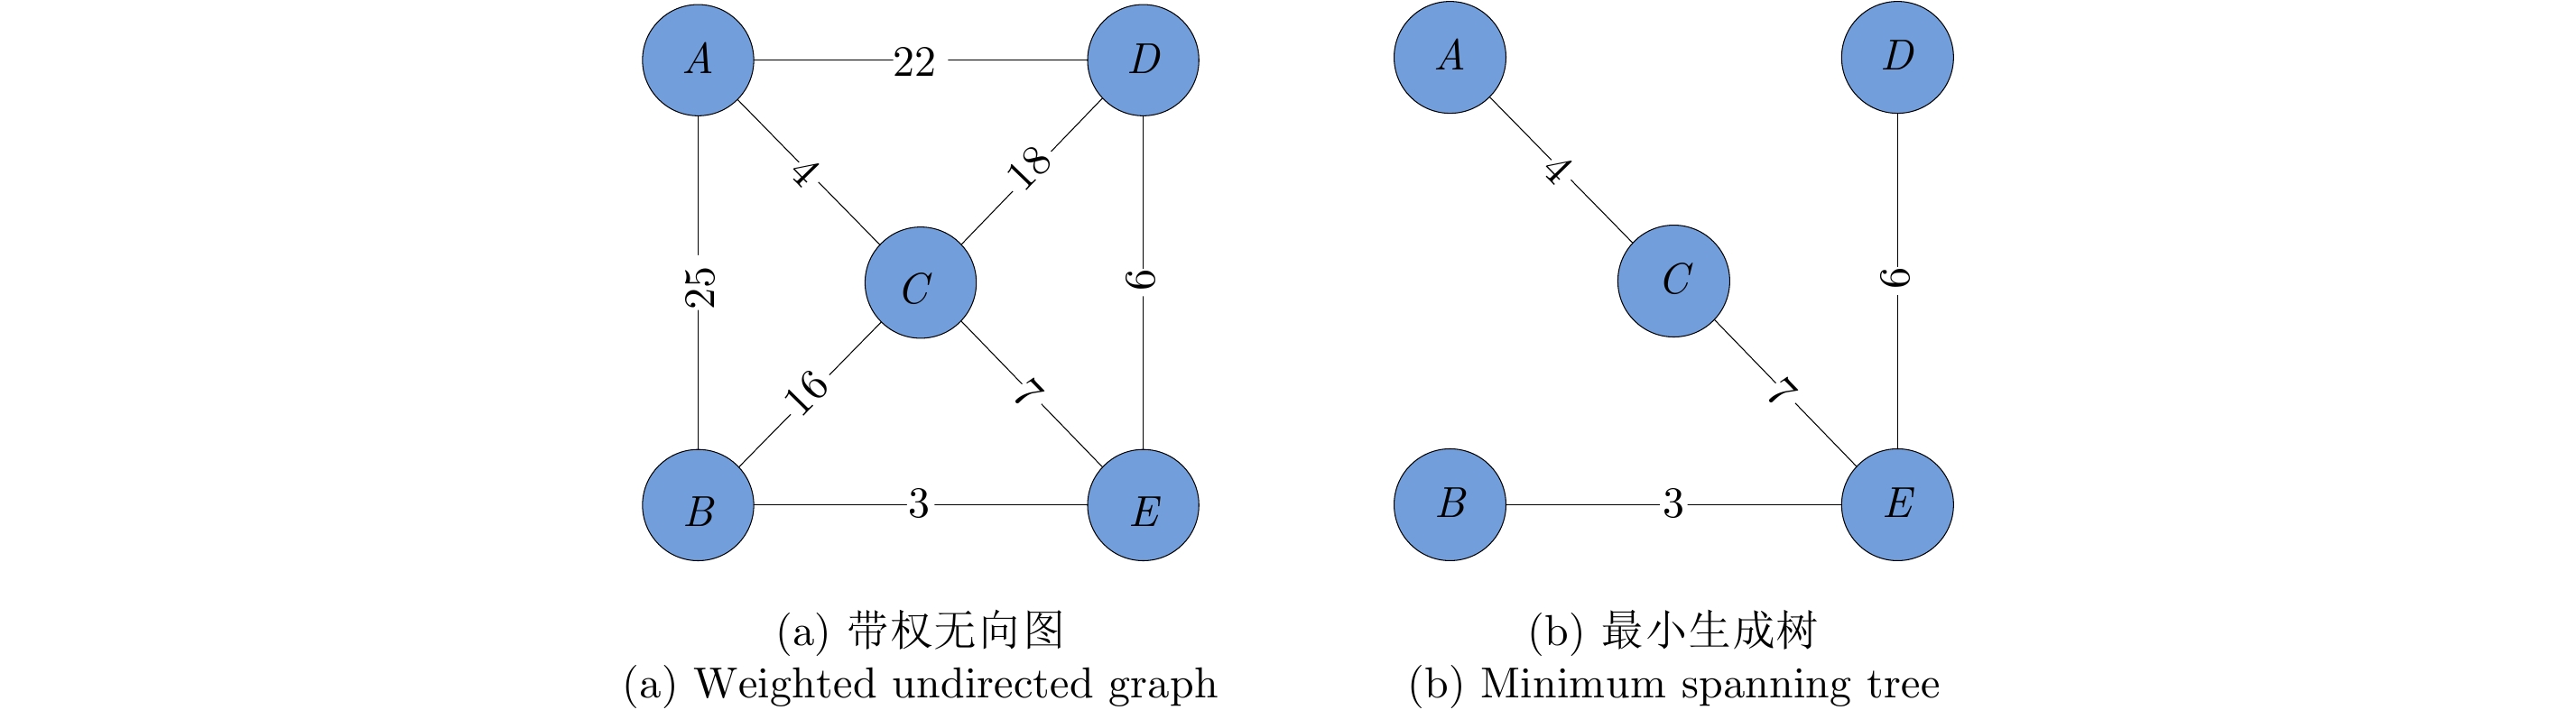
图 4 基于邻域的最小生成树生成过程
Figure 4. The spanning process of neighborhood minimum spanning tree
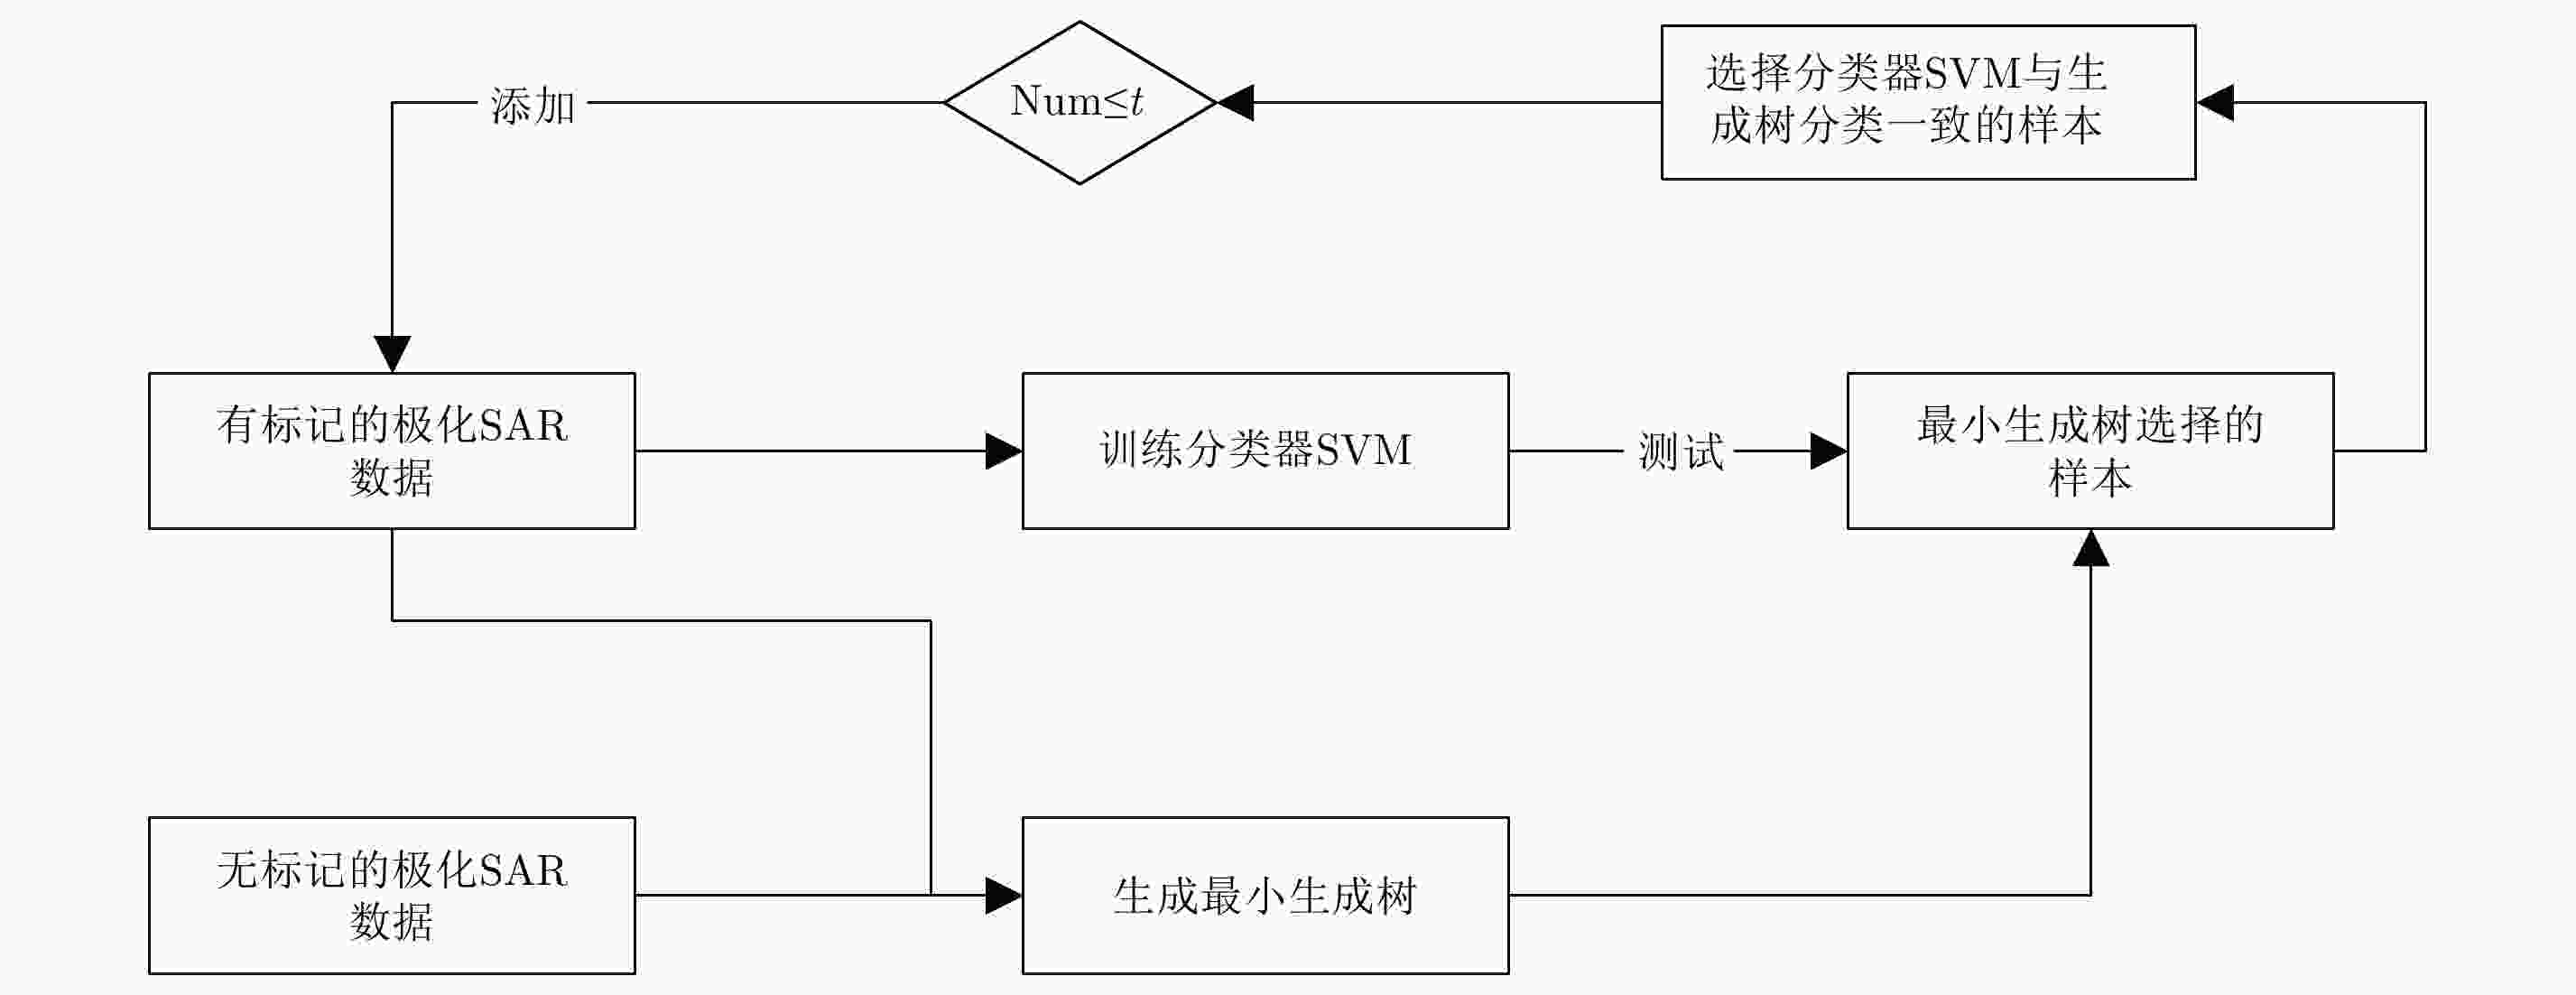
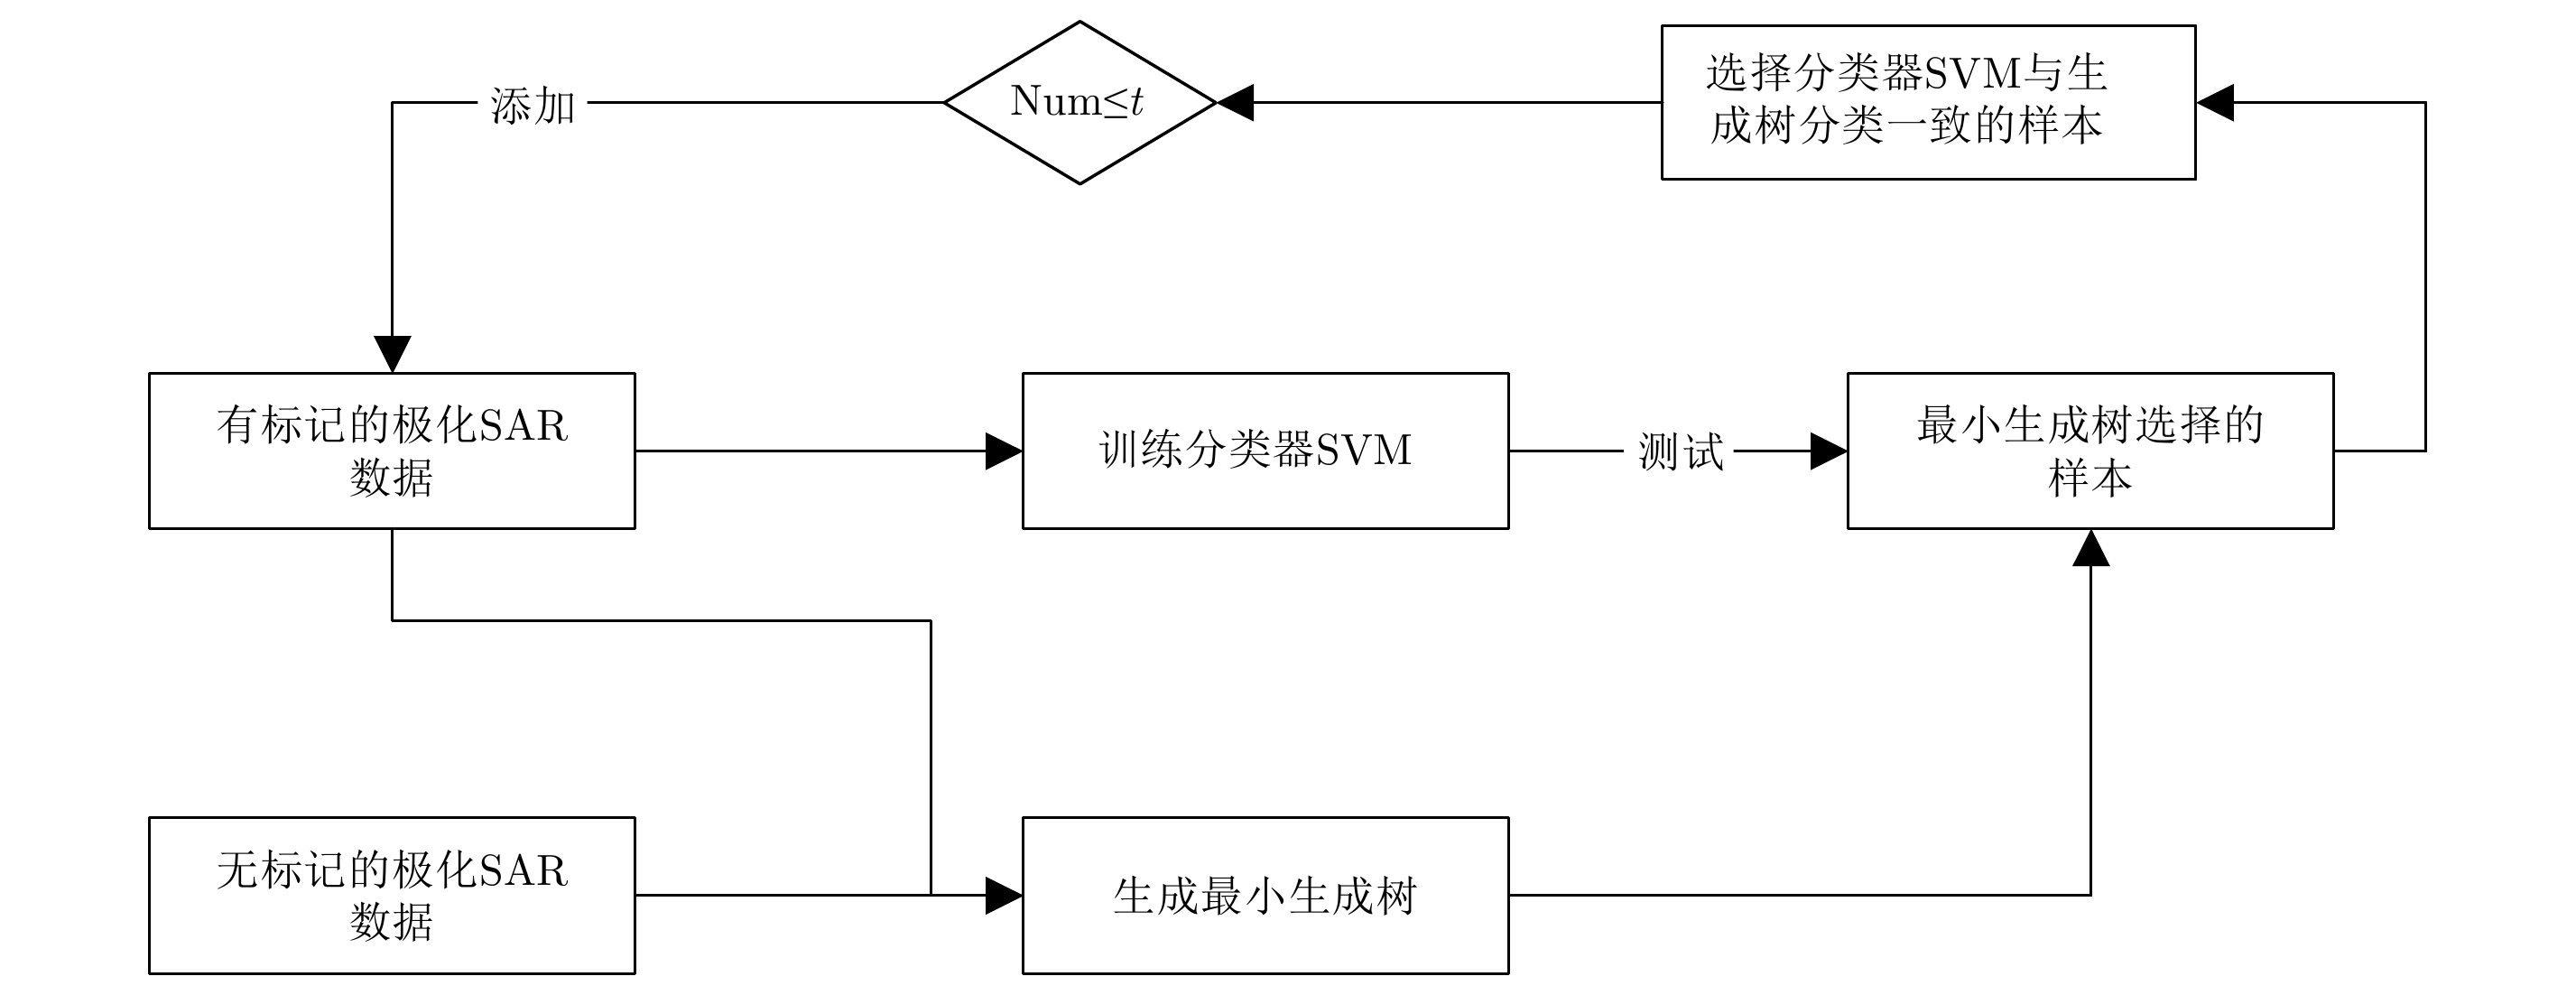
图 5 基于邻域最小生成树的半监督极化SAR分类方法
Figure 5. Semi-supervised PolSAR classification based on the neighborhood minimum spanning tree
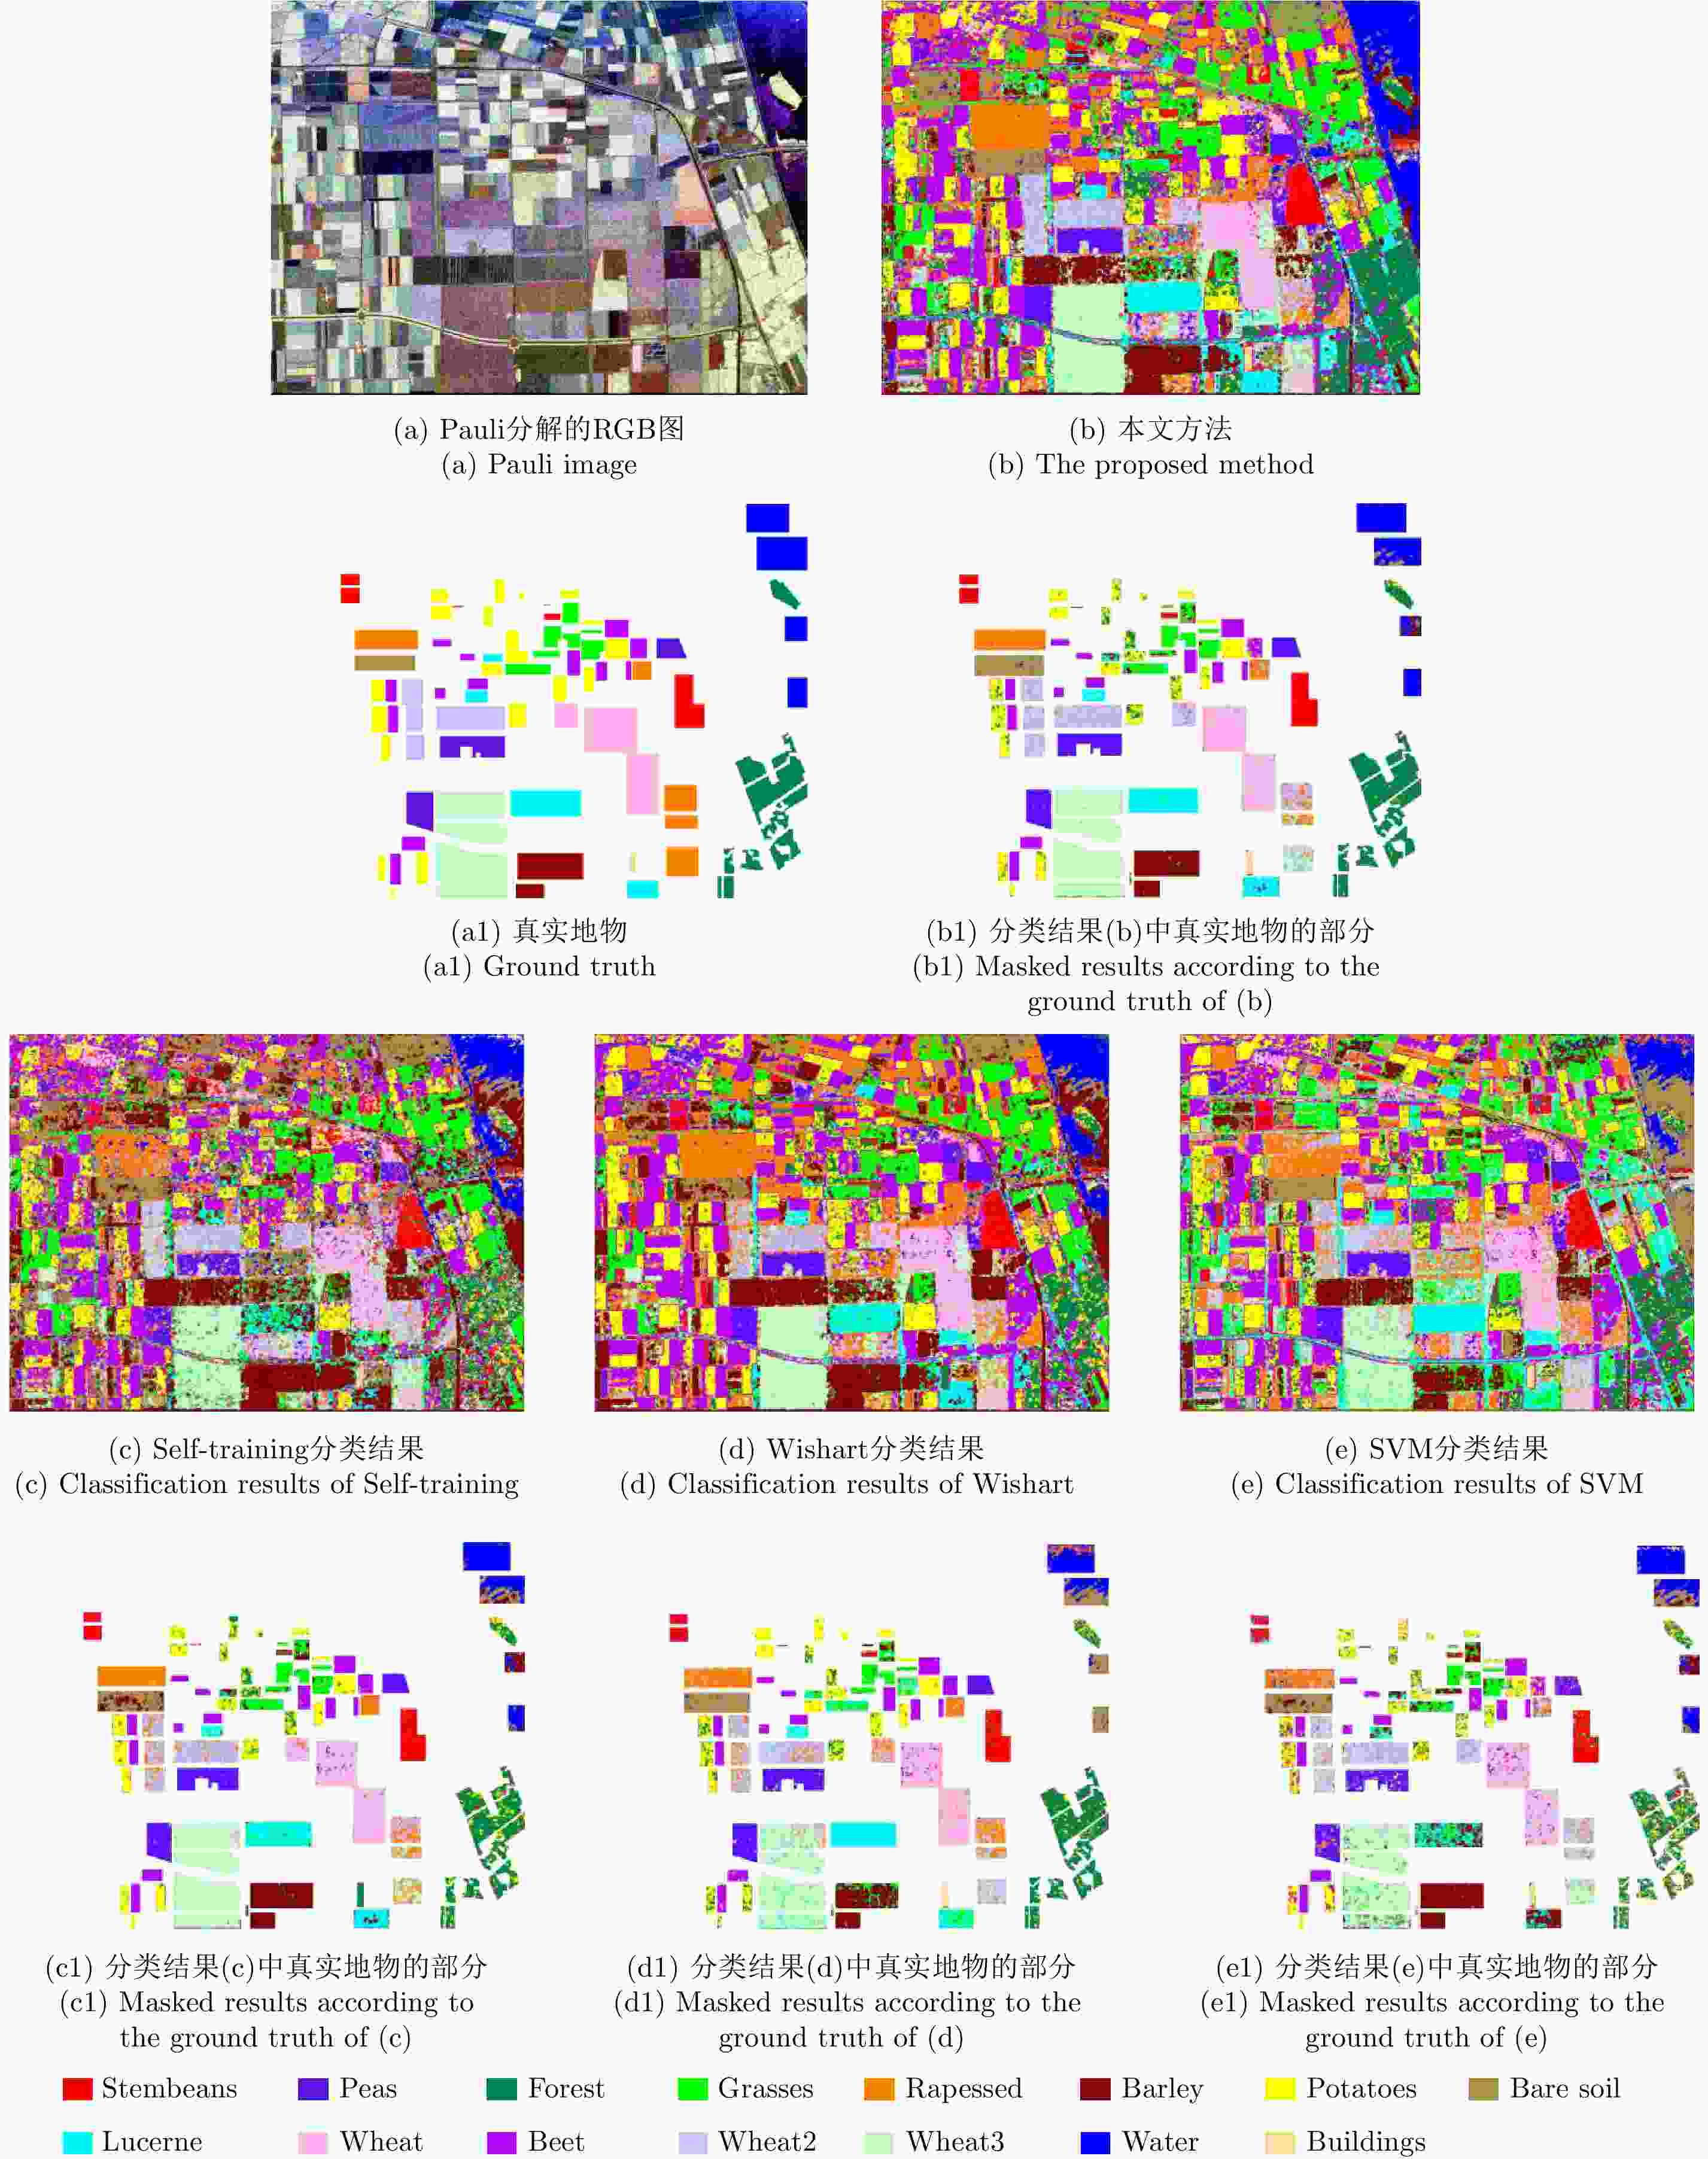
图 6 Flevoland地区AIRSAR L波段数据不同方法的分类结果
Figure 6. Classification results of the Flevoland data acquired by AIRSAR
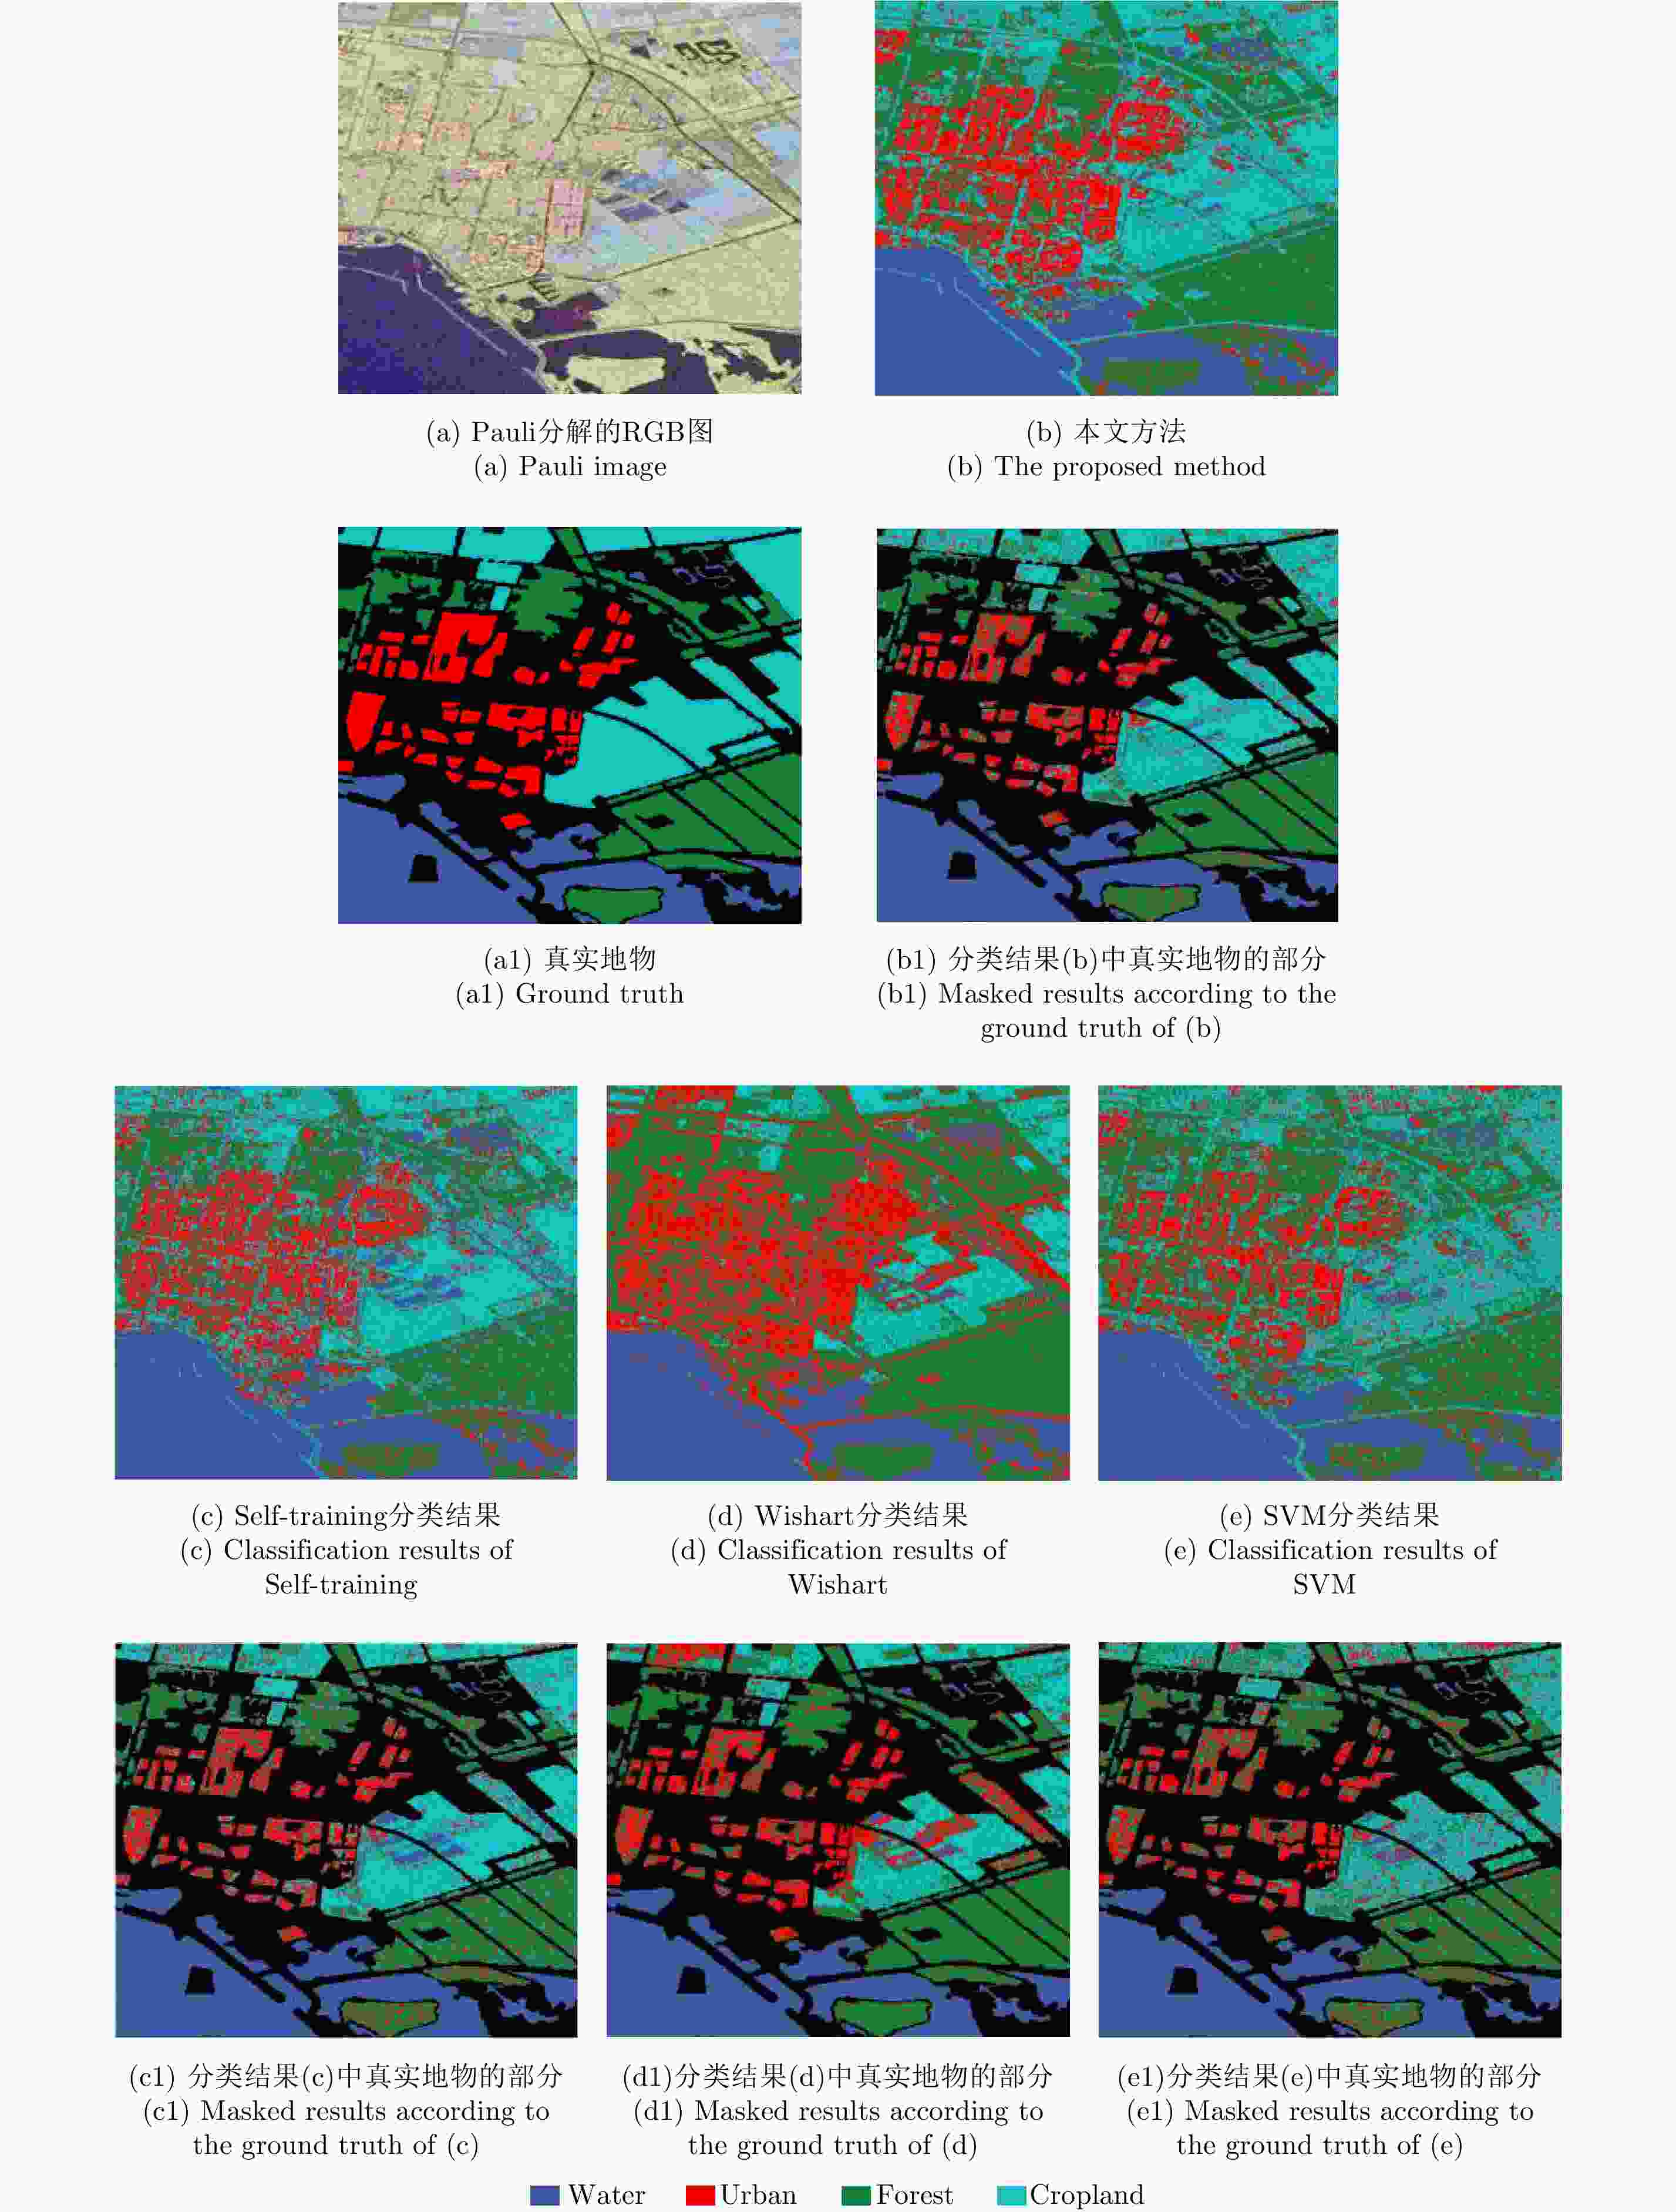
图 7 Flevoland地区Radarsat-2 C波段数据不同方法的分类结果
Figure 7. Classification result of the Flevoland data acquired by Radarsat-2
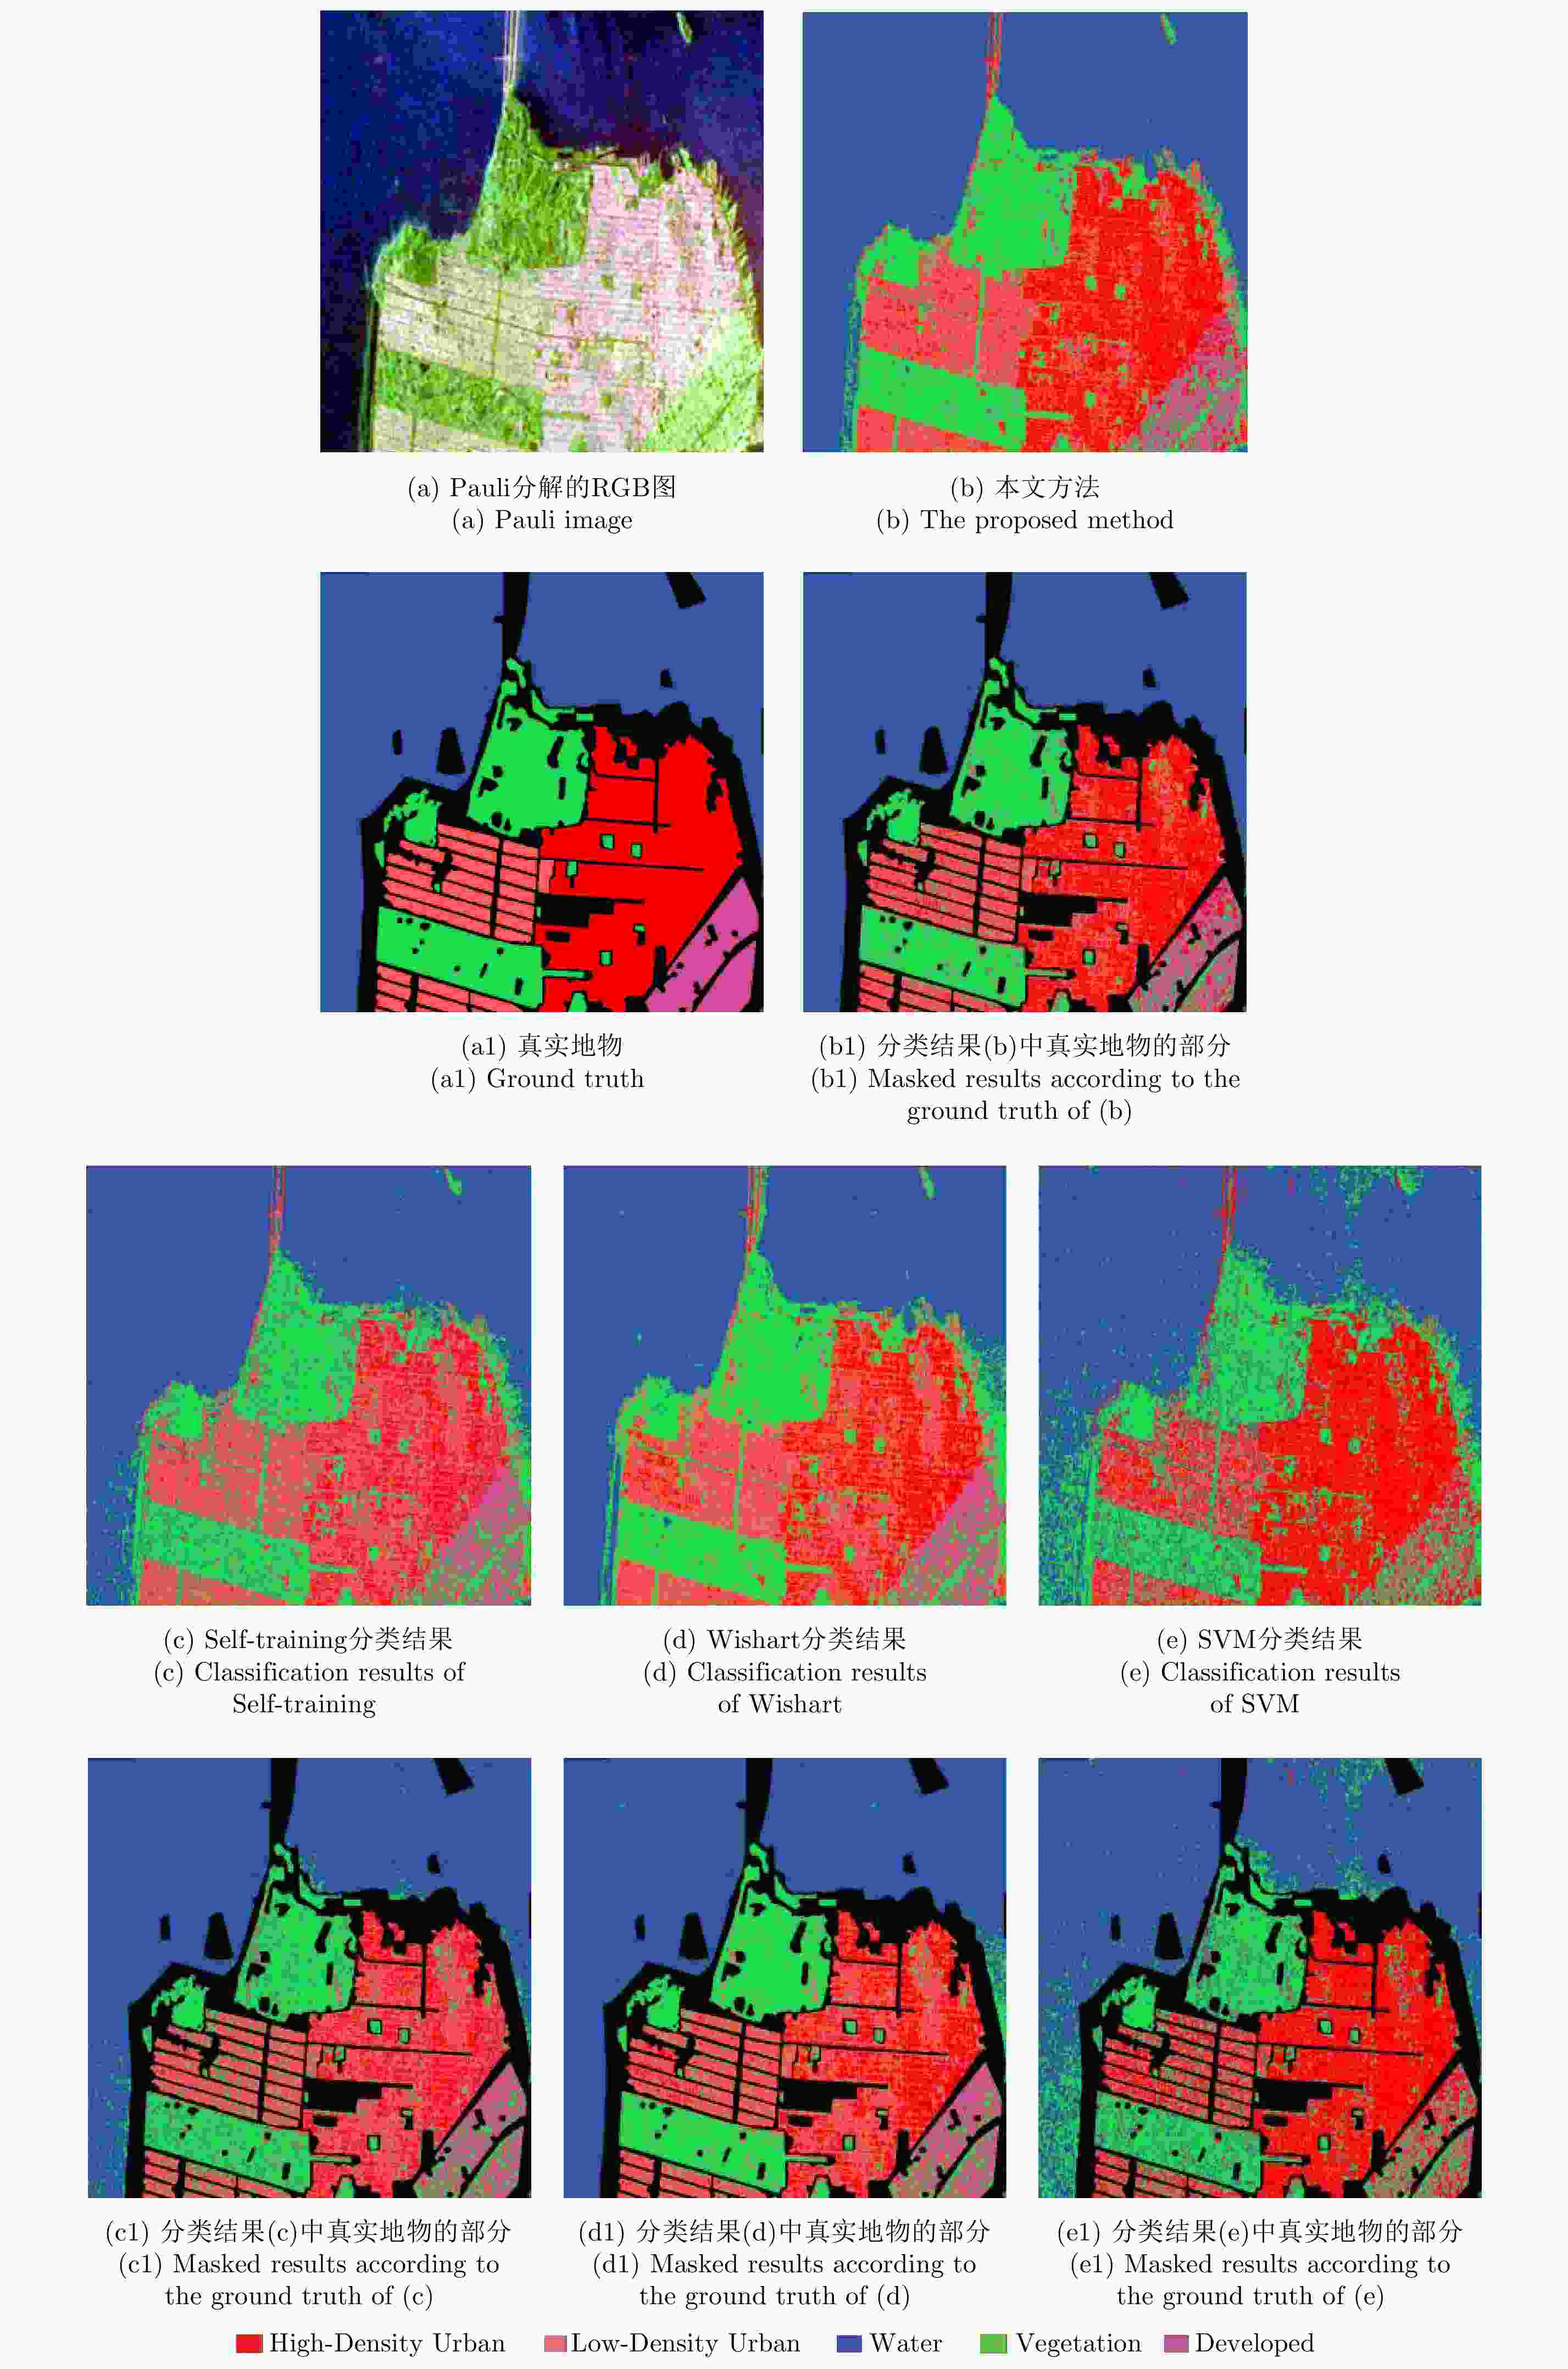
图 8 旧金山地区Radarsat-2 C波段数据不同方法的分类结果
Figure 8. Classification result of the San Francisco data acquired by Radarsat-2
表 1 AIRSAR L波段的Felvoland地区不同分类算法的分类精度(%)
Table 1. Classification accuracy of the Flevoland area acquired by AIRSAR L band (%)
区域 方法 Wishart SVM Self-training 本文方法 Stembeans 91.48 70.07 90.82 98.75 Rapeseed 61.83 38.02 67.14 59.58 Bare soil 97.51 86.89 70.97 96.75 Potatoes 79.47 58.38 80.27 81.99 Beet 92.35 85.61 95.05 94.60 Wheat 2 67.43 71.80 67.39 89.86 Peas 93.10 77.70 95.24 97.56 Wheat 3 82.08 82.42 94.33 97.05 Lucerne 84.53 40.77 81.67 95.06 Barley 81.96 98.29 98.62 98.39 Wheat 81.46 68.28 85.34 85.41 Grasses 66.49 65.03 81.75 80.08 Forest 84.21 61.03 77.66 94.77 Water 46.85 65.32 69.39 93.35 Building 81.77 78.91 2.18 85.58 OA 79.40 70.30 77.19 89.92  下载: 导出CSV
表 2 AIRSAR L波段的Felvoland 地区不同训练样本的分类结果
Table 2. Classification results of the Flevoland area acquired by AIRSAR L band with different number of training samples
方法 训练样本数 4 6 8 10 OA (%) Kappa OA (%) Kappa OA (%) Kappa OA (%) Kappa Wishart 74.62 0.7215 76.19 0.7459 78.78 0.7656 80.26 0.7831 SVM 56.07 0.5423 58.12 0.5611 64.42 0.6102 70.30 0.6682 Self-training 63.36 0.6025 68.42 0.6569 73.89 0.7146 77.23 0.7489 本文方法 79.33 0.7888 83.06 0.8093 86.90 0.8416 89.92 0.8852
下载: 导出CSV
表 3 Radarsat-2 C波段的Felvoland地区不同分类算法的分类精度(%)
Table 3. Classification accuracy of the Flevoland area acquired by Radarsat-2 C band (%)
区域 方法 Wishart SVM Self-training 本文方法 Urban 69.61 54.75 63.93 71.44 Water 98.71 96.83 99.10 98.82 Forest 91.65 65.25 73.83 83.63 Cropland 55.27 78.97 79.23 82.24 OA 78.81 73.95 79.02 84.03
下载: 导出CSV
表 4 Radarsat-2 C波段的Felvoland 地区不同训练样本的分类结果
Table 4. Classification results of the Flevoland area acquired by Radarsat-2 C band with different number of training samples
方法 训练样本数 4 6 8 10 OA (%) Kappa OA (%) Kappa OA (%) Kappa OA (%) Kappa Wishart 69.21 0.5803 73.65 0.6239 76.81 0.6854 78.81 0.7026 SVM 50.79 0.4153 64.79 0.5471 70.05 0.5968 73.95 0.6394 Self-training 65.69 0.5233 70.41 0.5911 74.40 0.6605 79.45 0.7144 本文方法 76.71 0.6768 79.29 0.7235 82.02 0.7644 84.03 0.7882
下载: 导出CSV
表 5 Radarsat-2 C波段的旧金山地区不同分类算法的分类结果(%)
Table 5. Classification accuracy of the San Francisco area acquired by radarsat-2 C Band (%)
区域 方法 Wishart SVM Self-training 本文方法 Water 98.70 90.04 98.04 99.92 Vegetation 91.03 78.51 84.45 91.50 Low-Density Urban 81.30 42.31 70.18 75.05 High-Density Urban 42.58 77.15 33.01 68.27 Developed 55.26 24.00 56.16 58.81 OA 73.77 62.40 68.37 78.71
下载: 导出CSV
表 6 Radarsat-2 C波段的旧金山地区不同训练样本的分类结果
Table 6. Classification results of the San Francisco area acquired by Radarsat-2 C band with different number of training samples
方法 训练样本数 4 6 8 10 OA (%) Kappa OA (%) Kappa OA (%) Kappa OA (%) Kappa Wishart 68.09 0.5181 70.44 0.5439 72.49 0.5867 73.77 0.6011 SVM 50.24 0.2817 51.25 0.2905 56.31 0.3628 62.40 0.4342 Self-training 52.34 0.3126 58.62 0.3669 63.27 0.4357 68.42 0.5308 本文方法 70.87 0.5482 73.15 0.5986 75.23 0.6284 78.71 0.6852
下载: 导出CSV
-
[1] NUNZIATA F, MIGLIACCIO M, LI Xiaofeng, et al. Coastline extraction using dual-Polarimetric COSMO-SkyMed PingPong mode SAR data[J]. IEEE Geoscience and Remote Sensing Letters, 2014, 11(1): 104–108. doi: 10.1109/LGRS.2013.2247561 [2] HE Jinglu, WANG Yinghua, LIU Hongwei, et al. A novel automatic PolSAR ship detection method based on superpixel-level local information measurement[J]. IEEE Geoscience and Remote Sensing Letters, 2018, 15(3): 384–388. doi: 10.1109/LGRS.2017.2789204 [3] BUONO A, NUNZIATA F, MIGLIACCIO M, et al. Classification of the yellow river delta area using fully polarimetric SAR measurements[J]. International Journal of Remote Sensing, 2017, 38(23): 6714–6734. doi: 10.1080/01431161.2017.1363437 [4] RATHA D, BHATTACHARYA A, and FRERY A C. Unsupervised classification of PolSAR data using a scattering similarity measure derived from a geodesic distance[J]. IEEE Geoscience and Remote Sensing Letters, 2018, 15(1): 151–155. doi: 10.1109/LGRS.2017.2778749 [5] LI Dong and ZHANG Yunhua. Adaptive model-based classification of PolSAR data[J]. IEEE Transactions on Geoscience and Remote Sensing, 2018, 56(12): 6940–6955. doi: 10.1109/TGRS.2018.2845944 [6] HUANG Xiayuan, ZHANG Bo, QIAO Hong, et al. Local discriminant canonical correlation analysis for supervised PolSAR image classification[J]. IEEE Geoscience and Remote Sensing Letters, 2017, 14(11): 2102–2106. doi: 10.1109/LGRS.2017.2752800 [7] REDOLFI J, SÁNCHEZ J, and FLESIA A G. Fisher vectors for PolSAR image classification[J]. IEEE Geoscience and Remote Sensing Letters, 2017, 14(11): 2057–2061. doi: 10.1109/LGRS.2017.2750800 [8] LIU Hongying, WANG Yikai, YANG Shuyuan, et al. Large polarimetric SAR data semi-supervised classification with spatial-anchor graph[J]. IEEE Journal of Selected Topics in Applied Earth Observations and Remote Sensing, 2016, 9(4): 1439–1458. doi: 10.1109/JSTARS.2016.2518675 [9] HUA W Q, WANG S, YANG Zhao et al. Semi-supervised PolSAR image classification based on improved Tri-training[C]. 2017 IEEE International Geoscience and Remote Sensing Symposium, Fort Worth, USA, 2017:3937-3940. [10] ROSENBERG C, HEBERT M, and SCHNEIDERMAN H. Semi-supervised self-training of object detection models[C]. Proceedings of the 2005 7th IEEE Workshops on Applications of Computer Vision, Breckenridge, USA, 2005: 29–36. [11] BLUM A and MITCHELL T. Combining labeled and unlabeled data with co-training[C]. Proceedings of the 11th Conference on Computational Learning Theory, Madison, USA, 1998: 92–100. [12] ZHU Zhihua and LI Ming. Tri-training: Exploiting unlabeled data using three classifiers[J]. IEEE Transactions on Knowledge and Data Engineering, 2005, 17(11): 1529–1541. doi: 10.1109/TKDE.2005.186 [13] LIU Hongying, WANG Yikai, ZHU Dexiang, et al.. Semi-supervised classification based on anchor-spatial graph for large polarimetric SAR data[C]. Proceedings of 2015 IEEE International Geoscience and Remote Sensing Symposium, Milan, Italy, 2015: 1845–1848. [14] LIU Hongying, ZHU Dexiang, YANG Shuyuan, et al. Semisupervised feature extraction with neighborhood constraints for polarimetric SAR classification[J]. IEEE Journal of Selected Topics in Applied Earth Observations and Remote Sensing, 2016, 9(7): 3001–3015. doi: 10.1109/JSTARS.2016.2532922 [15] WU Wenjin, LI Hailei, ZHANG Lu, et al. High-resolution PolSAR scene classification with pretrained deep convnets and manifold polarimetric parameters[J]. IEEE Transactions on Geoscience and Remote Sensing, 2018, 56(10): 6159–6168. doi: 10.1109/TGRS.2018.2833156 [16] RASMUS A, VALPOLA H, HONKALA M, et al. Semi-supervised learning with ladder networks[J]. arXiv: 1507.02672, 2015. [17] CHENG Yanhua, ZHAO Xin, CAI Rui, et al. Semi-supervised multimodal deep learning for RGB-D object recognition[C]. Proceedings of the 25th International Joint Conference on Artificial Intelligence, New York, USA, 2016: 3345–3351. [18] HÄNSCH R and HELLWICH O. Semi-supervised learning for classification of polarimetric SAR-data[C]. Proceedings of 2009 IEEE International Geoscience and Remote Sensing Symposium, Cape Town, South Africa, 2009: 987–990. [19] Liu H Y, Wang Y K, Zhua D X et al.. Semi-supervised classification based on anchor-spatial graph for large polarimetric SAR data[C]. 2015 IEEE International Geoscience and Remote Sensing Symposium, Milan, Italy, 2015: 1845-1848. [20] HUA Wenqiang, WANG Shuang, LIU Hongying, et al. Semisupervised PolSAR image classification based on improved cotraining[J]. IEEE Journal of Selected Topics in Applied Earth Observations and Remote Sensing, 2017, 10(11): 4971–4986. doi: 10.1109/JSTARS.2017.2728067 [21] GENG Jie, MA Xiaorui, FAN Jianchao, et al. Semisupervised classification of polarimetric SAR image via superpixel restrained deep neural network[J]. IEEE Geoscience and Remote Sensing Letters, 2018, 15(1): 122–126. doi: 10.1109/LGRS.2017.2777450 [22] LASZLO M and MUKHERJEE S. Minimum spanning tree partitioning algorithm for microaggregation[J]. IEEE Transactions on Knowledge and Data Engineer, 2005, 17(7): 902–911. doi: 10.1109/TKDE.2005.112 [23] 王晓东. 计算机算法设计与分析[M]. 第4版, 北京: 电子工业出版社, 2012: 103–104.WANG Xiaodong. Design and Analysis of Algorithms[M]. 4th Ed, Beijing: China, Electronic Industry Press, 2002: 103–104. [24] LEE J S, GRUNES M R, AINSWORTH T L, et al. Unsupervised classification using polarimetric decomposition and the complex Wishart classifier[J]. IEEE Transactions on Geoscience and Remote Sensing, 1999, 37(5): 2249–2258. doi: 10.1109/36.789621 [25] LEE J S, GRUNES M R, and DE GRANDI G. Polarimetric SAR speckle filtering and its implication for classification[J]. IEEE Transactions on Geoscience and Remote Sensing, 1999, 37(5): 363–373. doi: 10.1109/36.789635 [26] LONG Y, and LIU X. SVM lithological classification of PolSAR image in yushigou Area, Qilian Mountain[J]. Scientific Journal of Earth Science, 2013, 3(4): 128–132. [27] LEE J S, GRUNES M R, and KWOK R. Classification of multi-look polarimetric SAR imagery based on complex Wishart distribution[J]. International Journal of Remote Sensing, 1994, 15(11): 2299–2311. doi: 10.1080/01431169408954244 -


计量
- 文章访问数:
- HTML全文浏览量:
- PDF下载量:
- 被引次数: 0

