
 作者中心
作者中心 专家审稿
专家审稿 责编办公
责编办公 编辑办公
编辑办公
Deep Learning as Applied in SAR Target Recognition and Terrain Classification
-
摘要:
深度卷积网络等深度学习算法变革了计算机视觉领域,在多种应用上的效果都超过了以往传统图像处理算法。该文简要回顾了将深度学习应用在SAR图像目标识别与地物分类中的工作。利用深度卷积网络从SAR图像中自动学习多层的特征表征,再利用学习到的特征进行目标检测与目标分类。将深度卷积网络应用于SAR目标分类数据集MSTAR上,10类目标平均分类精度达到了99%。针对带相位的极化SAR图像,该文提出了复数深度卷积网络,将该算法应用于全极化SAR图像地物分类,Flevoland 15类地物平均分类精度达到了95%。
Abstract:Deep learning such as deep neural networks has revolutionized the computer vision area. Deep learning-based algorithms have surpassed conventional algorithms in terms of performance by a significant margin. This paper reviews our works in the application of deep convolutional neural networks to target recognition and terrain classification using the SAR image. A convolutional neural network is employed to automatically extract a hierarchic feature representation from the data, based on which the target recognition and terrain classification can be conducted. Experimental results on the MSTAR benchmark dataset reveal that deep convolutional network could achieve a state-of-the-art classification accuracy of 99% for the 10-class task. For a polarimetric SAR image classification, we propose complex-valued convolutional neural networks for complex SAR images. This algorithm achieved a state-of-the-art accuracy of 95% for the 15-class task on the Flevoland benchmark dataset.
-

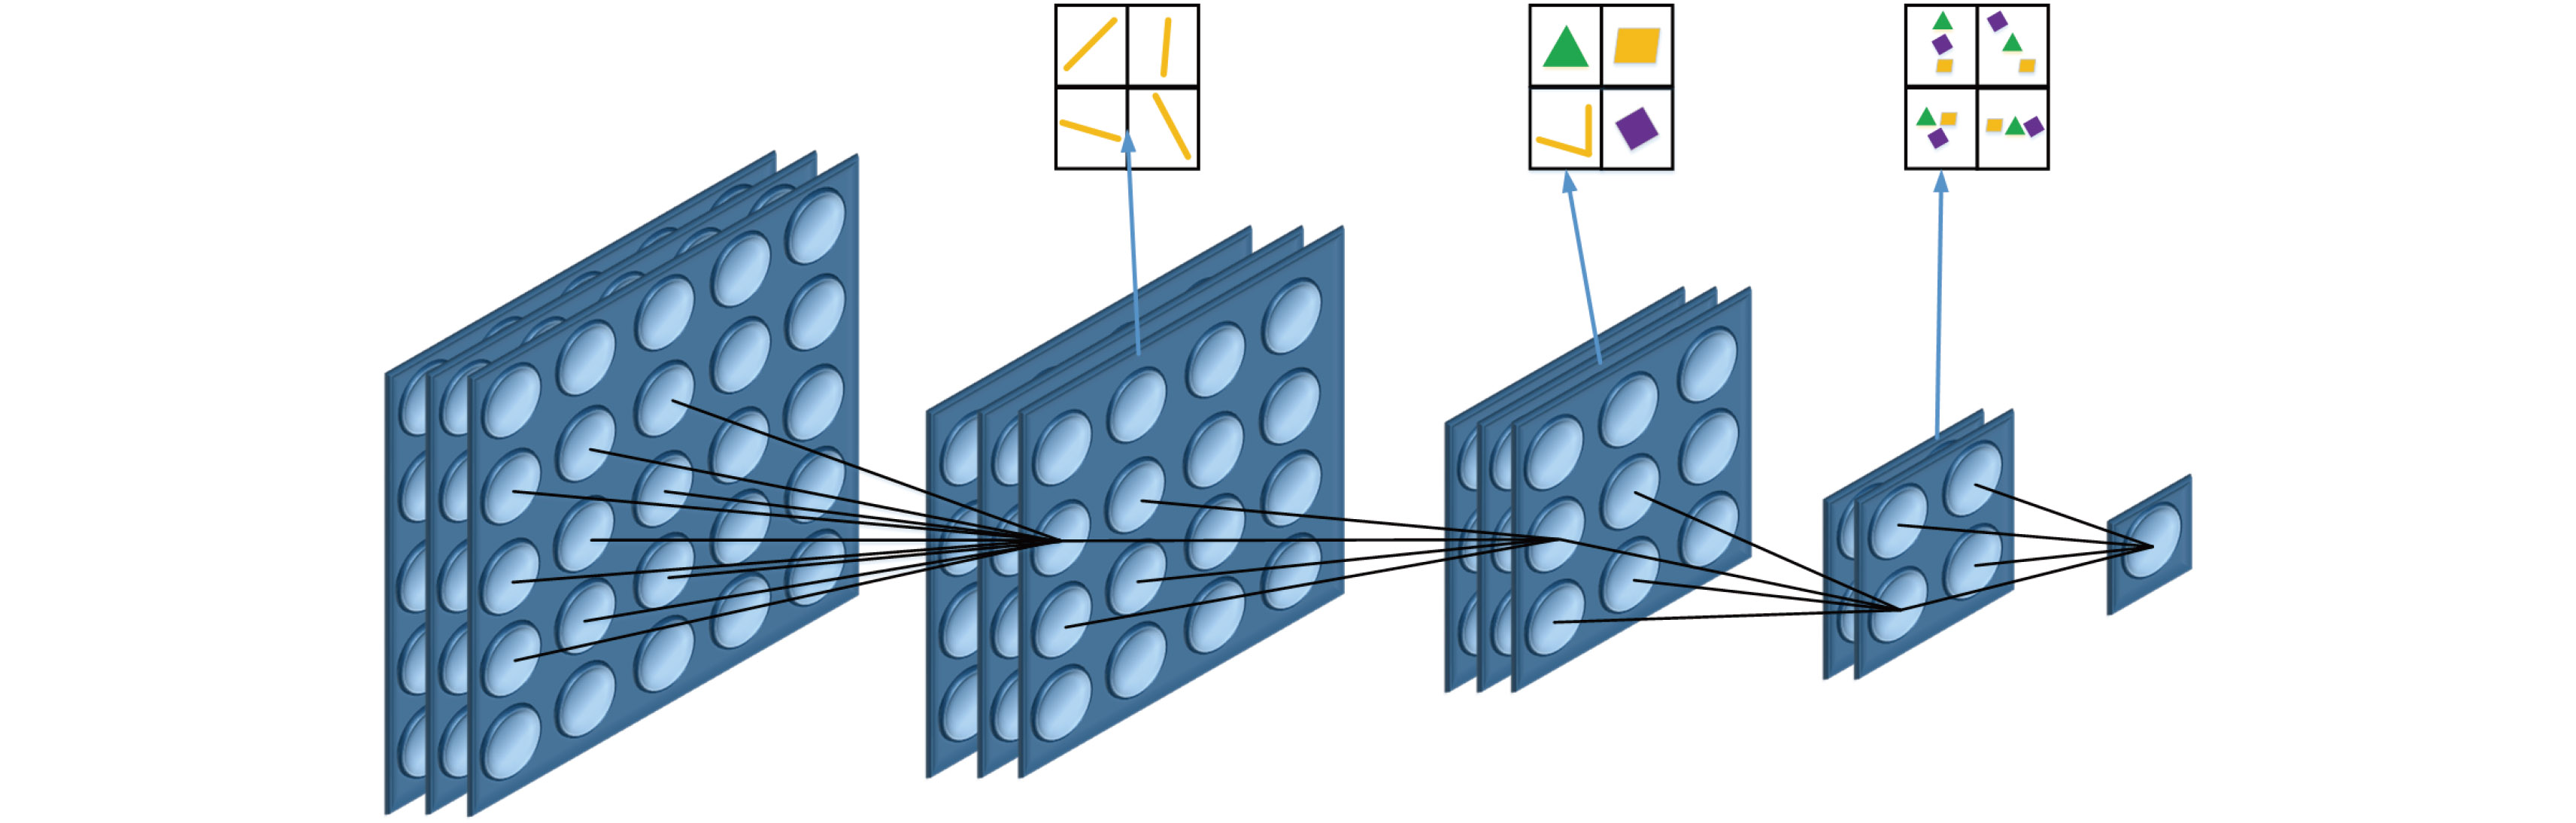
图 2 层次化可组合的特性表征能力
Figure 2. Hierarchical compositional feature representation capability

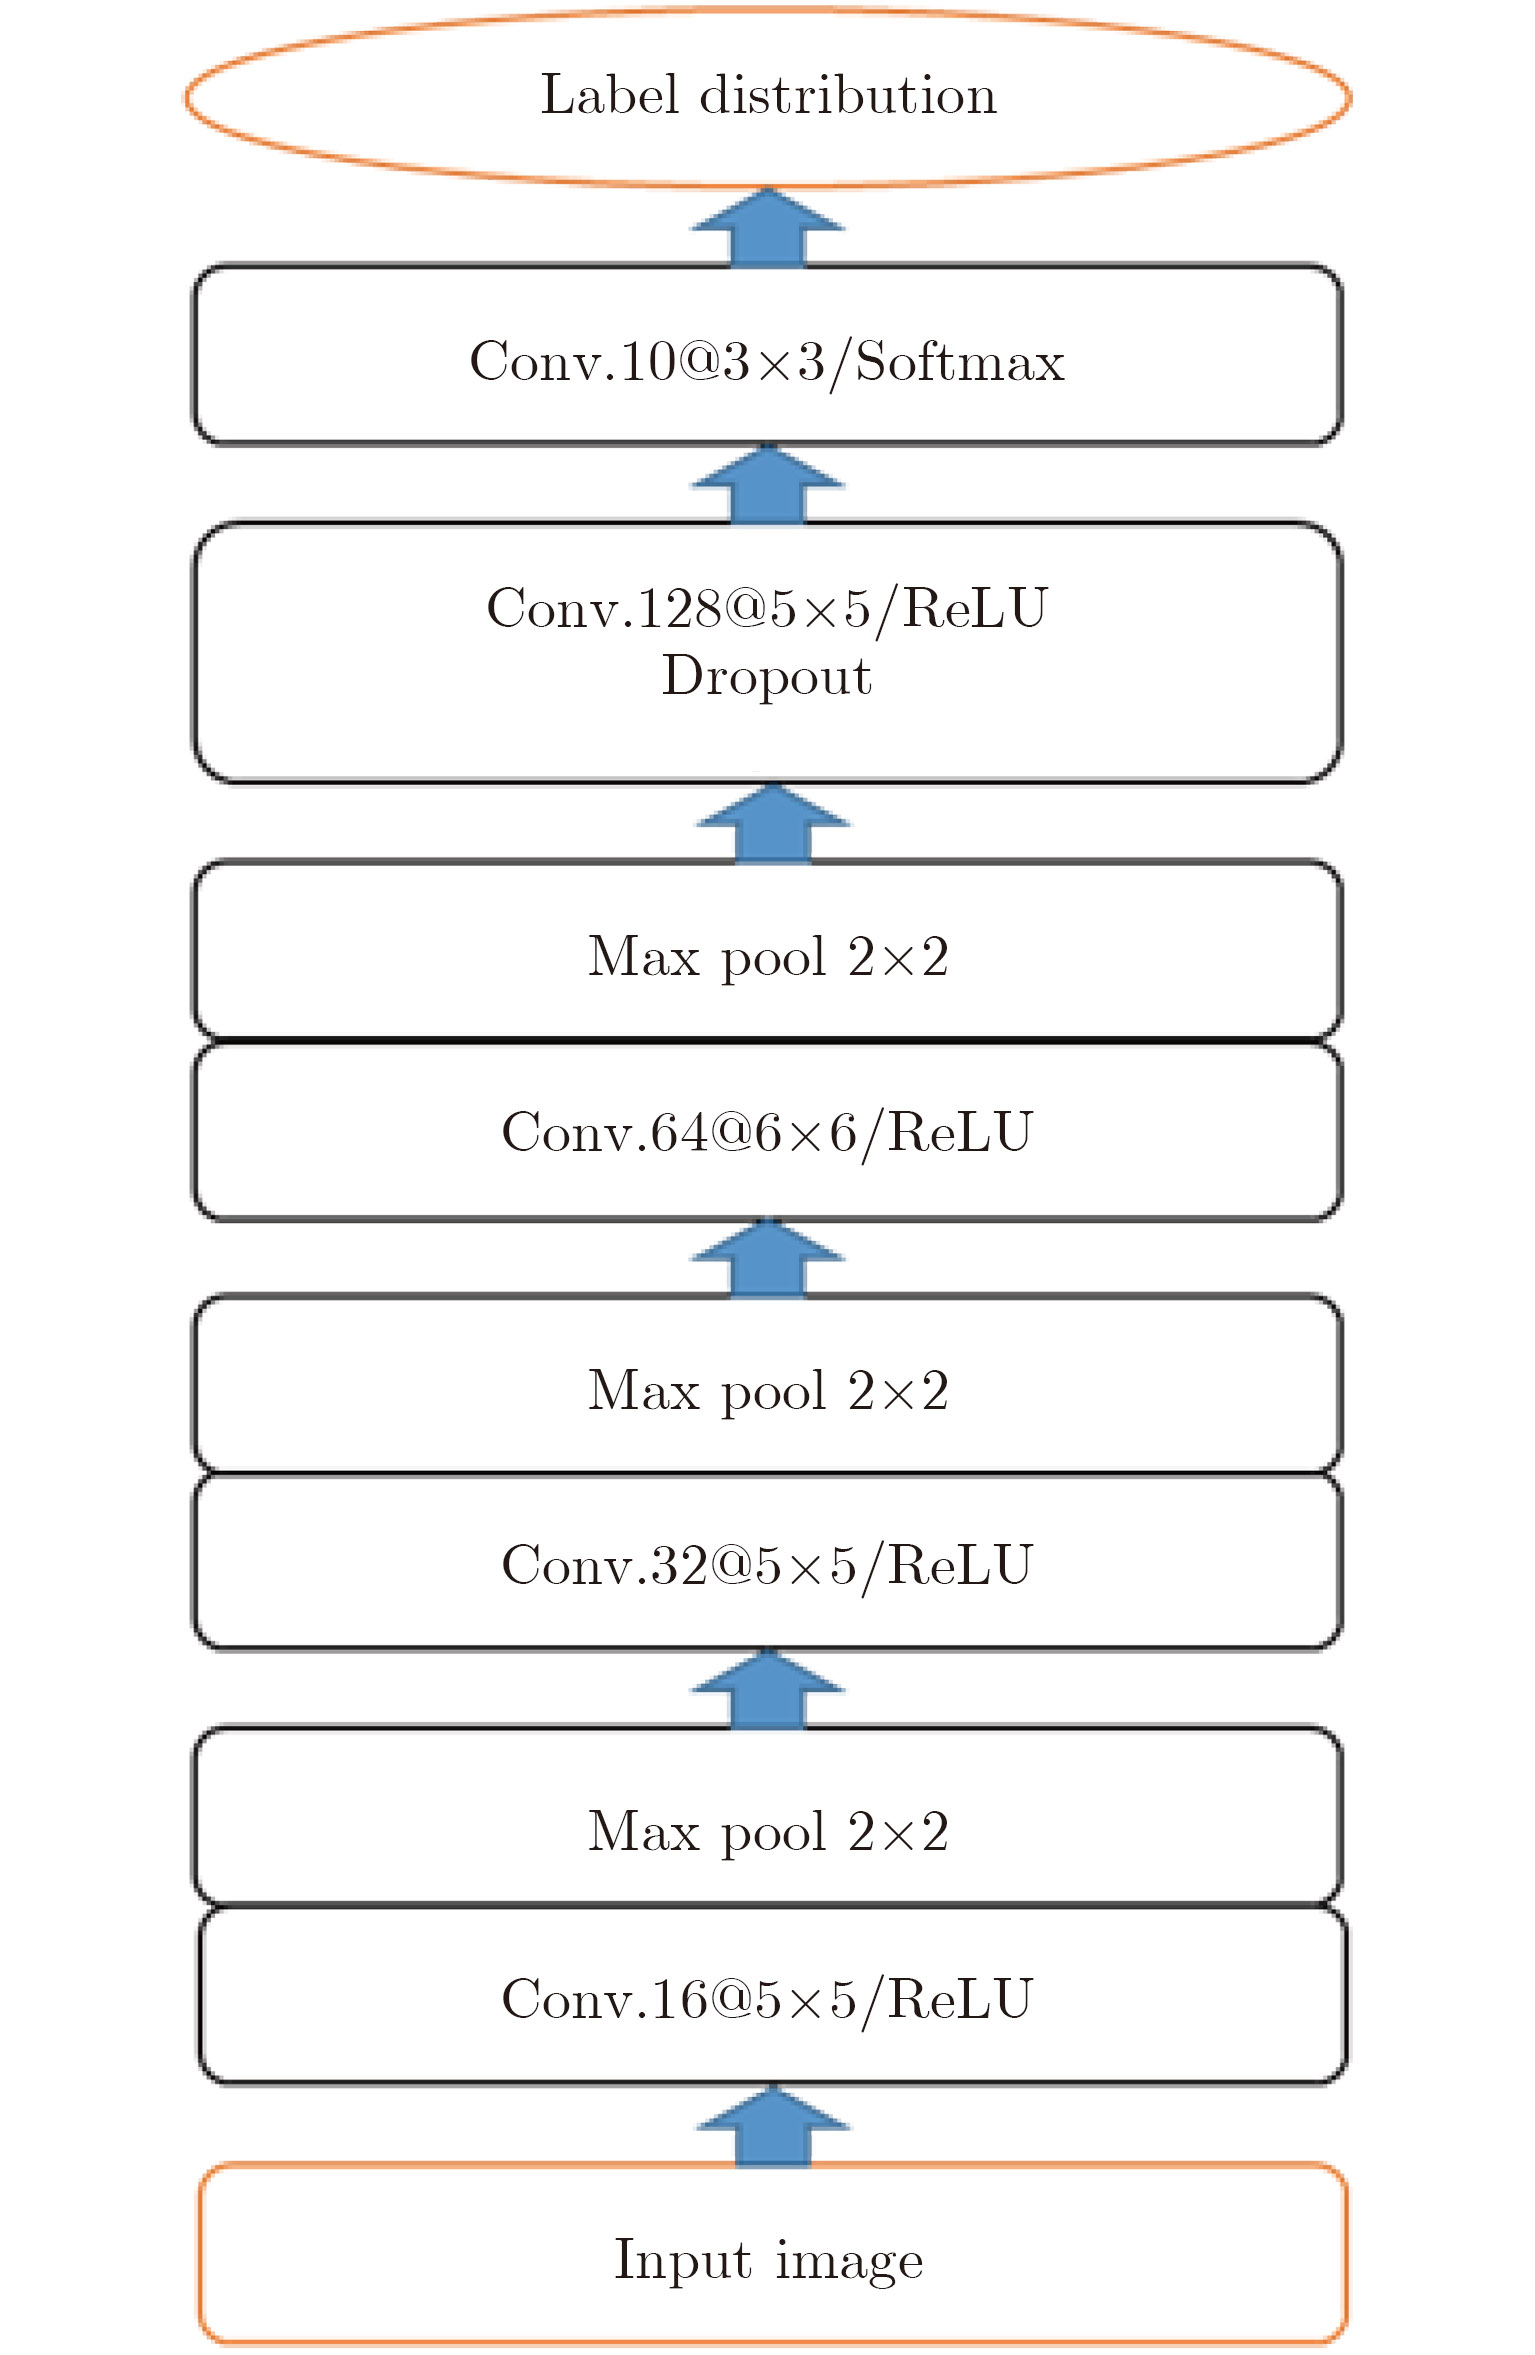
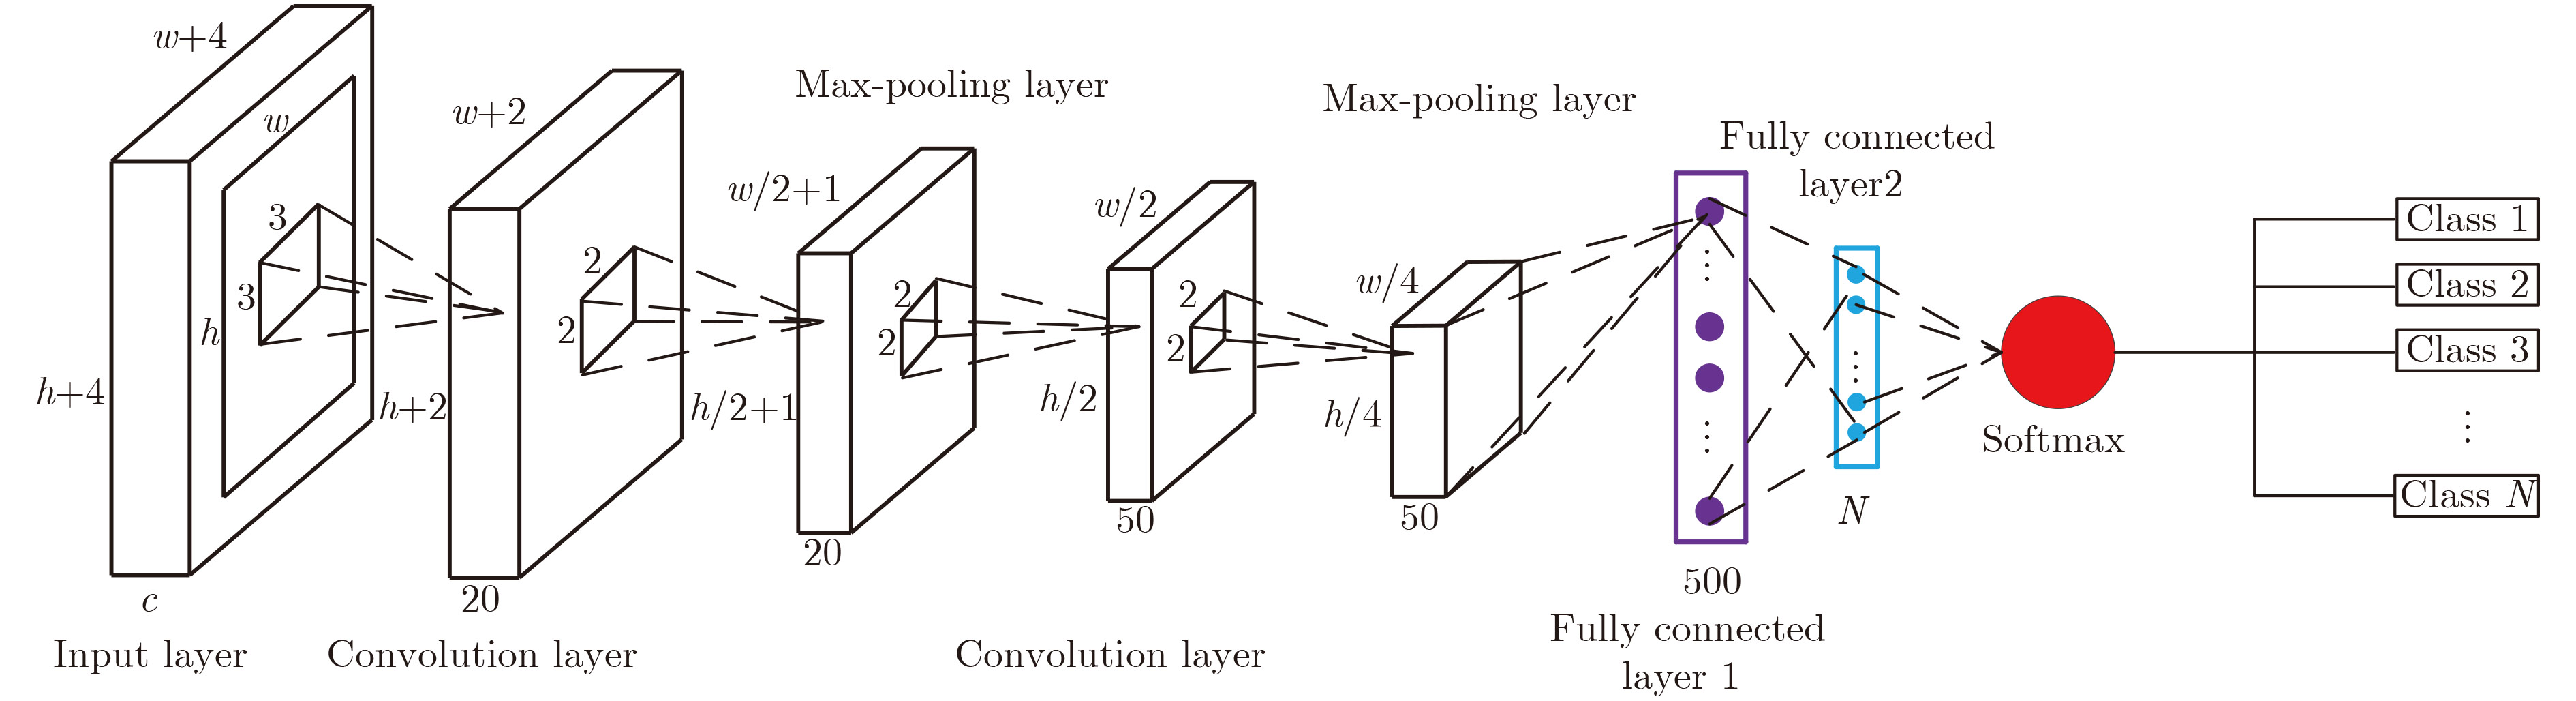
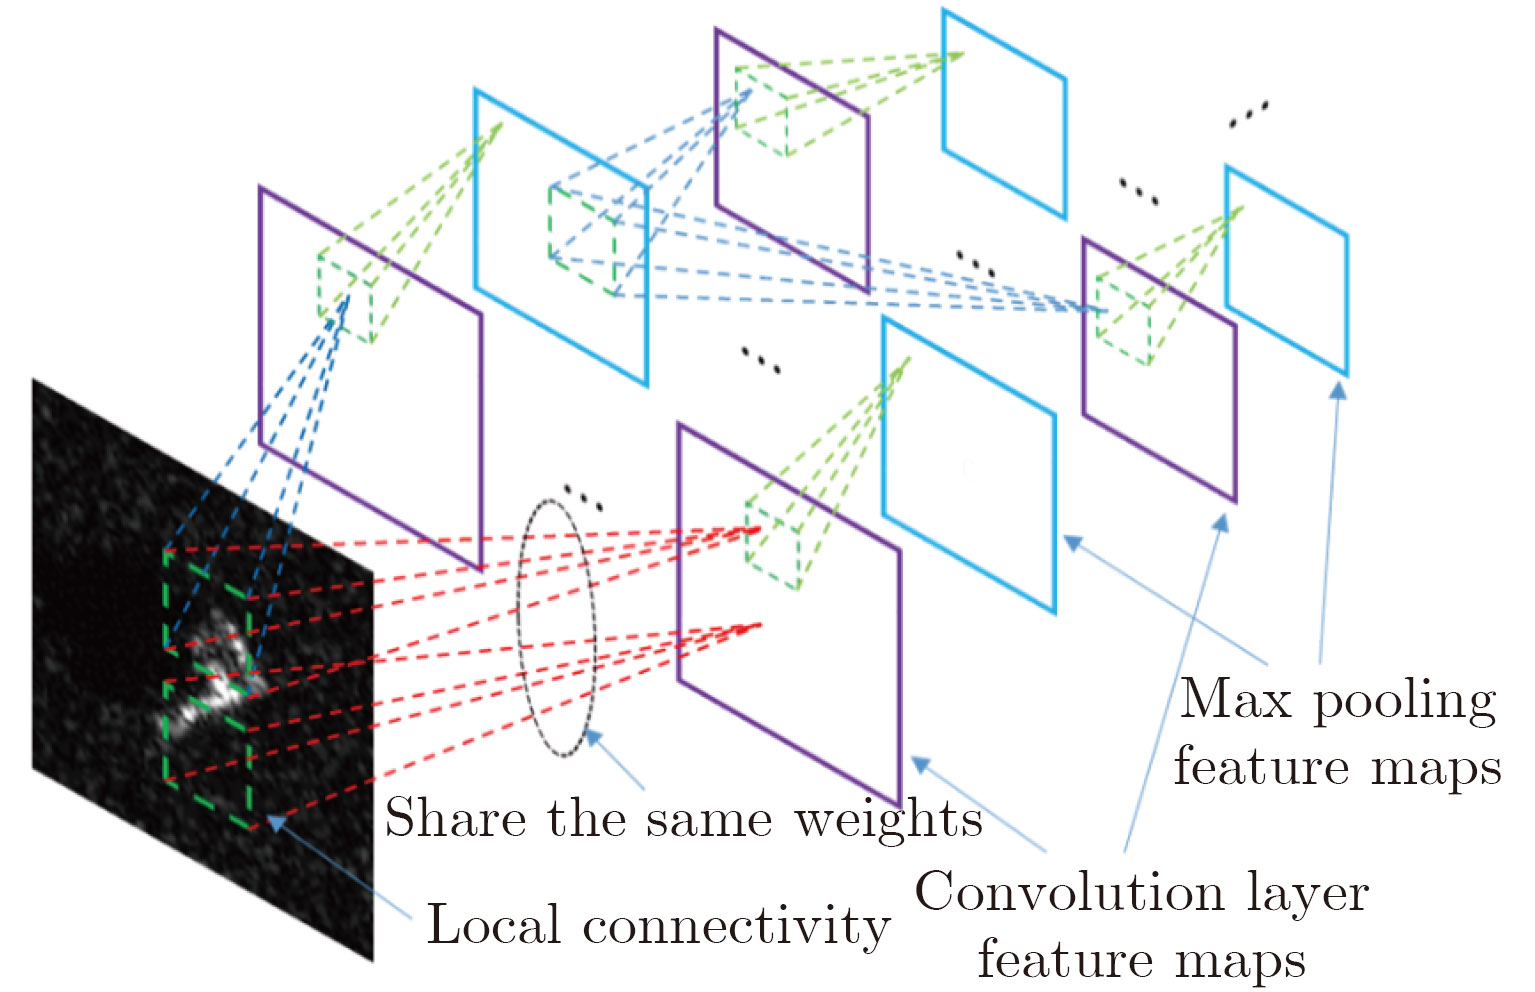
图 6 网络整体结构,包含5个可训练层。卷积层表示为“conv.(卷积核数量)@(卷积核大小)”
Figure 6. Network architecture, including 5 trainable layers. Convolution layer is denoted as “conv.(kernel depth)@(kernel size)”

图 7 10类军事目标示例:光学图像 vs. SAR图像
Figure 7. Ten-class military targets: optical image vs. SAR image

图 9 全极化L-波段旧金山地区AirSAR图像
Figure 9. Fully-polarimetric L-band AirSAR image of San Francisco area

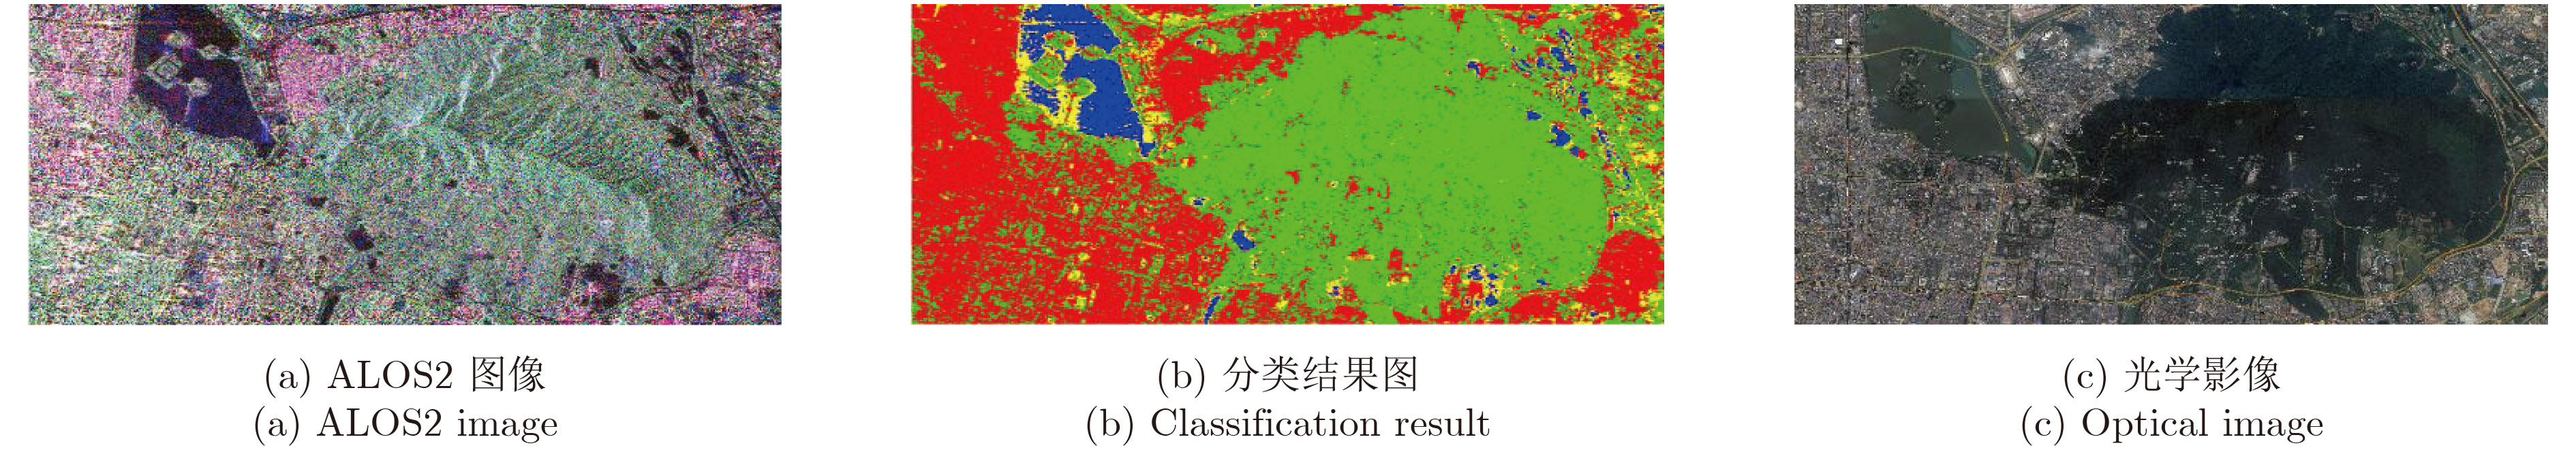
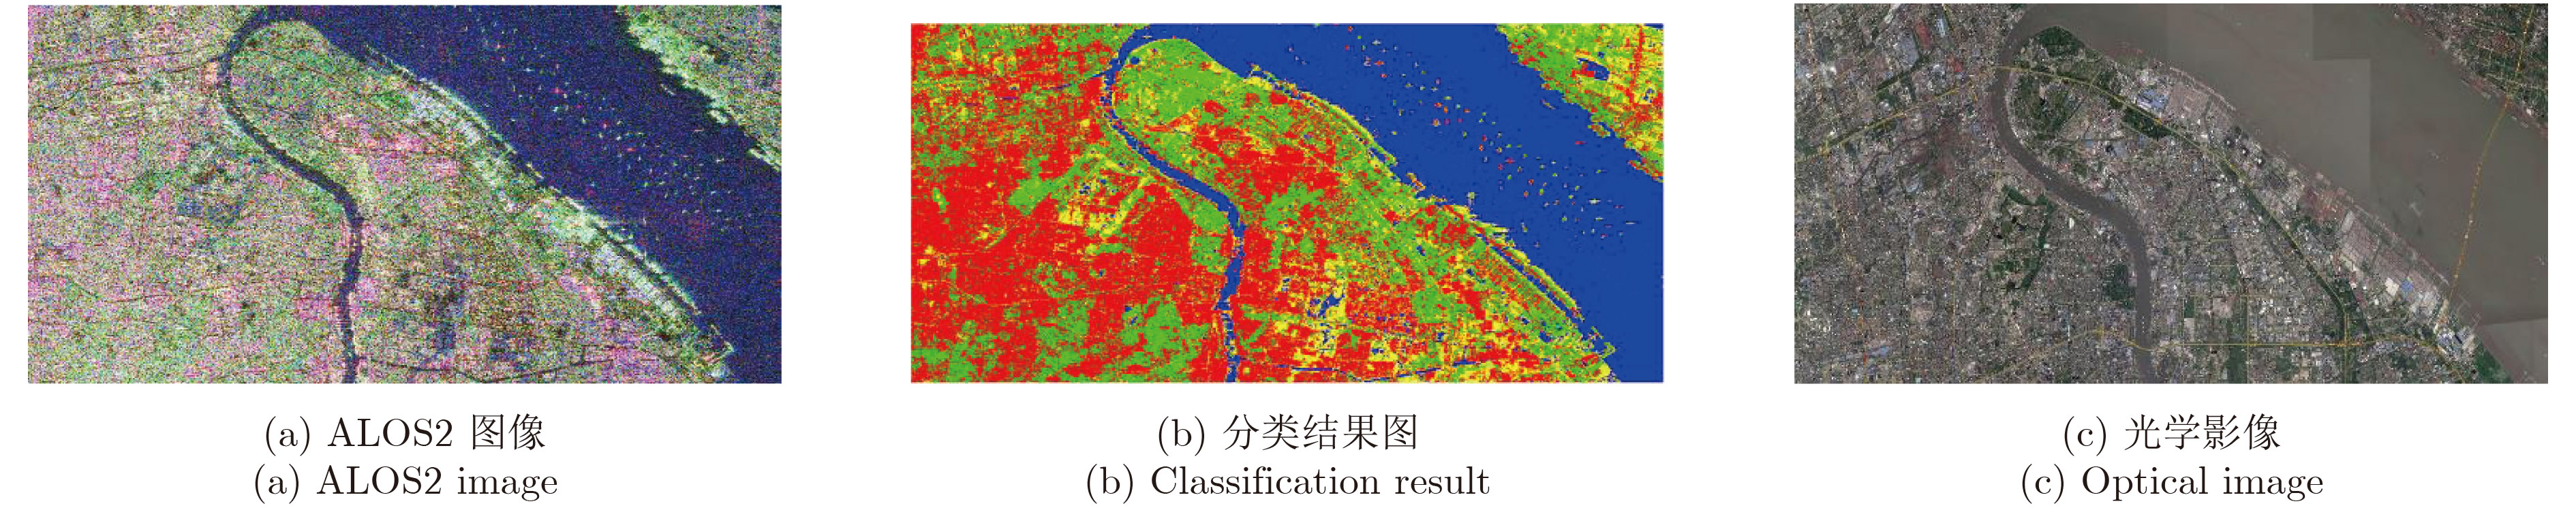
图 15 用于测试的上海某区域的ALOS图像及其分类结果和对比光学影像
Figure 15. Results of Shanghai area used for testing

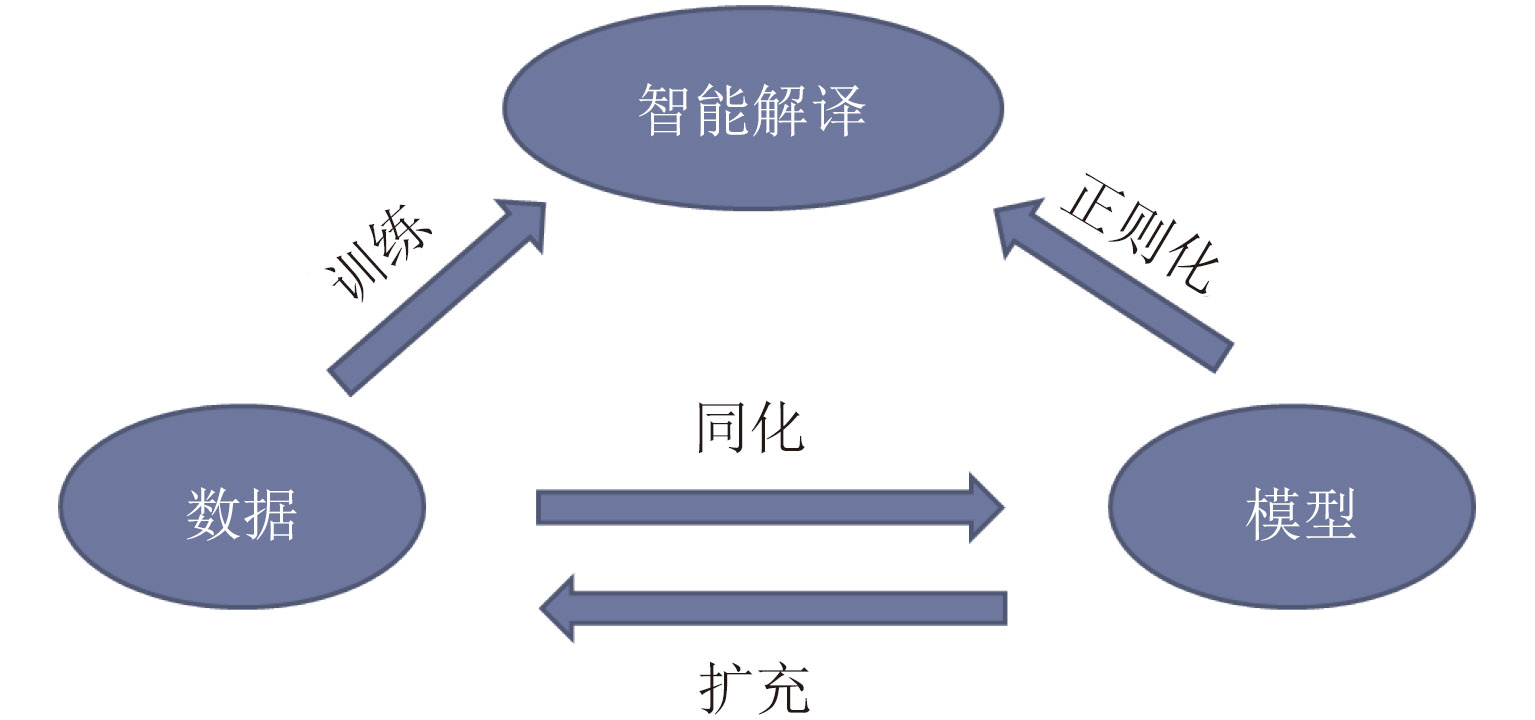
图 16 数据驱动-模型约束下的SAR智能解译
Figure 16. Data driven-model regularized intelligent SAR imagery interpretation
表 1 SAR图像解译与计算机视觉的差异
Table 1. Comparison of SAR imagery interpretation and computer vision
特性 SAR图像解译 计算机视觉 波段 微波 可见光 成像原理 相位相干叠加 能量聚焦叠加 投影方向 距离向-方位角 俯仰角-方位角 典型视角 空天对地观测 第一人称视角 数据构成 幅度相位、多通道、多模式 RGB、视频  下载: 导出CSV
表 2 SOC实验条件下的混淆矩阵
Table 2. Confusion matrix under SOC setting
Class BMP-2 BTR-70 T-72 BTR-60 2S1 BRDM-2 D7 T-62 ZIL-131 ZSU-234 Pcc (%) BMP-2 194 0 1 0 1 0 0 0 0 0 98.98 BTR-70 0 195 0 0 0 1 0 0 0 0 99.49 T-72 0 0 196 0 0 0 0 0 0 0 100 BTR-60 1 0 0 188 0 0 0 1 1 4 96.41 2S1 0 0 0 0 269 4 0 0 0 1 98.18 BRDM-2 0 0 0 0 0 272 0 0 0 2 99.27 D7 0 0 0 0 0 0 272 1 1 0 99.27 T-62 0 0 0 0 0 0 0 272 1 0 99.64 ZIL-131 0 0 0 0 0 0 0 0 273 1 99.64 ZSU-234 0 0 0 0 0 0 1 0 0 273 99.64 Total 99.13
下载: 导出CSV
表 3 Flevoland数据分类结果
Table 3. Flevoland result
Class 训练样本数 测试样本数 实数网络准确率 复数网络正确率 Stem beans 1245 282 100 100 Peas 1225 308 99.26 98.38 Forest 1184 295 99.36 99.66 Lucerne 1225 293 93.16 99.66 Wheat 1163 291 97.60 95.88 Beet 1213 287 97.18 99.30 Potatoes 1220 286 89.42 97.20 Bare soil 1236 310 99.36 88.06 Grasses 1202 329 71.43 91.79 Rapeseed 1216 290 87.58 91.72 Barley 1207 311 98.49 99.36 Wheat2 1176 304 83.23 92.43 Wheat3 1224 325 77.61 94.77 Water 1138 284 59.27 96.13 Buildings 126 24 100 100 Total 17000 4219 89.49 95.97
下载: 导出CSV
-
[1] 张红, 王超, 张波, 等. 高分辨率SAR图像目标识别[M]. 北京: 科学出版社, 2009: 4–7.Zhang Hong, Wang Chao, Zhang Bo, et al. High-Resolution SAR Image Target Recognition[M]. Beijing: Science Press, 2009: 4–7. [2] Moreira A, Prats-Iraola P, Younis M, et al. A tutorial on synthetic aperture radar[J].IEEE GeoscienceandRemote Sensing Magazine, 2013, 1(1): 6–43. [3] 程肖. 基于散射中心模型的SAR图像自动目标识别[D]. [硕士论文], 国防科学技术大学, 2009.Cheng Xiao. SAR ATR algorithm based on the scattering center model[D]. [Master dissertation], National University of Defense Technology, 2009. [4] Krizhevsky A, Sutskever I, and Hinton G E. ImageNet classification with deep convolutional neural networks[J].Advances in Neural Information Processing Systems, 2012, 25(2): 1097–1105. http://web.cs.ucdavis.edu/~yjlee/teaching/ecs289g-fall2016/yuanzhe.pdf [5] He K, Zhang X, Ren S, et al. Delving deep into rectifiers: Surpassing human-level performance on ImageNet classification[C]. IEEE International Conference on Computer Vision, Santiago, Chile, 2015: 1026–1034. [6] Szegedy C, Liu W, Jia Y, et al. Going deeper with convolutions[C]. IEEE Conference on Computer Vision and Pattern Recognition, Boston, M. A., USA, 2015: 1–9. [7] Large Scale Visual Recognition Challenge 2016 (ILSVRC2016). http://image-net.org/challenges/ LSVRC/2016/results. [8] Glorot X, Bordes A, and Bengio Y. Deep sparse rectifier networks[C]. International Conference on Artificial Intelligence and Statistics, Fort Lauderdale, United States, 2011: 315–323. [9] Chen S, Wang H, Xu F, et al. Target classification using the deep convolutional networks for SAR images[J].IEEE Transactions on GeoscienceandRemote Sensing, 2016, 54(8): 4806–4817. http://adsabs.harvard.edu/abs/2016ITGRS.54.4806C [10] Zhang Z, Wang H, Xu F, et al. Complex-valued convolutional neural network and its application in polarimetric SAR image classification[J].IEEE Transactions on Geoscience &Remote Sensing, in press. [11] Hänsch R and Hellwich O. Complex-valued convolutional neural networks for object detection in PolSAR data[C]. European Conference on Synthetic Aperture Radar, Aachen, Germany, 2010: 1–4. [12] Lecun Y, Bengio Y, and Hinton G. Deep learning[J].Nature, 2015, 521(7553): 436–444. doi: 10.1038/nature14539 [13] Zeiler M D and Fergus R. Visualization and understanding convolutional networks[C]. European Conference on Computer Vision, Zurich, Switzerland, 2014: 818–833. [14] Srivastava N, Hinton G, Krizhevsky A, et al. Dropout: A simple way to prevent neural networks from overfitting[J].Journal of Machine Learning Research, 2014, 15(1): 1929–1958. https://www.researchgate.net/publication/286794765_Dropout_A_Simple_Way_to_Prevent_Neural_Networks_from_Overfitting [15] Keydel E R. MSTAR extended operating conditions: A tutorial[C]. Algorithms for Synthetic Aperture Radar Imagery Ⅲ, Orlando, F. L., USA, 1996: 228–242. [16] Kong J A, Swartz A A, Yueh H A, et al. Identification of terrain cover using the optimumterrain classifier[J].Journal of Electromagnetic Waves &Applications, 2012, 2(2): 171–194. [17] Lee J S and Grunes M R. Classification of multi-look polarimetric SAR data based on the complex Wishart distribution[J].International Journal of Remote Sensing, 1994, 15(11): 2299–2311. doi: 10.1080/01431169408954244 [18] Freeman A, Villasenor J, Klein J D, et al. On the use of multi-frequency and polarimetric radar backscatter features for classification of agricultural crops[J].International Journal of Remote Sensing, 1994, 15(9): 1799–1812. doi: 10.1080/01431169408954210 [19] Kouskoulas Y, Ulaby F T, and Pierce L E. The Bayesian Hierarchical Classifier (BHC) and its application to short vegetation using multi-frequency polarimetric SAR[J].IEEE Transactions on GeoscienceandRemote Sensing, 2004, 42(2): 469–477. [20] Lee J S, Grunes M R, Ainsworth T L, et al. Unsupervised classification using polarimetric decomposition and the complex Wishart classifier[J].IEEE Transactions on GeoscienceandRemote Sensing, 1999, 37(5): 2249–2258. [21] Cloude S R and Pottier E. An entropy based classification scheme for land applications of polarimetric SAR[J].IEEE Transactions on GeoscienceandRemote Sensing, 1997, 35(1): 68–78. http://www.academia.edu/10870525/An_entropy_based_classification_scheme_for_land_applications_of_polarimetric_SAR [22] Zhou Y, Wang H, Xu F, et al. Polarimetric SAR image classification using deep convolutional neural networks[J].IEEE Geoscience and Remote Sensing Letters, 2016, 13(12): 1935–1939. doi: 10.1109/LGRS.2016.2618840 [23] Spaceborne and Airborne POLSAR Images[OL]. Available: http://envisat.esa.int/POLSARpro/datasets.html29. [24] Yu P, Qin A K, and Clausi D A. Unsupervised polarimetric SAR image segmentation using region growing with edge penalty[J].IEEE Transactions on GeoscienceandRemote Sensing, 2012, 50(4): 1302–1317. -


计量
- 文章访问数:
- HTML全文浏览量:
- PDF下载量:
- 被引次数: 0

