- Home
-
Articles & Issues

-
Data

- Dataset of Radar Detecting Sea
- SAR Dataset
- SARGroundObjectsTypes
- SARMV3D
- 3DRIED
- UWB-HA4D
- LLS-LFMCWR
- FAIR-CSAR
- FUSAR
- MSAR
- SDD-SAR
- DatasetinthePaper
- SpaceborneSAR3Dimaging
- DatasetintheCompetition
- Sea-land Segmentation
- SAR-Airport
- Hilly and mountainous farmland time-series SAR and ground quadrat dataset
-
Report

-
Course

-
About

-
Publish

- Editorial Board
- Chinese
| Citation: | SUN Xiaokun, YUN Zekai, HU Canbin, et al. End-to-end registration algorithm for high-resolution multi-view SAR images[J]. Journal of Radars, 2025, 14(2): 389–404. doi: 10.12000/JR24211 |
End-to-end Registration Algorithm for High-resolution Multi-view SAR Images
DOI: 10.12000/JR24211 CSTR: 32380.14.JR24211
More Information-
Abstract
Due to the side-looking and coherent imaging mechanisms, feature differences between high-resolution Synthetic Aperture Radar (SAR) images increase when the imaging viewpoint changes considerably, making image registration highly challenging. Traditional registration techniques for high-resolution multi-view SAR images mainly face issues, such as insufficient keypoint localization accuracy and low matching precision. This work designs an end-to-end high-resolution multi-view SAR image registration network to address the above challenges. The main contributions of this study include the following: A high-resolution SAR image feature extraction method based on a local pixel offset model is proposed. This method introduces a diversity peak loss to guide response weight allocation in the keypoint extraction network and optimizes keypoint coordinates by detecting pixel offsets. A descriptor extraction method is developed based on adaptive adjustment of convolution kernel sampling positions that utilizes sparse cross-entropy loss to supervise descriptor matching in the network. Experimental results show that compared with other registration methods, the proposed algorithm achieves substantial improvements in the high-resolution adjustment of convolution kernel sampling positions, which utilize sparse cross-entropy loss to supervise descriptor matching in the network. Experimental results illustrate that compared with other registration methods, the proposed algorithm achieves remarkable improvements in high-resolution multi-view SAR image registration, with an average error reduction of over 65%, 3~5-fold increases in the number of correctly matched point pairs, and an average reduction of over 50% in runtime. -
1. 引言
在现代战争中,敌方为了获取电磁频谱优势与战场主动权,通常会发射各种有源干扰破坏雷达作战性能,从而掩护目标完成预定的作战任务[1]。雷达为了应对各种干扰,相应的抗干扰技术在对抗中不断升级[2]。一般来说,抗干扰技术按照雷达处理阶段的不同可以分为主动抗干扰和被动抗干扰[3]。在雷达发射信号阶段,主动抗干扰技术可以通过雷达波形设计降低敌方干扰机对雷达信号的截获概率或识别概率,从而降低干扰机的干扰效能[4−6]。如果雷达已经接收到了干扰信号,被动抗干扰技术可以通过空、时、频等多个处理域完成目标与干扰的分离,达到对干扰抑制的目的[7−9]。
随着雷达抗干扰研究的不断深入,被动抗干扰手段日益丰富。然而,挂载在掩护目标上的自卫式干扰机通过发射大功率瞄准干扰,使干扰与目标回波在多处理域重叠,难以分离。频率捷变雷达通过使用自主调节发射信号载频的主动抗干扰手段,使得干扰机难以截获和干扰,为对抗自卫式压制干扰提供了可能[10]。其抗干扰性能主要取决于跳频策略,传统随机跳频策略已经被证明不是最佳选择[11]。如何精准预测干扰机下一时刻将要发射的干扰频点,从而指导雷达信号的频点选择,是频率捷变雷达在与干扰机博弈中取胜的主要难点。
相比针对静态优化问题设计的启发式搜索算法,强化学习可以让智能体与环境不断交互,获得反馈,从而指导智能体在动态环境下进行决策[12]。基于深度学习模型强大的数据表征能力而衍生出的深度强化学习,能够处理高维数据并完成非线性映射,弥补了传统强化学习算法的不足[13],在认知电子战方面已经得到了一定的研究。如果将干扰信息看作环境状态,抗干扰措施看作雷达动作,抗干扰效能看作即时回报,那么认知抗干扰决策问题可以通过强化学习技术解决。文献[14]针对干扰类型和参数固定的复合干扰场景,分别使用Q学习和SARSA (State-Action-Reward-State-Action)探索了抗干扰措施组合选取问题。文献[15]使用改进的DDPG (Deep Deterministic Policy Gradient)算法对12种抗干扰措施进行选择,以实施抗干扰措施前后干扰威胁度变化作为反馈。文献[16]使用DDPG-MADDPG (Deep Deterministic Policy Gradient and the Multi-Agent Deep Deterministic Policy Gradient)对包含复合干扰在内的12种干扰类型,以抗干扰改善因子作为反馈,进行多处理域抗干扰措施自适应选取。
在频点决策方面,强化学习主要围绕瞄频或扫频干扰的频率捷变波形设计展开研究[17]。文献[18]首次对雷达脉冲级跳频策略展开研究,分别对比了随机频点选择、Q学习、深度Q网络(Deep Q-Network, DQN)等3种策略,证明了DQN在决策方面具备更好的性能。并在文献[19]中继续深化研究内容,将检测概率作为奖励值,而不是之前论文中的信干噪比,同时优化了DQN模型。文献[20]在文献[18]和文献[19]工作的基础上,考虑了一种具备侦收功能的干扰机,以及子脉冲频率捷变雷达,并基于近端策略优化(Proximal Policy Optimization, PPO)算法完成智能决策。文献[21]考虑了网络化无人机雷达工作系统,使用雷达信息表示理论作为奖励函数,基于双贪婪的改进Q学习算法优化系统抗干扰性能。文献[22]假定干扰机也具备马尔科夫性质,在预测得到干扰策略的基础上选择雷达频点与之对抗。文献[23]考虑了跳频速率会影响相干积分性能和多普勒分辨率,使用Q学习自适应调整雷达发射波形的脉宽和频点以对抗扫频干扰。
总体来说,上述研究均基于雷达不同的性能指标设计奖励函数,以此优化频点等雷达参数。虽然在对抗成功率方面超过随机频点决策方法,然而缺少对抗干扰策略收敛速度的讨论。应当指出,在现代电子战中,干扰机可能具备多种策略,并根据某种规则在不同策略间切换。因此雷达在进行抗干扰策略学习时,应当尽快收敛到最优策略,从而保持对抗先机。如果雷达还未收敛到最优策略时,干扰机改变策略,那么雷达将陷入被动地位。因此,网络收敛时间或是所需样本量是评价一个智能化算法能够应用于实际作战场景的重要衡量指标。
受上述研究启发,考虑到现代干扰机具备侦收-瞄准-干扰的基本策略,本文针对频率捷变雷达,设计了一种基于强化学习的雷达子脉冲跳频抗干扰策略。将当前时刻感知到的干扰频点以及上一时刻的雷达频点作为状态,将当前时刻的雷达频点选择策略作为动作,以目标检测结果和信干噪比作为即时奖励函数设计强化学习关键要素,基于DQN完成子脉冲频点选取策略的学习。仿真针对两种不同侦收策略的干扰机,证明了所提方法的有效性以及较高的收敛效率。
与文献[20]不同的是,本文的主要贡献在于如何通过对强化学习关键要素的设计,从而达到快速收敛到最优解的目的,而不是在于网络设计与修改。具体包括4点:(1)虽然干扰机具备侦干周期,但是我们通过状态空间的合理设计,仅使用单个时间步即可学习到干扰周期性策略,同时不需要使用长短期记忆网络(Long Short-Term Memory, LSTM)等时间记忆网络即可完成最优策略学习,显著降低了收敛时间。(2)在动作设计方面,我们设计了一种子脉冲频点可重复选取的特殊波形,增大了动作空间选取范围。(3)在动作选取方面,我们通过
ε -贪婪原则,实现了搜索和利用的有效平衡。在训练初期,以随机搜索为主,减小了收敛到局部最优解的概率。随着训练过程的进行,随机搜索概率逐渐降低,选择网络输出动作的概率逐渐增加,便于收敛。(4)在奖励设计方面,围绕目标检测性能,在单次目标检测结果的基础上,引入了更具差异性的信干噪比指标,缓解了因为采样不充分可能收敛到局部最优解的情况。2. 背景
2.1 子脉冲频率捷变波形设计
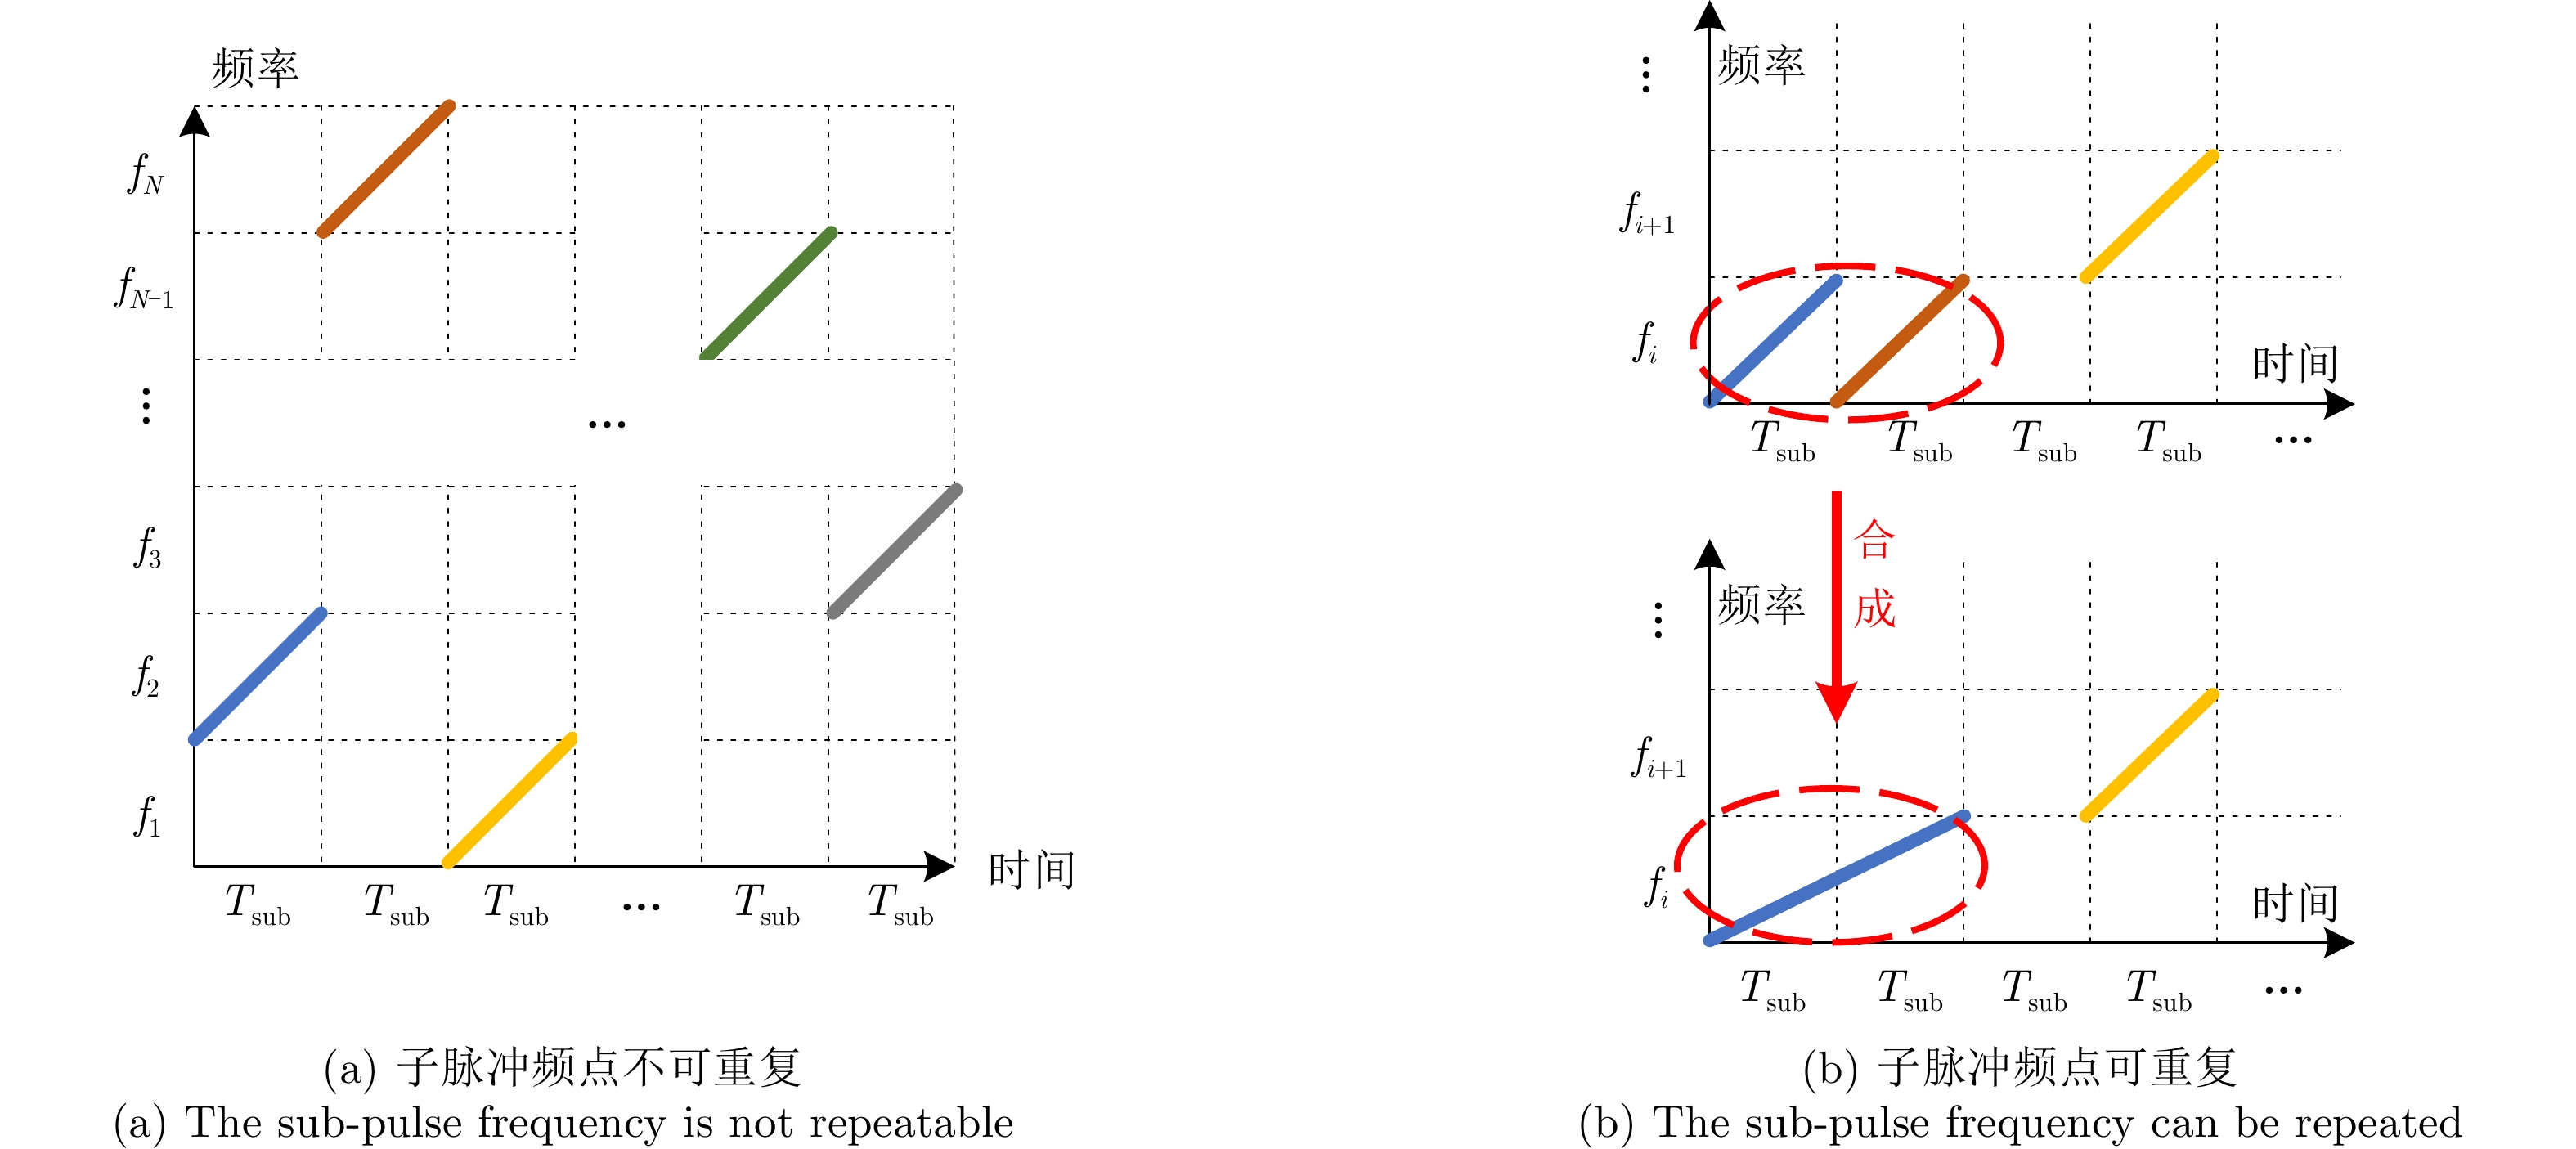
由于现代干扰机可以对接收到的雷达信号进行快速测频与频率引导,对传统雷达具备较大威胁。而频率捷变雷达可以实现子脉冲级的频率调制,为与其对抗提供了可能。作为常用的雷达传输信号波形,基于线性调频(Linear Frequency Modulation, LFM)信号的子脉冲频率捷变波形如图1(a)所示,其时域表达式如下:
st(t)=N∑n=1rect[(t−τn)/(t−τn)TsubTsub]exp[j2πfn(t−τn)]⋅exp[jπKn(t−τn)2] (1) 其中,
rect(⋅) 表示矩形窗函数,N表示子脉冲个数,Tsub 表示子脉冲脉宽;τn 表示第n个子脉冲的延时,fn 表示子脉冲频点,Kn 表示第n个子脉冲的调频斜率。频率捷变雷达各可选频点应当去相关从而达到频率抗干扰的目的,即保证si(ω)sj(ω)=0 ,其中,si(ω) 表示子脉冲 i 的频谱,sj(ω) 表示子脉冲 j的频谱。式(1)所定义的传统频率捷变雷达在进行子脉冲频点选取时,通常会选择不同的雷达频点。为扩充频点选取自由度,增大波形复杂度,本文设计了一种子脉冲频点可重复选取的雷达发射波形,如图1(b)所示。当相邻子脉冲选取重复频点时,则将其合成一个宽脉冲,其脉宽为
Tcom=NrepTsub ,其中Nrep 表示选取相同频点的相邻子脉冲数量。同时保证合成后的宽脉冲带宽不变,即Bcom=Bsub 。合成后的脉冲数用Ncom 表示。2.2 强化学习与Q学习算法原理
强化学习可以由马尔科夫决策过程(Markov Decision Process, MDP)描述,满足马尔科夫性质。强化学习的优化目标为最大化累计回报,定义为
Gt=rt+γrt+1+γ2rt+2+⋯=∞∑k=0γkrt+k (2) 其中,
rt 表示智能体在状态st 下执行动作at 并转移到st+1 后得到的回报;γ 为折扣因子,是st+1 及其之后的奖励权重,取值范围为0~1,表示对未来奖励的重视程度。由于MDP是一种随机过程,其随机独立性导致累计回报
Gt 是一个随机变量,无法定量描述,如图2所示。因此可对累计回报取期望,获得状态值函数Vπ(s) 和动作状态值函数Qπ(s,a) ,将优化问题变成找到一种最优策略π ,使任意一个状态的Vπ(s) 或Qπ(s,a) 为最大。而Q学习的优化目标是针对Qπ(s,a) ,其贝尔曼方程及最优动作状态值函数Q∗(s,a) 定义如下:Qπ(s,a)=∑s′∈Sp(s′|s,a)[r(s,a,s′)+γ∑a′∈Aπ(a′|s′)Qπ(s′,a′)] (3) Q∗(s,a)=∑s′∈Sp(s′|s,a)[r(s,a,s′)+γmaxa′Q∗(s′,a′)] (4) 其中,
rt=r(s,a)=∑ap(s′|s,a)r(s,a,s′) 。p(s′|s,a) 为某状态s执行动作a后,转移到下一状态s′ 的概率。由于在实际场景中,我们可能不知道环境先验信息
p(s′|s,a) ,因此无法获得值函数的解析表示。而Q学习可以通过多次取平均的方式,近似估计得到Q。具体来说,从任意状态开始与环境1个时间步长,利用t时刻的即时回报rt 和下一时刻最大的状态动作值函数Q(st+1,a′t+1) 对当前时刻动作状态值函数Q(st,at) 进行估计,最后重复上述动作多次取平均。值函数的更新公式为Q(st,at)=Q(st,at)+α[rt+γmaxa′Q(st+1,a′t+1)−Q(st,at)] (5) 其中,
α 为学习率,表示更新的步长。Q学习通过不断与环境进行交互来获取并更新Q值,并将Q值存入到由状态和动作组成的Q表中。待智能体学习完成后,根据当前状态的Q值来选取能够获取最大收益的动作。
3. 基于深度Q网络的自适应频点决策
3.1 基于深度Q网络的子脉冲频点决策模型
雷达子脉冲级频点决策往往对应于指数级增长的动作空间,而传统Q学习基于Q表存储和查找Q值,维护难度巨大。而DQN利用神经网络拟合值函数,替换了传统Q表的存储方式,有效解决了高维状态和动作空间的寻优问题。
DQN与Q学习的主要区别在于网络部分,其采用目标值网络和估计值网络组成的双网络。估计值Q网络输出
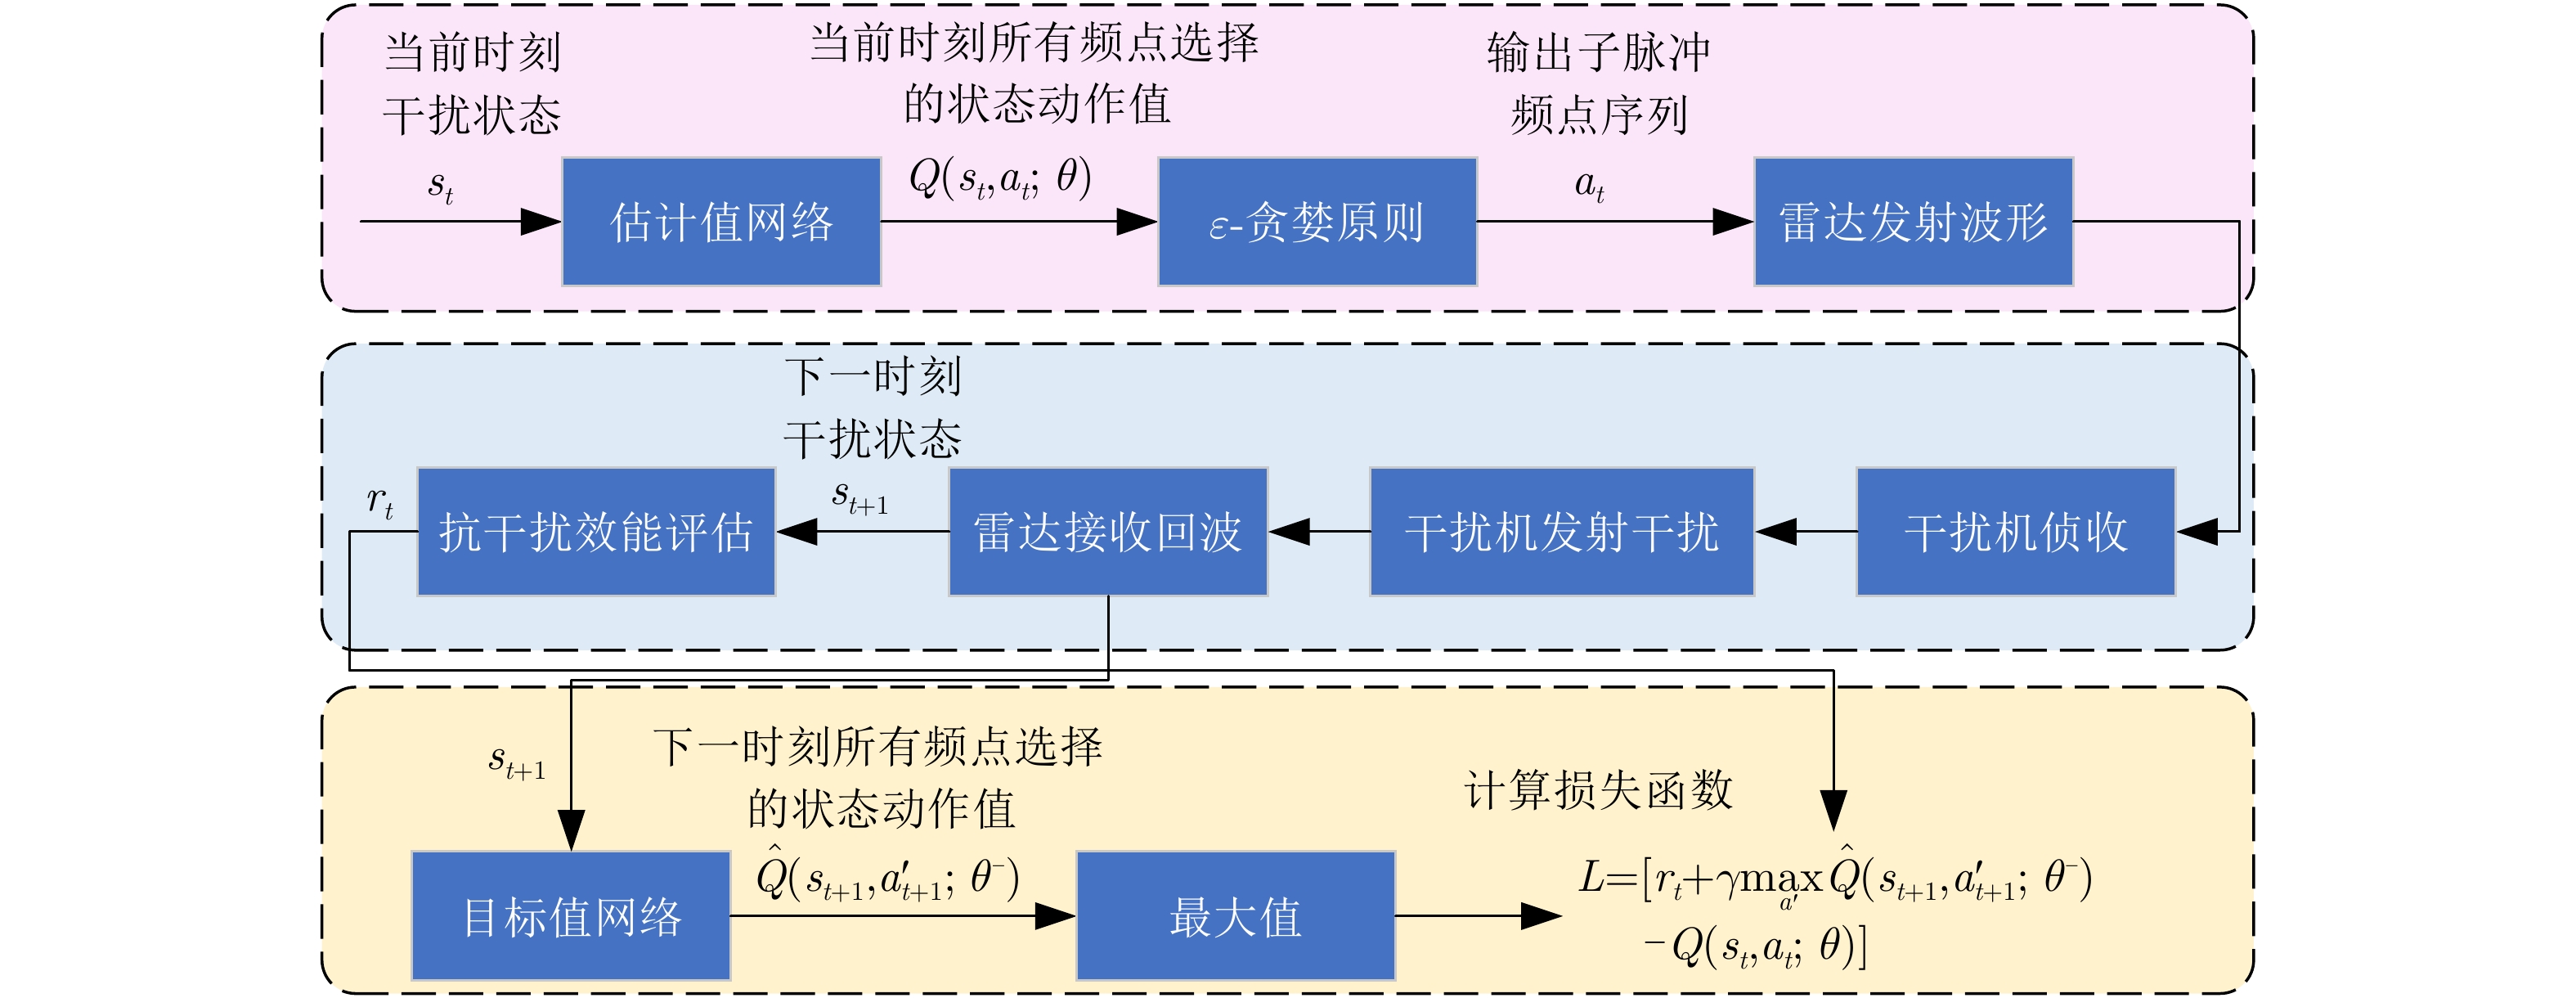
Q(st,at;θ) ,用来评估当前状态动作对的未来累计回报期望。目标值ˆQ 网络输出ˆQ(st+1,a′t+1;θ−) ,并根据贝尔曼最优方程,使用y=rt+γmaxˆQ(st+1,a′t+1;θ−) 表示Q 函数的优化目标。其网络训练过程如图3所示。输入当前状态
st ,通过估计值网络预测得到当前状态st 对应的不同动作at 的Q值,然后通过ε -贪婪原则选择at 并转至下一状态st+1 ,同时获得rt 。通过目标值网络计算下一状态st+1 的最大ˆQ 值,将其与估计值作差更新估计值网络参数θ ,表示为L=[rt+γmaxa′ˆQ(st+1,a′t+1;θ−)−Q(st,at;θ)] (6) 其中,
ε -贪婪原则以概率1−ε 选择估计值网络输出的具有最大Q值的频点,以概率ε 随机选择频点,并随着训练步数的增加减小ε ,从而达到搜索和利用的充分结合。上述流程经过一定次数后,基于软更新来更新目标值网络参数
θ− :θ−=τθ+(1−τ)θ− (7) 其中,
0<τ≪1 表示软间隔更新系数。由于在一段时间内目标值具有一定稳定性,这能在一定程度上降低估计值Q 网络和目标值ˆQ 网络之间的耦合性,提升了网络的收敛性和稳定性。训练完成后,测试时直接输入当前时刻状态至训练好的模型中,即可获取最优动作。
3.2 强化学习关键要素设计
上述提及的状态、动作和奖励是强化学习的关键要素,其中状态和奖励是算法的输入,动作是算法的输出。设置如下:
(1) 状态空间:假设雷达能够通过干扰感知等手段获取干扰频点信息,则状态空间由雷达子脉冲频点和干扰频点组成。
S=[fR,t−1,fJ,t]=[fsub1,t−1,fsub2,t−1,⋯,fsubN,t−1,fJ,t] (8) 其中,
fR,t−1=[fsub1,t−1,fsub2,t−1,⋯,fsubN,t−1] 和fJ,t 分别表示t−1 时刻雷达N个子脉冲的频点选择以及t时刻干扰瞄准频点。fJ,t 取值范围为1~(N+1) ,1~N 表示干扰机发射窄带瞄频干扰的瞄准频点,(N+1) 表示干扰机发射宽带阻塞干扰。fsubn,t(1≤n≤N) 的取值范围为1~N ,表示第n个子脉冲的频点。(2) 动作空间:t时刻雷达N个子脉冲频点选择:
A=fR,t=[fsub1,t,fsub2,t,⋯,fsubN,t] (9) (3) 奖励函数:奖励函数应当围绕雷达作战任务设置,本文以预警雷达为例,采用目标检测结果
Fd 和信干噪比(Signal-to-Jamming-plus-Noise Ratio, SJNR)作为评价指标。前者直接反映了目标检测能力,而后者的存在加快了最优解的收敛速度,降低收敛到局部最优解的可能,从而最大化目标检测性能。定义如下:R=Ncom∑n=1(Nrep,nFd,n−SJNRn/SJNRnNcomNcom) (10) SJNRn={(PT,n−ˉPJN,n)/η,Fd,n=10,Fd,n=−1 (11) 其中,对于目标检测结果
Fd ,我们可以根据提前获取的战场态势信息预估目标距离波门,在子脉冲脉压后基于单元平均恒虚警率(Cell Average-Constant False Alarm Rate, CA-CFAR)检测判断目标能否被检测到[24]。如果第n个子脉冲检测到目标则Fd,n=1 ,反之则Fd,n=−1 。同时可以获取目标平均功率PT,n 和干扰噪声平均功率ˉPJN,n 。η 为归一化系数,用来将信干噪比限制在0~1之间,从而提高训练稳定性。结合状态、动作和奖励的定义,基于深度Q网络的雷达子脉冲频点决策流程如算法1所示。
1 基于深度Q网络的雷达子脉冲频点决策1. Radar sub-pulse frequency decision based on Deep Q-Network (DQN)Step 1:初始化: Step 1-1:使用随机参数θ初始化估计值Q网络 Step 1-2:使用参数θ−=θ初始化目标值ˆQ网络 Step 1-3:初始化经验池D Step 1-4:初始化干扰策略,雷达子脉冲数量及频点,折扣因
子γ,学习率α,贪婪因子ε,软间隔更新系数τ等参数Step 2:每幕: Step 2-1:设置初始状态s1=[fR,0,fJ,1] Step 2-2:每个时间步: Step 2-2-1:使用ε-贪婪原则依据估计值网络的输出结果选择
各子脉冲频点at=fR,t=[fsub1,t,fsub2,t,⋯,fsubN,t],即以
1−ε概率选择估计值网络输出的最佳的频点或者以ε概率随
机选择频点Step 2-2-2:雷达发射子脉冲频率捷变波形,接收到回波后,感
知得到下一时刻状态st+1并根据目标检测结果和脉压后的信
干噪比评估当前时刻奖励rtStep 2-2-3:将(st,at,rt,st+1)存储到经验池D中,如果经验池
中的样本数超出预定数量,则删除早期训练样本数据,以便存
储并使用最新样本数据Step 2-2-4:如果经验池D中保存数量超过起始值,则从D中选
择批大小(batchsize)个样本作为训练集输入到估计值和目标值
网络中,分别计算得到Q(st,at;θ)和y=rt+γmaxˆQ(st+1,
a′t+1;θ−),并反向梯度求导使误差函数L(θ)=[y−Q(st,at;
θ)]2趋近0,更新估计值网络参数θStep 2-2-5:每隔一定的时间步软更新目标值网络参数θ− Step 2-3:结束该时间步 Step 2-4:降低贪婪概率ε Step 3:结束该幕 4. 仿真与分析
4.1 场景设置
4.1.1 仿真参数设置
本文以3个子脉冲和3个可选频点为例,讨论DQN应用于子脉冲频点自适应选取的可行性。为避免子脉冲脉压后出现虚假目标,非相邻子脉冲不能选取重复频点,因此动作总数为
33−6=21 。频率捷变信号、干扰、DQN的仿真参数分别如表1—表3所示。其中,每幕表示1个相参处理间隔(Coherent Processing Interval, CPI),时间步t表示某个CPI中的第t个脉冲重复周期。表 1 频率捷变信号参数设置Table 1. The parameter settings of frequency agile signal参数 数值 子脉冲调制类型 LFM 子脉冲个数 3 子脉冲频点 [10 MHz, 30 MHz, 50 MHz] 子脉冲脉宽 5 μs 子脉冲带宽 5 MHz 信噪比 0 dB 表 2 干扰参数设置Table 2. The parameter settings of jamming干扰类型 参数 数值 窄带瞄频 瞄准频点 [10 MHz, 30 MHz, 50 MHz] 带宽 10 MHz 干噪比 35 dB 宽带阻塞 带宽 120 MHz 干噪比 30 dB 表 3 DQN参数设置Table 3. The parameter settings of DQN参数 数值 批大小 64 学习率 0.001 折扣因子 0.99 缓冲区大小 10000 起始训练样本量 64 贪婪因子衰减系数 0.2 幕 32个时间步 目标值网络更新周期 4个时间步 目标值网络软间隔更新系数 0.01 隐藏层数量 2 隐藏层神经元个数 64 归一化系数 80 很重要的一个技巧是,本文在基于贪婪原则随机选取动作时,只考虑所有子脉冲选择相同频点的情况,即脉内不跳频。该处理旨在尽可能提高相参处理增益以及使干扰机侦收到单频信号并诱导其发射窄带瞄频干扰,从而加快最优策略学习。同样出于加速收敛的目的,输入到神经网络的奖励按照子脉冲个数进行了归一化。
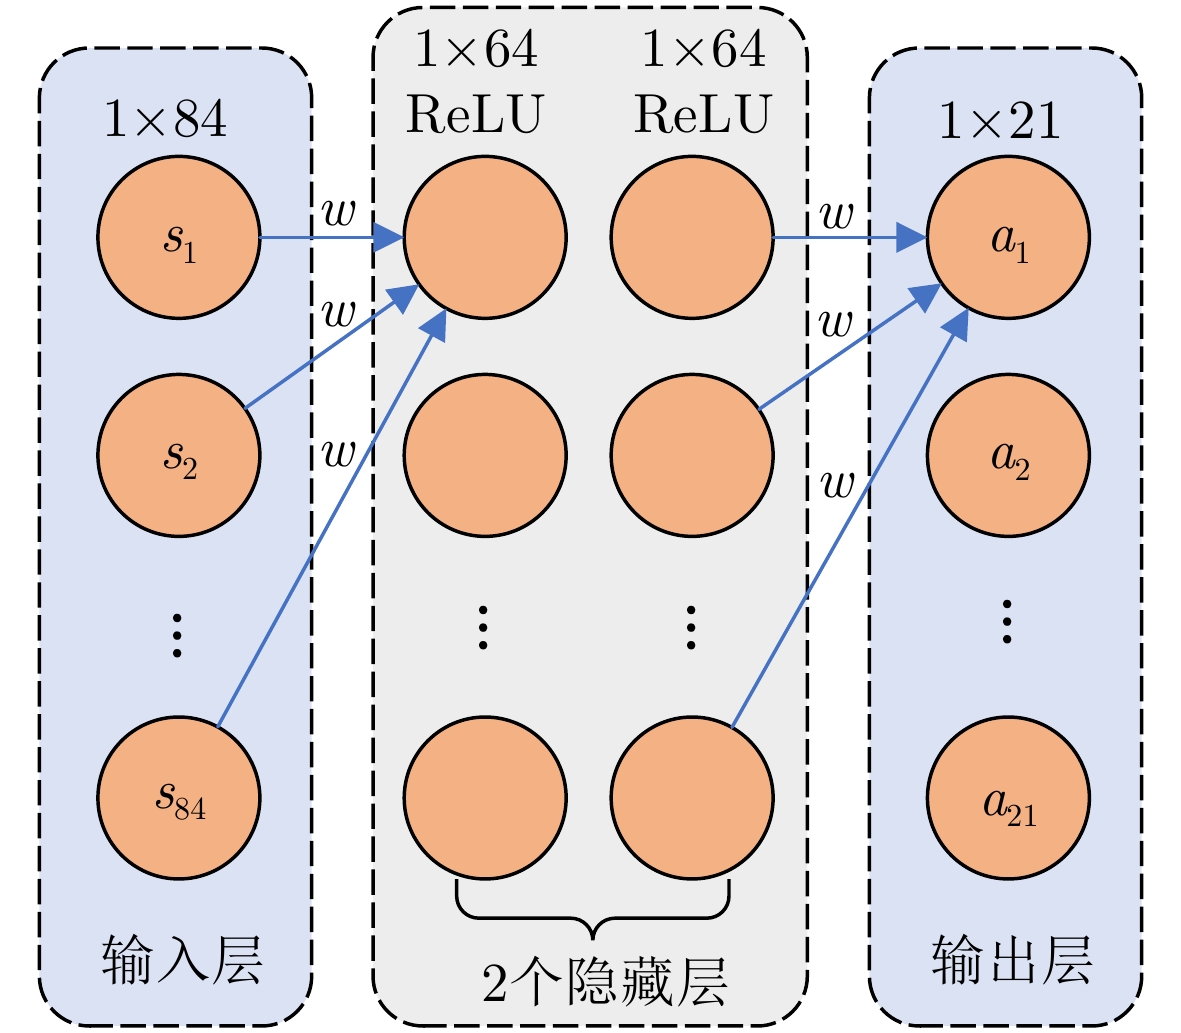
估计值网络和目标值网络的结构相同,均使用4层全连接神经网络,分别为输入层、2个隐藏层和输出层。其中,隐藏层的神经元个数均为64,并使用ReLU作为激活函数,如图4所示。
4.1.2 干扰策略设置
考虑一个具备侦收功能的干扰机,并根据侦-干时间长短分别设置了脉内侦干和脉间侦干等两种固定干扰策略,分别如图5、图6所示。由于切片转发干扰的对抗效果受限于切片宽度、转发次数等参数,灵活的参数变化可能会导致对抗失效,因此本文考虑的干扰类型为压制干扰,包括窄带瞄频和宽带阻塞。其中,窄带瞄频干扰的带宽为雷达子脉冲带宽的2倍,更宽的带宽会使得全部状态的奖励值发生整体偏移,但在归一化后会消除该影响。
对于脉内侦干策略,假设干扰机侦收到雷达脉冲上升沿及下降沿,立即对其测频,转发对应频点的窄带瞄频干扰。值得注意的是,干扰时长设置略小于1个脉冲重复周期(Pulse Repetition Time, PRT),从而使得在当前PRT会同时受到上一时刻以及当前时刻的干扰。因此,雷达在该干扰策略下的一种较为合适的选择为后续子脉冲发射不同于子脉冲1的雷达频点,并且每个PRT均保持相同的发射策略。由于干扰所在频点在滤波后可能会在邻近频点上存在干扰功率残留,因此最优策略为雷达后续子脉冲跳频到距离子脉冲1所选频点的最远频点上。即雷达最优频点选择为
[1,N,N] 或[N,1,1] 。对于脉间侦干策略,假设干扰机从侦收到第1个子脉冲开始持续侦收一段时间,直至没有检测到子脉冲时侦收结束。根据侦收结果发射一段时间长度的干扰,干扰时长在3~4个PRT之间。相比脉内侦干策略,后者不会在某个PRT同时受到两部分干扰。在侦收阶段若只侦收到1个频点,则发射对应频点的窄带瞄频干扰,反之则发射宽带阻塞干扰。雷达需要尽量避免干扰机发射宽带阻塞干扰,为此雷达需要在干扰机侦收阶段时只发射单频信号,而在干扰阶段时选择其余频点。类似地,考虑到滤波引起的干扰功率残留,在干扰机侦收时雷达最优策略为
[1,1,1] 或[N,N,N] ,对应的干扰时雷达最优策略为[N,N,N] 或[1,1,1] 。值得注意的是,脉间侦干策略虽然具备周期性,但当前时刻的干扰动作不完全取决于上一时刻的状态,而是按照固定的时序执行侦收和干扰,因此不具备马尔科夫性。脉间侦干策略寻求的是由4个PRT组成的侦干周期的最大奖励,满足式(5)所示的贝尔曼最优方程的价值迭代原理,因此可以使用强化学习解决。
4.2 脉内侦干策略
此时干扰机侦收到1个子脉冲的上升沿与下降沿后,完成测频并立刻发射干扰,雷达频点对抗的训练结果如图7所示。得分曲线在第4个CPI左右即可收敛,在36分附近波动,如图7(a)所示。图7(b)展示了文献[20]提出的基于PPO与LSTM相结合的频点决策算法,其至少需要30幕的时间才能提升到32分附近震荡,因此策略学习耗时且鲁棒性较差。其本质原因在于PPO为on-policy算法,只能利用神经网络进行动作搜索,导致探索性不足,所以存在收敛速度慢、可能会收敛到局部最优解、得分无法保持等诸多问题。
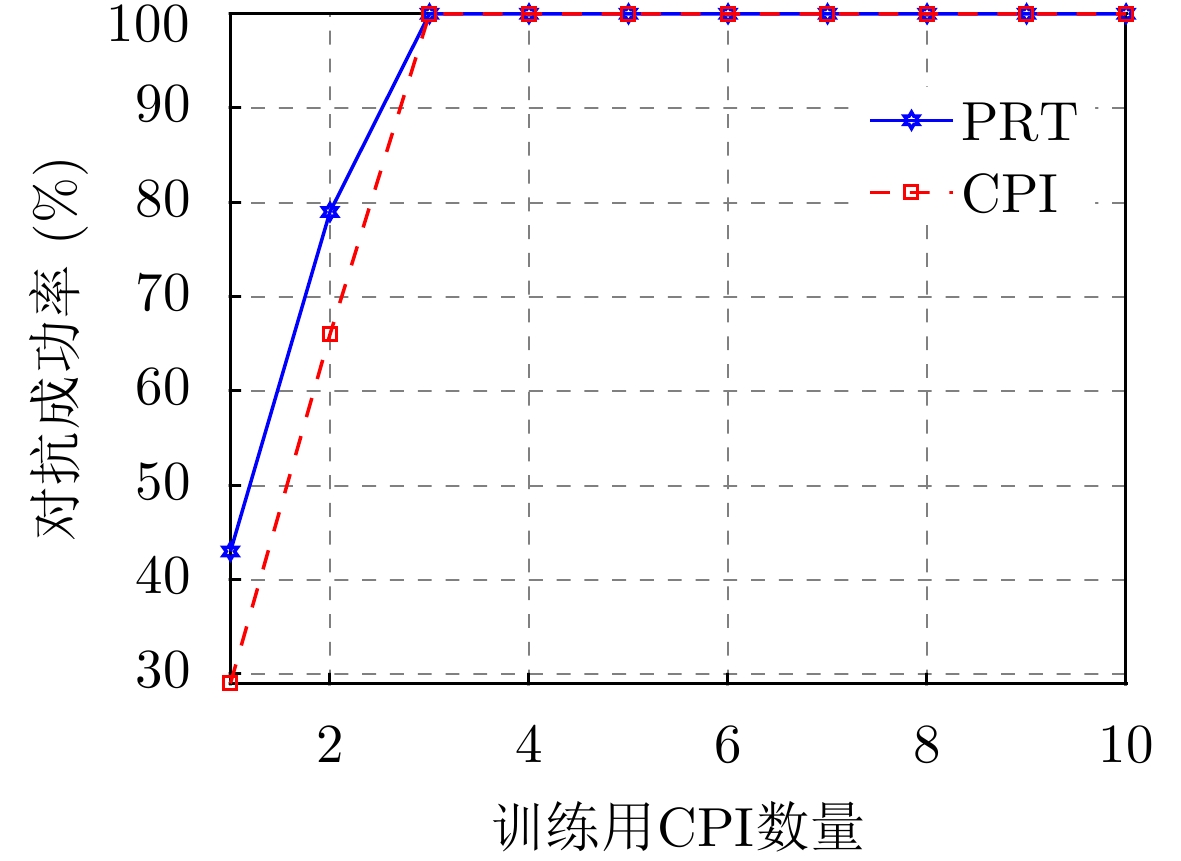
根据图7(a)的收敛情况,保存前10个CPI的训练模型,每个模型对抗100幕,对抗成功率如图8所示。根据4.1.2节对脉内侦干策略的分析,雷达应将未被侦收到的子脉冲频点设置为距离侦收频点的最远频点。因此,PRT对抗成功定义为
{fR=[1,3,3]&fJ=1} 或{fR=[3,1,1]&fJ=3} ,即21个动作中只有2个动作为最优,占比9.5%。CPI对抗成功的判决依据是当前CPI内所有PRT均对抗成功。发现训练所用CPI数量对对抗成功率的影响与收敛情况基本对应,从第3个CPI开始,对抗成功率即可达到100%。
表4展示了随机频点、PPO-LSTM和DQN的单次对抗(PRT)成功率,单幕(CPI)对抗成功率。随机频点决策的成功率与最优动作占比,即理论值大致相同。基于PPO的频点决策虽然在第2个和第3个子脉冲避开了干扰频点,但是由于其搜索力度不够,有一定概率选取到次优策略。而基于DQN的频点决策算法由于使用了
ε -贪婪算法,大大扩展了动作搜索空间,更容易收敛到最优策略。表 4 脉内侦干策略的对抗成功率(%)Table 4. The success rate of confrontation for the intra-pulse interception-jamming strategy (%)策略 PRT对抗成功率 CPI对抗成功率 随机频点 9.7 0 PPO 94 9 DQN 100 100 PPO算法由于可以处理连续动作空间问题,并且可以学习到随机策略,因此是强化学习中受众面最广的基线方法。然而在本文研究的频点决策场景中,不涉及连续动作空间,最优策略也可以由随机策略退化到确定性策略,因此PPO算法优势没有得到充分利用。更为重要的是,由于每幕对抗中次优策略不低于最优策略得分的10%,大大提高了仅依靠神经网络参数进行动作搜索的最优策略收敛难度。
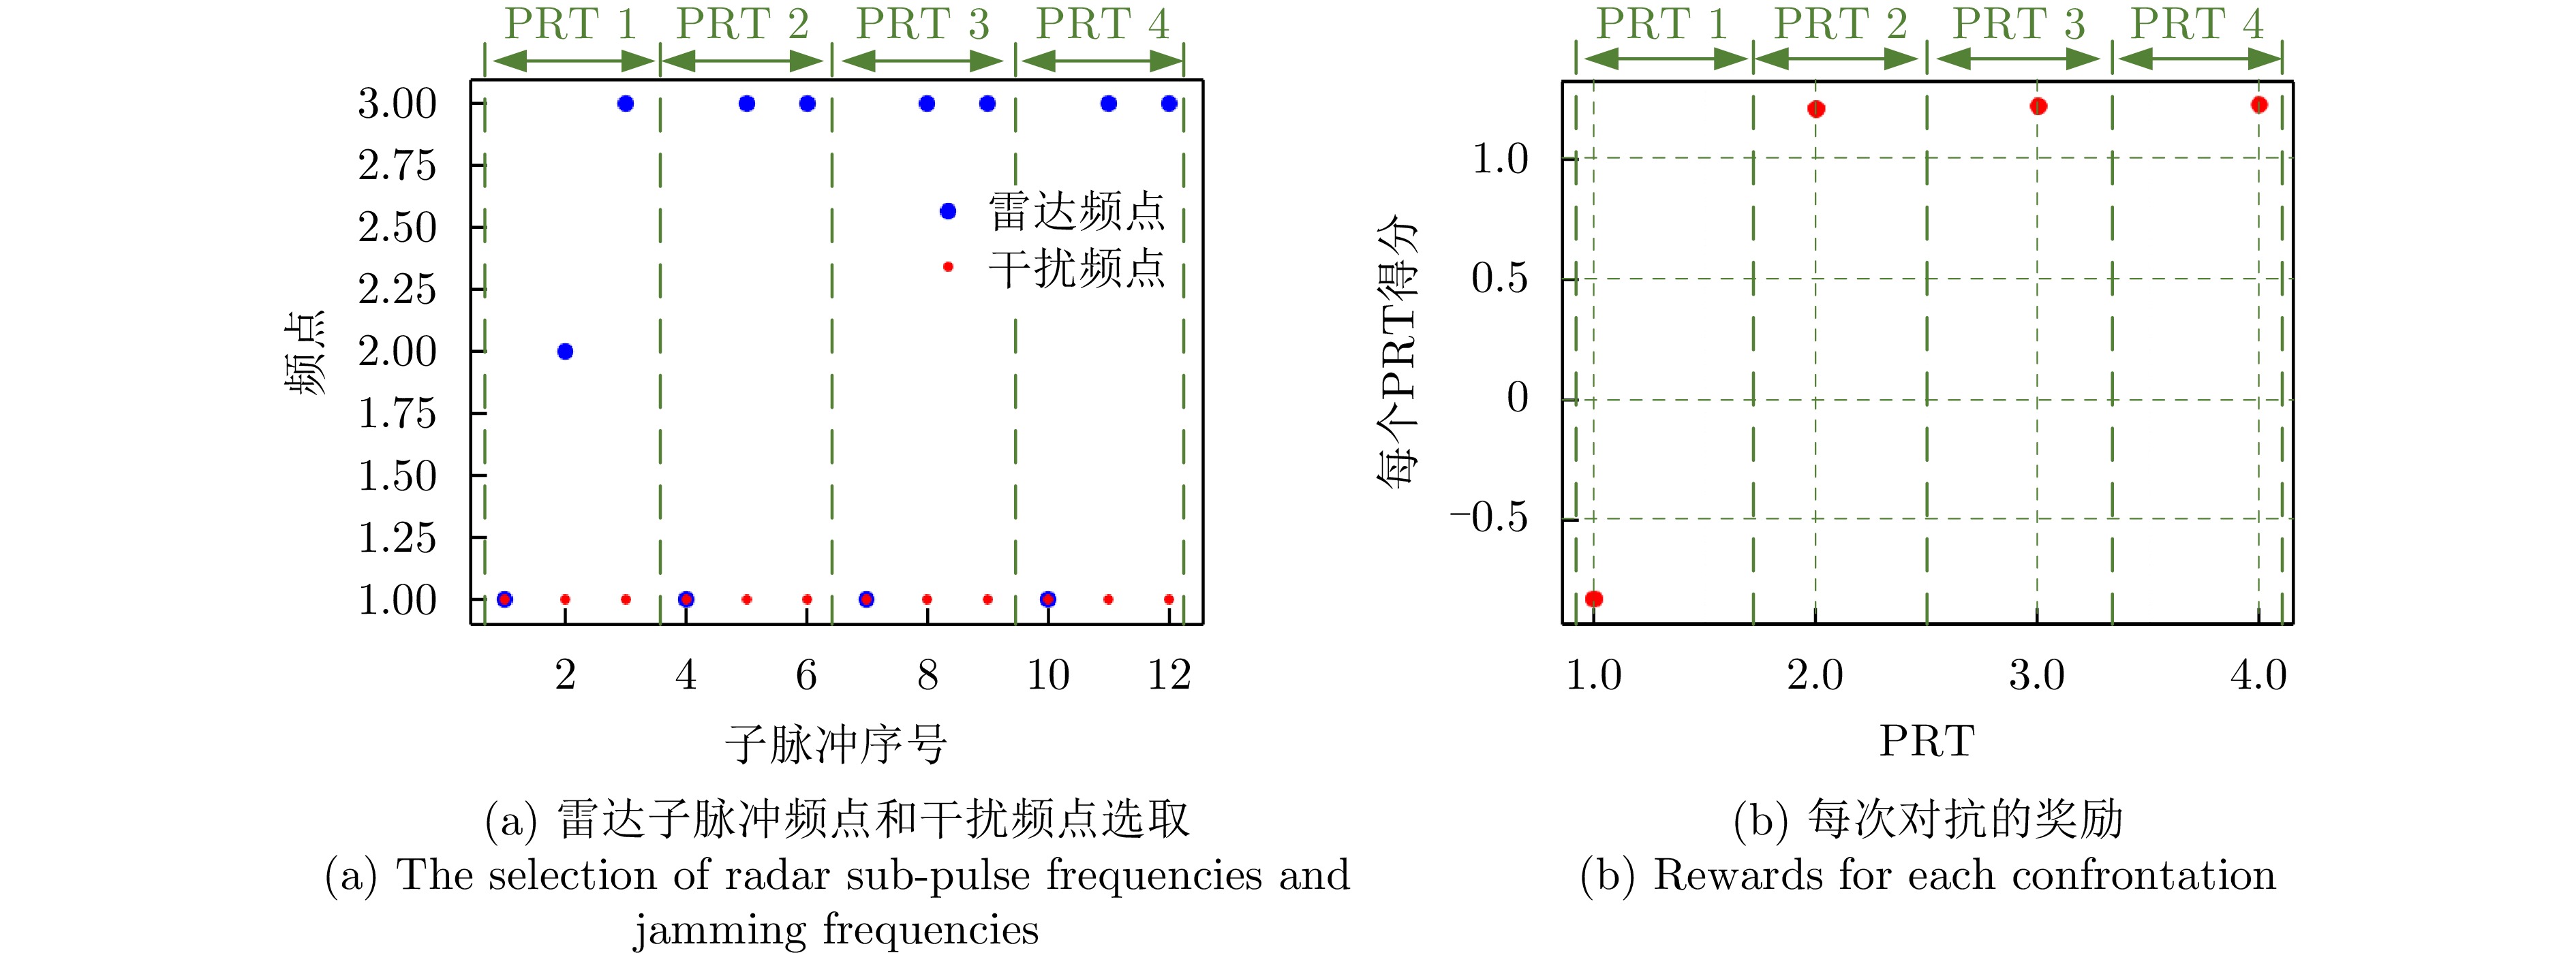
图9(a)展示了雷达和干扰在4个PRT下的频点选取情况。对于第1个PRT,由于初始状态的随机性,雷达选取频点[1,2,3],干扰瞄准频点1。由于单个子脉冲的信噪比增益有限,因此除被干扰的子脉冲外,另有1个子脉冲未能检测到目标,奖励为负值,如图9(b)所示。在第2, 3, 4个PRT,基于训练好的模型,雷达的第2个和第3个子脉冲均选择离干扰频点1最远的频点3,降低了干扰剩余能量的同时,合成了宽脉冲,提高了信噪比增益。
最优动作的时频图及一维距离像如图10所示。当前PRT会同时收到瞄准上一时刻第1个子脉冲以及瞄准当前时刻第1个子脉冲的窄带瞄频干扰,后者会在瞄准后立即发射。因此,第1个子脉冲脉压后,目标尖峰出现在当前时刻产生的大功率噪声干扰边缘,导致漏检。第2个子脉冲由于跳频策略与干扰频域正交,因此脉压后能够检测到目标尖峰,具有较高的信干噪比。
本文围绕目标检测性能,基于单个PRT能否检测到目标以及脉压后的信干噪比两方面评价跳频抗干扰效能。表5展示了蒙特卡洛1000次下,雷达的几个典型频点选取策略的目标检测率、脉压后的信干噪比以及平均得分。为便于分析,假设当前时刻和上一时刻均干扰相同的频点,频点[3,1,1]和[1,3,3]为本文所提模型的策略。可以看出:
表 5 脉内侦干策略下各种雷达策略对抗1000次结果(fJ=fsub1)Table 5. The results of 1000 confrontations with various radar strategies for the intra-pulse interception-jamming strategy (fJ=fsub1)雷达频点选择 目标检测率(%) 信干噪比(dB) 平均得分 [1,1,1] 0 — –3.00 [1,1,2] 0 11.09 –1.12 [1,1,3] 0 12.25 –0.96 [1,2,2] 97.6 15.20 1.09 [1,2,3] 81.7 12.78 0.78 [1,3,3] 99.7 16.06 1.19 [2,1,1] 98.3 15.35 1.12 [2,1,3] 75.6 12.47 0.64 [2,3,3] 97.7 15.19 1.10 [3,1,1] 99.6 16.07 1.18 注:综合考虑噪声随机性引起的得分波动情况,加粗项为最优策略 (1) 由于在当前PRT能同时受到上一时刻和当前时刻的干扰,因此至少有一个雷达频点会被干扰到。根据式(10)所示的奖励函数计算方式,最大得分始终小于2;
(2) 当子脉冲2和子脉冲3跳频成功时,两个子脉冲均选择离干扰频点的最远频点时,平均得分最高,为最优策略,即[1,3,3]和[3,1,1];
(3) 诸如[1,2,3]和[2,1,3]等传统频点选取策略,由于脉压增益有限,导致目标检测率较低;而[1,2,2]和[2,1,1]等选择了干扰频点相邻频点的动作,由于滤波后的干扰能量残余,从而降低了信干噪比,非最优策略;
(4) 次优策略和最优策略的单次对抗得分仅差0.06,网络能够捕获到细微差异,收敛到最优解。
4.3 脉间侦干策略
针对脉间侦干策略,DQN和PPO的训练曲线如图11所示。DQN在第15幕(CPI)左右即可收敛,得分在37分附近。而PPO的训练过程虽然整体呈现上升-平稳,但是其波动始终较为剧烈,且至少需要400幕左右才能趋于平稳。
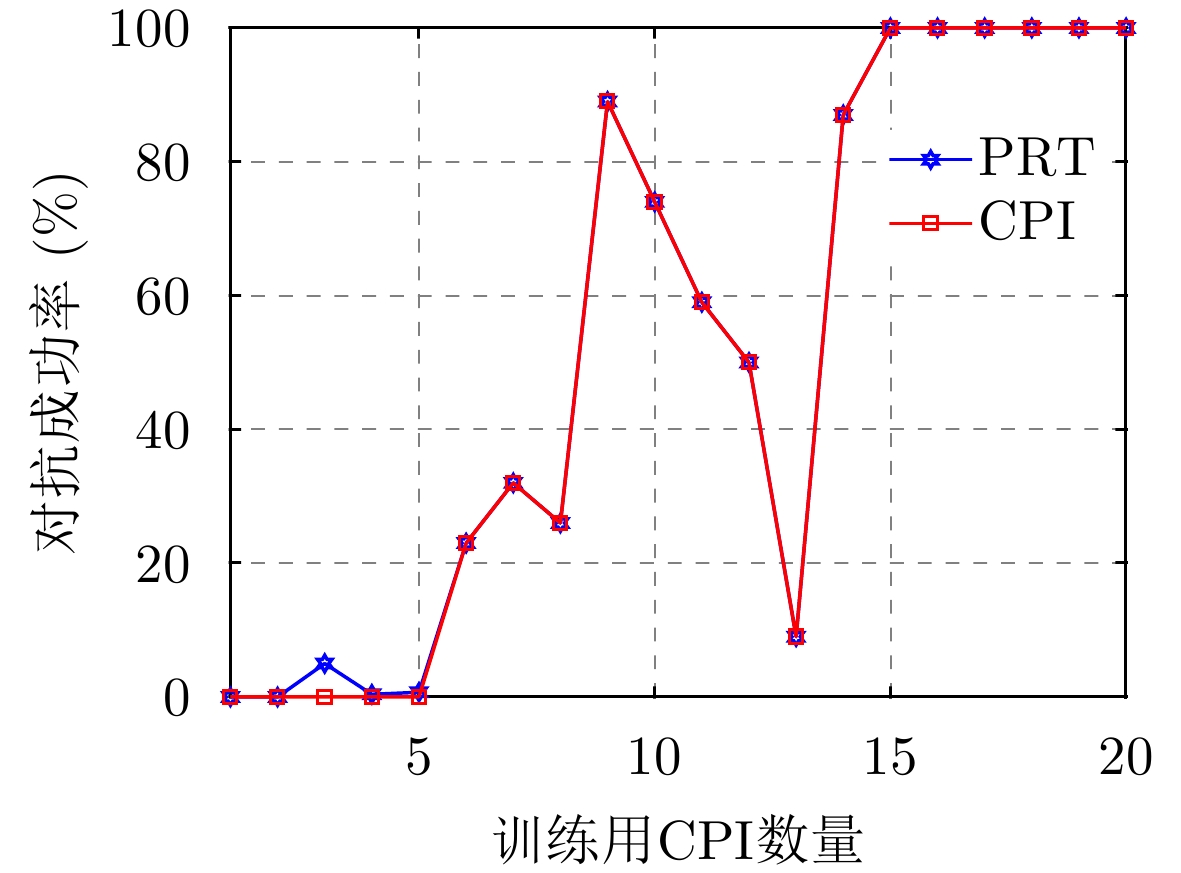
图12展示了训练所用CPI数量对对抗成功率的影响,蒙特卡洛次数为100幕。由于雷达初始频点随机选取,不参与决策,因此去除包含初始状态在内的第1个干扰侦干周期。从第2个周期开始统计,即每幕(CPI)对抗28次。根据4.1.2节对脉间侦干策略的分析,雷达应始终发射单频信号,并在干扰机对当前脉冲侦收干扰后的下个脉冲跳到另一频点,从而诱导干扰机在后续干扰周期内发射窄带瞄频干扰,避免发射宽带阻塞干扰导致跳频手段失效。由于干扰机可以在侦收后立即发射对应频点的干扰,所以每个侦干周期内,无论采取何种手段,至少会存在1个PRT抗干扰失败。因此可以仅针对剩余PRT计算抗干扰成功率,将PRT对抗成功定义为干扰机处于发射干扰阶段时雷达选取到最优策略,即
{fJ=3&fR=[1,1,1]} 或{fJ=1&fR=[3,3,3]} ;CPI对抗成功的判决依据是当前CPI内所有PRT均对抗成功。可以发现,在前20个CPI的训练过程中模型学习到的策略不是一直向好,而是波动变化。在第13个PRT策略出现了明显恶化,这与图11(a)的训练结果相一致。此时模型尚未稳定学习到干扰机的侦干策略,因此仍主要处于试错探索阶段。从第15~20个CPI,模型探索到干扰机策略,并学习到有效对抗策略,保持稳定。
100次蒙特卡洛仿真下的随机频点、PPO和DQN决策的单次对抗(PRT)成功率,单幕(CPI)对抗成功率如表6所示。由于对抗成功率隐含雷达在干扰机侦-干PRT和干扰PRT均发射不同的单频信号,因此随机频点选择的成功概率极低,仅有0.7%。相比PPO,DQN动作搜索更加充分,使对抗成功率得到有效提高,达到100%。
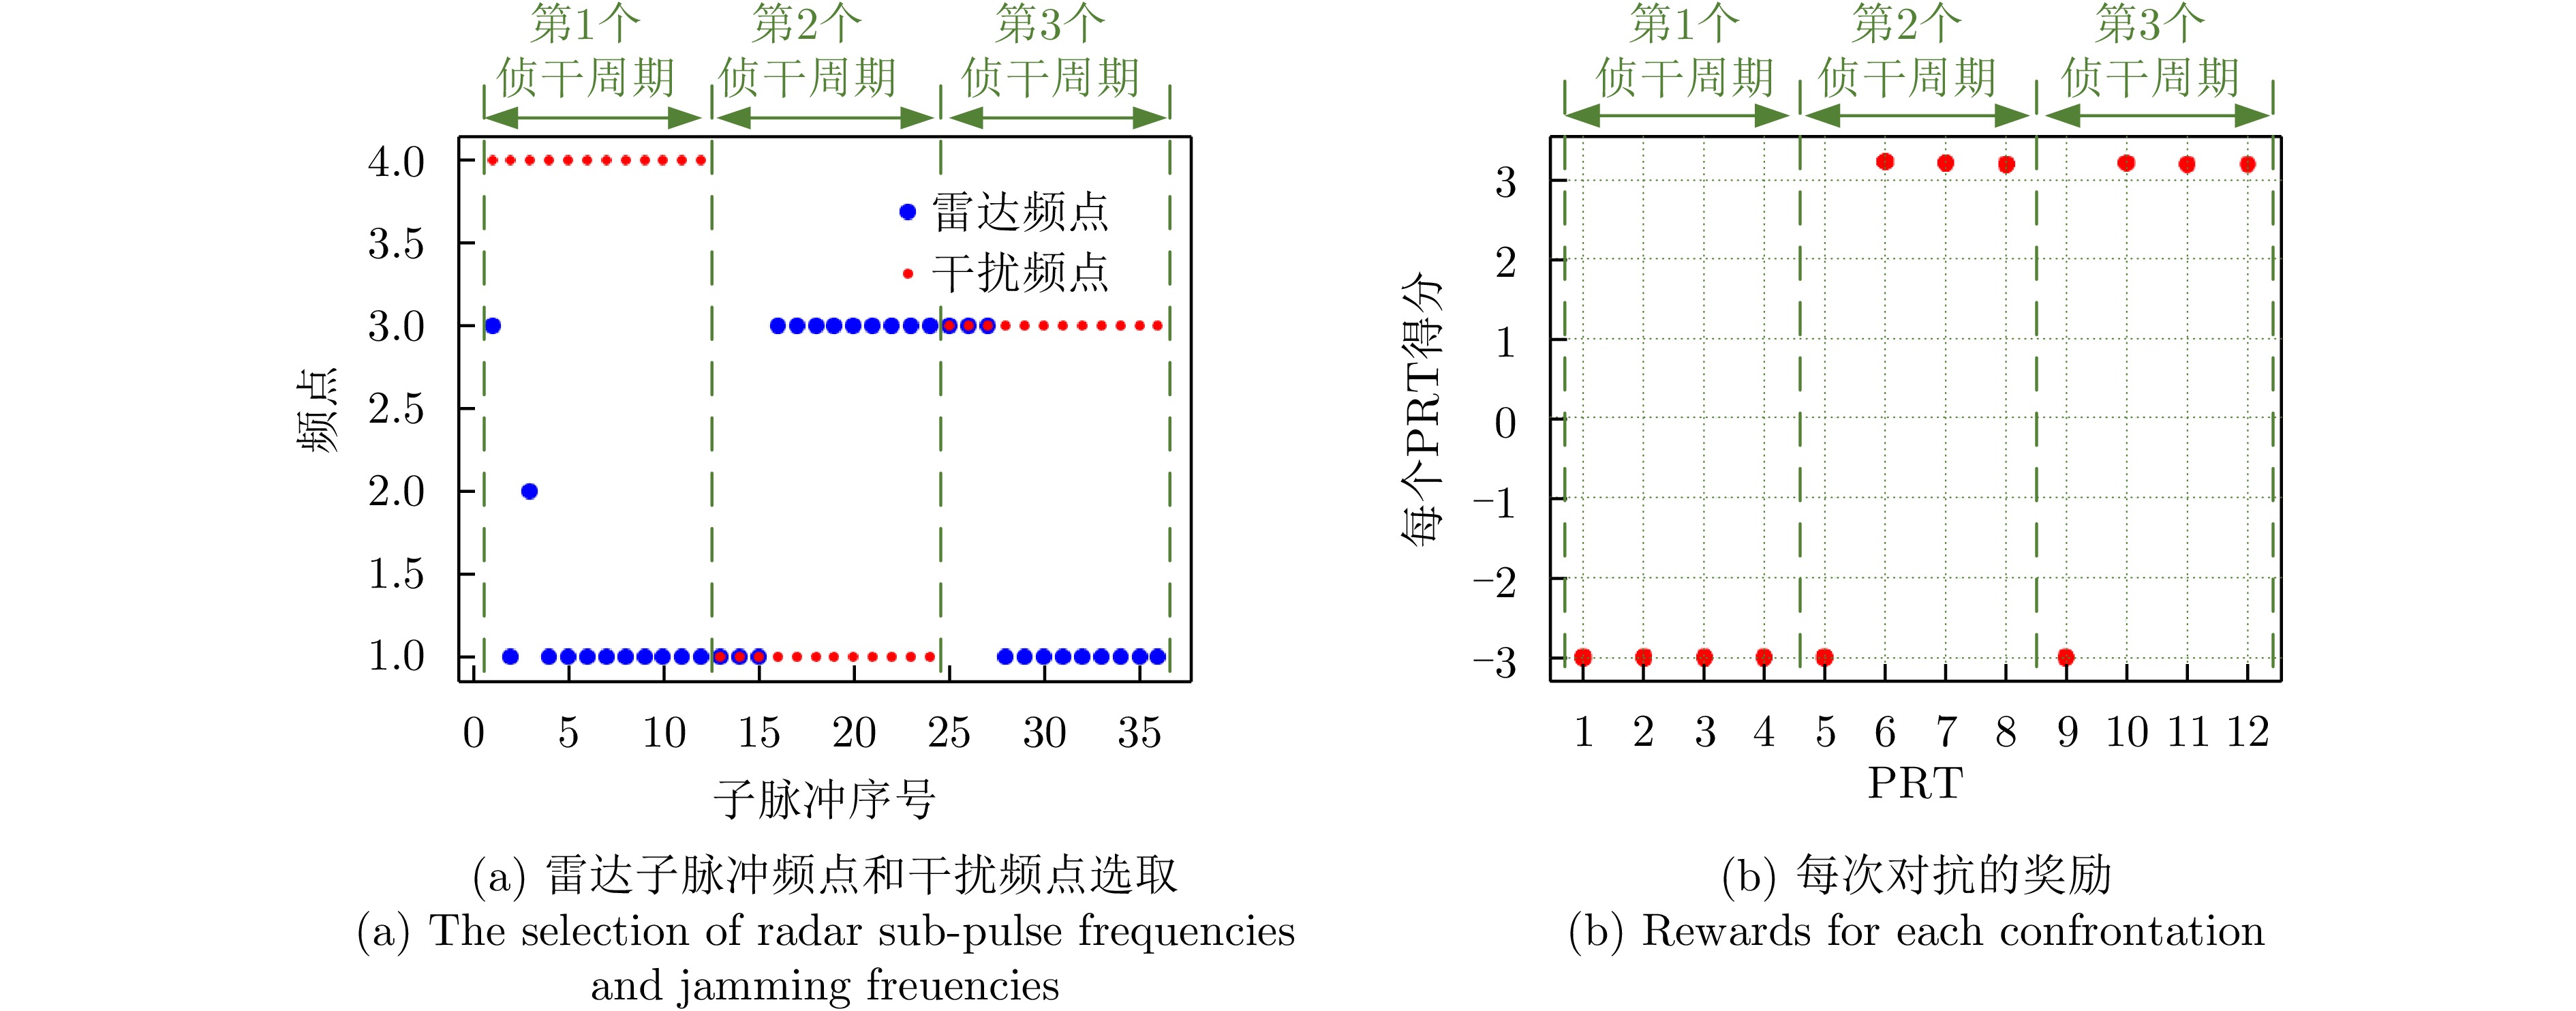
表 6 脉间侦干策略的对抗成功率(%)Table 6. The success rate of confrontation for the pulse-to-pulse interception-jamming strategy (%)策略 PRT对抗成功率 CPI对抗成功率 随机频点 0.7 0 PPO 93.6 31 DQN 100 100 图13(a)展示了干扰机的3个侦干周期下的雷达子脉冲频点选取和干扰瞄准频点。在第1个侦干周期中,由于雷达初始状态的随机性,3个子脉冲分别选取不同频点,导致干扰机在接下来的3个PRT中发射宽带阻塞干扰,此时无论雷达如何跳频,目标均未被检测到,奖励为负值,如图13(b)所示。在第2个侦干周期的第1次对抗中,雷达3个子脉冲均选择频点1,干扰机侦收到并立刻发射对应频点的干扰,因此第1个PRT的奖励为负值。接下来的3个PRT,干扰机继续发射频点1,而雷达选择离频点1最远的频点3。至此第2个侦干周期结束,雷达频点选取成功。在第3个侦干周期中,雷达和干扰的频点选取对调,雷达仍然能够通过频点决策选择受到干扰最小的频点。
以干扰瞄准频点1为例,蒙特卡洛1000次,统计各种策略对抗的目标检测率、脉压后的信干噪比以及平均得分,如表7所示,其中频点[3,3,3]为本文所提模型的策略。可以看出:
表 7 脉间侦干策略下各种雷达策略对抗1000次的结果(fJ=1)Table 7. The results of 1000 confrontations with various radar strategies for the pulse-to-pulse interception-jamming strategy (fJ=1)雷达频点选择 目标检测率(%) 信干噪比(dB) 平均得分 [1,1,1] 0 — –3.00 [1,2,3] 81.3 12.74 0.76 [2,2,2] 99.7 17.08 3.17 [3,3,3] 100 17.58 3.22 注:加粗项表示最优策略 (1) 对于传统雷达跳频策略[1,2,3],有1个子脉冲会被干扰到,此时奖励虽然为正值,但是较低;
(2) 对于[2,2,2],虽然从频点数值上看确实跳频成功,但此时瞄准频点1的干扰功率可能未被全部滤掉,有很少一部分的功率会溢出到频点2,使得其信干噪比略低于频点3;
(3) 当雷达所有子脉冲均选择频点3时,接收到的干扰平均功率达到最小值,平均得分最高,为最优策略。
5. 结语
针对瞄准式压制干扰,本文面向频率捷变雷达,提出了一种基于深度强化学习的频点自适应快速选取方法。根据当前时刻干扰状态,以及上一时刻雷达动作,依靠神经网络自适应选取当前时刻最优雷达频点,并基于目标检测结果以及脉压后的信干噪比作为奖励反馈,迭代改进策略。仿真部分考虑了具备侦收-瞄准-干扰功能的干扰机,证明了通过关键要素设计可以以单个时间步长作为输入学习到干扰策略的时序性。同时,所用DQN算法配合贪婪准则实现了搜索-利用的平衡,配合信干噪比的反馈加速最优抗干扰策略收敛,相比PPO算法收敛速度提升至少10倍。考虑到实际场景中,干扰频点在滤波后可能在邻近频点存在能量残余的情况,所提频率捷变波形设计方法允许子脉冲多次重复选取距离干扰频点最远的雷达频点,有效降低了回波中的干扰剩余能量,提高了信干噪比。同时扩展了动作空间,提供了最优动作选取的基础。
通过本文研究发现,当子脉冲数或脉冲数较多时,增大了网络的搜索和决策空间,使得收敛时间进一步增加,并且提高了最优策略的收敛难度。但这不会影响强化学习的关键要素设计,因此所提方法仍能根据交互数据的反馈结果进行策略优化。另外,考虑到子脉冲间、脉冲间的相位不一致,在积累时会带来一定程度上的增益损失。因此在未来的研究中,考虑将子脉冲以及脉冲间的积累情况纳入到奖励函数中,从而指导策略选取。
-
References
[1] 黄钟泠, 姚西文, 韩军伟. 面向SAR图像解译的物理可解释深度学习技术进展与探讨[J]. 雷达学报, 2022, 11(1): 107–125. doi: 10.12000/JR21165.HUANG Zhongling, YAO Xiwen, and HAN Junwei. Progress and perspective on physically explainable deep learning for synthetic aperture radar image interpretation[J]. Journal of Radars, 2022, 11(1): 107–125. doi: 10.12000/JR21165.[2] 徐真, 王宇, 李宁, 等. 一种基于CNN的SAR图像变化检测方法[J]. 雷达学报, 2017, 6(5): 483–491. doi: 10.12000/JR17075.XU Zhen, WANG Yu, LI Ning, et al. A novel approach to change detection in SAR images with CNN classification[J]. Journal of Radars, 2017, 6(5): 483–491. doi: 10.12000/JR17075.[3] 王志豪, 李刚, 蒋骁. 基于光学和SAR遥感图像融合的洪灾区域检测方法[J]. 雷达学报, 2020, 9(3): 539–553. doi: 10.12000/JR19095.WANG Zhihao, LI Gang, and JIANG Xiao. Flooded area detection method based on fusion of optical and SAR remote sensing images[J]. Journal of Radars, 2020, 9(3): 539–553. doi: 10.12000/JR19095.[4] 洪文, 王彦平, 林赟, 等. 新体制SAR三维成像技术研究进展[J]. 雷达学报, 2018, 7(6): 633–654. doi: 10.12000/JR18109.HONG Wen, WANG Yanping, LIN Yun, et al. Research progress on three-dimensional SAR imaging techniques[J]. Journal of Radars, 2018, 7(6): 633–654. doi: 10.12000/JR18109.[5] 丁赤飚, 刘佳音, 雷斌, 等. 高分三号SAR卫星系统级几何定位精度初探[J]. 雷达学报, 2017, 6(1): 11–16. doi: 10.12000/JR17024.DING Chibiao, LIU Jiayin, LEI Bin, et al. Preliminary exploration of systematic geolocation accuracy of GF-3 SAR satellite system[J]. Journal of Radars, 2017, 6(1): 11–16. doi: 10.12000/JR17024.[6] XIANG Yuming, PENG Lingxiao, WANG Feng, et al. Fast registration of multiview slant-range SAR images[J]. IEEE Geoscience and Remote Sensing Letters, 2022, 19(3): 4007505. doi: 10.1109/LGRS.2020.3045099.[7] WEI S and LAI Shanghong. Fast template matching based on normalized cross correlation with adaptive multilevel winner update[J]. IEEE Transactions on Image Processing, 2008, 17(11): 2227–2235. doi: 10.1109/TIP.2008.2004615.[8] WANG Fei and VEMURI B C. Non-rigid multi-modal image registration using cross-cumulative residual entropy[J]. International Journal of Computer Vision, 2007, 74(2): 201–215. doi: 10.1007/s11263-006-0011-2.[9] DELLINGER F, DELON J, GOUSSEAU Y, et al. SAR-SIFT: A SIFT-like algorithm for SAR images[J]. IEEE Transactions on Geoscience and Remote Sensing, 2015, 53(1): 453–466. doi: 10.1109/TGRS.2014.2323552.[10] 项德良, 徐益豪, 程建达, 等. 一种基于特征交汇关键点检测和Sim-CSPNet的SAR图像配准算法[J]. 雷达学报, 2022, 11(6): 1081–1097. doi: 10.12000/JR22110.XIANG Deliang, XU Yihao, CHENG Jianda, et al. An algorithm based on a feature interaction-based keypoint detector and sim-CSPNet for SAR image registration[J]. Journal of Radars, 2022, 11(6): 1081–1097. doi: 10.12000/JR22110.[11] LIAO Furong, CHEN Yan, CHEN Yunping, et al. SAR image registration based on optimized ransac algorithm with mixed feature extraction[C]. 2020 IEEE International Geoscience and Remote Sensing Symposium, Waikoloa, USA, 2020: 1153–1156. doi: 10.1109/IGARSS39084.2020.9323180.[12] DENG Yang and DENG Yunkai. Two-step matching approach to obtain more control points for SIFT-like very-high-resolution SAR image registration[J]. Sensors, 2023, 23(7): 3739. doi: 10.3390/s23073739.[13] XIANG Deliang, XIE Yuzhen, CHENG Jianda, et al. Optical and SAR image registration based on feature decoupling network[J]. IEEE Transactions on Geoscience and Remote Sensing, 2022, 60: 5235913. doi: 10.1109/TGRS.2022.3211858.[14] XIANG Yuming, JIAO Niangang, LIU Rui, et al. A geometry-aware registration algorithm for multiview high-resolution SAR images[J]. IEEE Transactions on Geoscience and Remote Sensing, 2022, 60: 5234818. doi: 10.1109/TGRS.2022.3205382.[15] GUO Qiangliang, XIAO Jin, HU Xiaoguang, et al. Local convolutional features and metric learning for SAR image registration[J]. Cluster Computing, 2019, 22(2): 3103–3114. doi: 10.1007/s10586-018-1946-0.[16] FAN Jianwei, WU Yan, WANG Fan, et al. SAR image registration using phase congruency and nonlinear diffusion-based SIFT[J]. IEEE Geoscience and Remote Sensing Letters, 2015, 12(3): 562–566. doi: 10.1109/LGRS.2014.2351396.[17] FAN Yibo, WANG Feng, and WANG Haipeng. A transformer-based coarse-to-fine wide-swath SAR image registration method under weak texture conditions[J]. Remote Sensing, 2022, 14(5): 1175. doi: 10.3390/rs14051175.[18] ELWAN M, AMEIN A S, MOUSA A, et al. SAR image matching based on local feature detection and description using convolutional neural network[J]. Security and Communication Networks, 2022, 2022(1): 5669069. doi: 10.1155/2022/5669069.[19] MEN Peng, GUO Hao, AN Jubai, et al. An improved L2Net for repetitive texture image registration with intensity difference heterogeneous SAR images[J]. Remote Sensing, 2022, 14(11): 2527. doi: 10.3390/rs14112527.[20] ZHANG Yifan, LI Zhiwei, WANG Wen, et al. A robust registration method for multi-view SAR images based on best buddy similarity[C]. The International Archives of the Photogrammetry, Remote Sensing and Spatial Information Sciences, Changsha, China, 2024: 881–886. doi: 10.5194/isprs-archives-XLVIII-1-2024-881-2024.[21] LI Zeyi, ZHANG Haitao, and HUANG Yihang. A rotation-invariant optical and SAR image registration algorithm based on deep and Gaussian features[J]. Remote Sensing, 2021, 13(13): 2628. doi: 10.3390/rs13132628.[22] YU Wei, SUN Xiaohuai, YANG Kuiyuan, et al. Hierarchical semantic image matching using CNN feature pyramid[J]. Computer Vision and Image Understanding, 2018, 169: 40–51. doi: 10.1016/j.cviu.2018.01.001.[23] SAUVALLE B and DE LA FORTELLE A. Unsupervised multi-object segmentation using attention and soft-argmax[C]. 2023 IEEE/CVF Winter Conference on Applications of Computer Vision, Waikoloa, USA, 2023: 3267–3276. doi: 10.1109/WACV56688.2023.00328.[24] NUNES C F G and PÁDUA F L C. A local feature descriptor based on Log-Gabor filters for keypoint matching in multispectral images[J]. IEEE Geoscience and Remote Sensing Letters, 2017, 14(10): 1850–1854. doi: 10.1109/LGRS.2017.2738632.[25] HOSANG J, BENENSON R, and SCHIELE B. Learning non-maximum suppression[C]. 2017 IEEE Conference on Computer Vision and Pattern Recognition, Honolulu, USA, 2017: 4507–4515. doi: 10.1109/CVPR.2017.685.[26] CHUNG S W, CHUNG J S, and KANG H G. Perfect match: Self-supervised embeddings for cross-modal retrieval[J]. IEEE Journal of Selected Topics in Signal Processing, 2020, 14(3): 568–576. doi: 10.1109/JSTSP.2020.2987720.[27] CHEN Feng, WU Fei, XU Jing, et al. Adaptive deformable convolutional network[J]. Neurocomputing, 2021, 453: 853–864. doi: 10.1016/j.neucom.2020.06.128.[28] KILIÇARSLAN S and CELIK M. RSigELU: A nonlinear activation function for deep neural networks[J]. Expert Systems with Applications, 2021, 174: 114805. doi: 10.1016/j.eswa.2021.114805.[29] XU Jin, LI Zishan, DU Bowen, et al. Reluplex made more practical: Leaky ReLU[C]. 2020 IEEE Symposium on Computers and Communications, Rennes, France, 2020: 1–7. doi: 10.1109/ISCC50000.2020.9219587.[30] LI Jiayuan, HU Qingwu, and AI Mingyao. RIFT: Multi-modal image matching based on radiation-variation insensitive feature transform[J]. IEEE Transactions on Image Processing, 2020, 29: 3296–3310. doi: 10.1109/TIP.2019.2959244.[31] GERMAIN H, BOURMAUD G, and LEPETIT V. S2DNet: Learning image features for accurate sparse-to-dense matching[C]. The 16th European Conference on Computer Vision, Glasgow, UK, 2020: 626–643. doi: 10.1007/978-3-030-58580-8_37.[32] JAMIN A and HUMEAU-HEURTIER A. (Multiscale) cross-entropy methods: A review[J]. Entropy, 2019, 22(1): 45. doi: 10.3390/e22010045.[33] YAMADA M, SIGAL L, RAPTIS M, et al. Cross-domain matching with squared-loss mutual information[J]. IEEE Transactions on Pattern Analysis and Machine Intelligence, 2015, 37(9): 1764–1776. doi: 10.1109/TPAMI.2014.2388235.[34] ZHU Li and ZHU Chunqiang. Application of Hausdorff distance in image matching[C]. 2014 IEEE Workshop on Electronics, Computer and Applications, Ottawa, Canada, 2014: 97–100. doi: 10.1109/IWECA.2014.6845566.[35] HE Yueping, WANG Xueqian, ZHANG Yiming, et al. A novel loss function for optical and SAR image matching: Balanced positive and negative samples[J]. IEEE Geoscience and Remote Sensing Letters, 2022, 19: 4028805. doi: 10.1109/LGRS.2022.3225965.[36] JIA Weikuan, SUN Meili, LIAN Jian, et al. Feature dimensionality reduction: A review[J]. Complex & Intelligent Systems, 2022, 8(3): 2663–2693. doi: 10.1007/s40747-021-00637-x.[37] DETONE D, MALISIEWICZ T, and RABINOVICH A. SuperPoint: Self-supervised interest point detection and description[C]. 2018 IEEE/CVF Conference on Computer Vision and Pattern Recognition Workshops, Salt Lake City, USA, 2018: 224–236. doi: 10.1109/CVPRW.2018.00060.[38] HAN Xufeng, LEUNG T, JIA Yangqing, et al. MatchNet: Unifying feature and metric learning for patch-based matching[C]. 2015 IEEE Conference on Computer Vision and Pattern Recognition, Boston, USA, 2015: 3279–3286. doi: 10.1109/CVPR.2015.7298948.[39] HASHIMOTO M, ENOMOTO M, and FUKUSHIMA Y. Coseismic deformation from the 2008 Wenchuan, China, earthquake derived from ALOS/PALSAR images[J]. Tectonophysics, 2010, 491(1/4): 59–71. doi: 10.1016/j.tecto.2009.08.034.[40] GEUDTNER D, TORRES R, SNOEIJ P, et al. Sentinel-1 system capabilities and applications[C]. 2014 IEEE Geoscience and Remote Sensing Symposium, Quebec City, Canada, 2014: 1457–1460. doi: 10.1109/IGARSS.2014.6946711.[41] 李志远, 郭嘉逸, 张月婷, 等. 基于自适应动量估计优化器与空变最小熵准则的SAR图像船舶目标自聚焦算法[J]. 雷达学报, 2022, 11(1): 83–94. doi: 10.12000/JR21159.LI Zhiyuan, GUO Jiayi, ZHANG Yueting, et al. A novel autofocus algorithm of ship target in SAR image based on the adaptive momentum estimation optimizer and space-variant minimum entropy criteria[J]. Journal of Radars, 2022, 11(1): 83–94. doi: 10.12000/JR21159.[42] 苏娟, 李彬, 王延钊. 一种基于封闭均匀区域的SAR图像配准方法[J]. 电子与信息学报, 2016, 38(12): 3282–3288. doi: 10.11999/JEIT160141.SU Juan, LI Bin, and WANG Yanzhao. SAR image registration algorithm based on closed uniform regions[J]. Journal of Electronics & Information Technology, 2016, 38(12): 3282–3288. doi: 10.11999/JEIT160141. Relative Articles
[1] ZHANG Qiang, WANG Zhihao, WANG Xueqian, LI Gang, HUANG Liwei, SONG Huina, SONG Zhaohui. Cooperative Detection of Ships in Optical and SAR Remote Sensing Images Based on Neighborhood Saliency[J]. Journal of Radars, 2024, 13(4): 885-903. doi: 10.12000/JR24037 [2] XING Mengdao, MA Penghui, LOU Yishan, SUN Guangcai, LIN Hao. Review of Fast Back Projection Algorithms in Synthetic Aperture Radar[J]. Journal of Radars, 2024, 13(1): 1-22. doi: 10.12000/JR23183 [3] WANG Yanfei, LI Heping, HAN Song. Synthetic Aperture Imaging of Antenna Array Coded[J]. Journal of Radars, 2023, 12(1): 1-12. doi: 10.12000/JR23011 [4] XIANG Deliang, XU Yihao, CHENG Jianda, HU Canbin, SUN Xiaokun. An Algorithm Based on a Feature Interaction-based Keypoint Detector and Sim-CSPNet for SAR Image Registration[J]. Journal of Radars, 2022, 11(6): 1081-1097. doi: 10.12000/JR22110 [5] MA Lin, PAN Zongxu, HUANG Zhongling, HAN Bing, HU Yuxin, ZHOU Xiao, LEI Bin. Multichannel False-target Discrimination in SAR Images Based on Sub-aperture and Full-aperture Feature Learning[J]. Journal of Radars, 2021, 10(1): 159-172. doi: 10.12000/JR20106 [6] ZHU Qingtao, YIN Junjun, ZENG Liang, YANG Jian. Polarimetric SAR Image Affine Registration Based on Neighborhood Consensus[J]. Journal of Radars, 2021, 10(1): 49-60. doi: 10.12000/JR20120 [7] SUN Hao, CHEN Jin, LEI Lin, JI Kefeng, KUANG Gangyao. Adversarial Robustness of Deep Convolutional Neural Network-based Image Recognition Models: A Review[J]. Journal of Radars, 2021, 10(4): 571-594. doi: 10.12000/JR21048 [8] ZENG Tao, WEN Yuhan, WANG Yan, DING Zegang, WEI Yangkai, YUAN Tiaotiao. Research Progress on Synthetic Aperture Radar Parametric Imaging Methods[J]. Journal of Radars, 2021, 10(3): 327-341. doi: 10.12000/JR21004 [9] WEI Yangkai, ZENG Tao, CHEN Xinliang, DING Zegang, FAN Yujie, WEN Yuhan. Parametric SAR Imaging for Typical Lines and Surfaces[J]. Journal of Radars, 2020, 9(1): 143-153. doi: 10.12000/JR19077 [10] LI Yongzhen, HUANG Datong, XING Shiqi, WANG Xuesong. A Review of Synthetic Aperture Radar Jamming Technique[J]. Journal of Radars, 2020, 9(5): 753-764. doi: 10.12000/JR20087 [11] HUANG Yan, ZHAO Bo, TAO Mingliang, CHEN Zhanye, HONG Wei. Review of Synthetic Aperture Radar Interference Suppression[J]. Journal of Radars, 2020, 9(1): 86-106. doi: 10.12000/JR19113 [12] LI Xiaofeng, ZHANG Biao, YANG Xiaofeng. Remote Sensing of Sea Surface Wind and Wave from Spaceborne Synthetic Aperture Radar[J]. Journal of Radars, 2020, 9(3): 425-443. doi: 10.12000/JR20079 [13] HU Cheng, DENG Yunkai, TIAN Weiming, ZENG Tao. A Compensation Method of Nonlinear Atmospheric Phase Applied for GB-InSAR Images[J]. Journal of Radars, 2019, 8(6): 831-840. doi: 10.12000/JR19073 [14] XING Mengdao, LIN Hao, CHEN Jianlai, SUN Guangcai, YAN Bangbang. A Review of Imaging Algorithms in Multi-platform-borne Synthetic Aperture Radar[J]. Journal of Radars, 2019, 8(6): 732-757. doi: 10.12000/JR19102 [15] Zhou Zibo, Jiang Libing, Wang Zhuang. Image Registration Based on Wave Path Difference Compensation for InISAR[J]. Journal of Radars, 2018, 7(6): 758-769. doi: 10.12000/JR18070 [16] Ren Xiaozhen, Yang Ruliang. Four-dimensional SAR Imaging Algorithm Based on Iterative Reconstruction of Magnitude and Phase[J]. Journal of Radars, 2016, 5(1): 65-71. doi: 10.12000/JR15135 [17] Jin Tian. An Enhanced Imaging Method for Foliage Penetration Synthetic Aperture Radar[J]. Journal of Radars, 2015, 4(5): 503-508. doi: 10.12000/JR15114 [18] Zeng Cao, Liang Si-jia, Wang Wei, Xu Qing. Imaging Algorithm for Rotor Synthetic Aperture Radar Using Stepped-frequency Waveform[J]. Journal of Radars, 2014, 3(4): 401-408. doi: 10.3724/SP.J.1300.2014.14043 [19] Chong Jin-song, Zhou Xiao-zhong. Survey of Study on Internal Waves Detection in Synthetic Aperture Radar Image[J]. Journal of Radars, 2013, 2(4): 406-421. doi: 10.3724/SP.J.1300.2013.13012 Cited by
Periodical cited type(1)
1. 王兴家,王彬,刘岳巍,晏学成,丁峰. 基于元知识转移的认知雷达波形设计. 雷达科学与技术. 2024(04): 443-453 . 
Other cited types(4)
-
Proportional views
- 1 基于深度Q网络的雷达子脉冲频点决策1. Radar sub-pulse frequency decision based on Deep Q-Network (DQN)
Step 1:初始化: Step 1-1:使用随机参数θ初始化估计值Q网络 Step 1-2:使用参数θ−=θ初始化目标值ˆQ网络 Step 1-3:初始化经验池D Step 1-4:初始化干扰策略,雷达子脉冲数量及频点,折扣因
子γ,学习率α,贪婪因子ε,软间隔更新系数τ等参数Step 2:每幕: Step 2-1:设置初始状态s1=[fR,0,fJ,1] Step 2-2:每个时间步: Step 2-2-1:使用ε-贪婪原则依据估计值网络的输出结果选择
各子脉冲频点at=fR,t=[fsub1,t,fsub2,t,⋯,fsubN,t],即以
1−ε概率选择估计值网络输出的最佳的频点或者以ε概率随
机选择频点Step 2-2-2:雷达发射子脉冲频率捷变波形,接收到回波后,感
知得到下一时刻状态st+1并根据目标检测结果和脉压后的信
干噪比评估当前时刻奖励rtStep 2-2-3:将(st,at,rt,st+1)存储到经验池D中,如果经验池
中的样本数超出预定数量,则删除早期训练样本数据,以便存
储并使用最新样本数据Step 2-2-4:如果经验池D中保存数量超过起始值,则从D中选
择批大小(batchsize)个样本作为训练集输入到估计值和目标值
网络中,分别计算得到Q(st,at;θ)和y=rt+γmaxˆQ(st+1,
a′t+1;θ−),并反向梯度求导使误差函数L(θ)=[y−Q(st,at;
θ)]2趋近0,更新估计值网络参数θStep 2-2-5:每隔一定的时间步软更新目标值网络参数θ− Step 2-3:结束该时间步 Step 2-4:降低贪婪概率ε Step 3:结束该幕 - 表 1 频率捷变信号参数设置Table 1. The parameter settings of frequency agile signal
参数 数值 子脉冲调制类型 LFM 子脉冲个数 3 子脉冲频点 [10 MHz, 30 MHz, 50 MHz] 子脉冲脉宽 5 μs 子脉冲带宽 5 MHz 信噪比 0 dB - 表 2 干扰参数设置Table 2. The parameter settings of jamming
干扰类型 参数 数值 窄带瞄频 瞄准频点 [10 MHz, 30 MHz, 50 MHz] 带宽 10 MHz 干噪比 35 dB 宽带阻塞 带宽 120 MHz 干噪比 30 dB - 表 3 DQN参数设置Table 3. The parameter settings of DQN
参数 数值 批大小 64 学习率 0.001 折扣因子 0.99 缓冲区大小 10000 起始训练样本量 64 贪婪因子衰减系数 0.2 幕 32个时间步 目标值网络更新周期 4个时间步 目标值网络软间隔更新系数 0.01 隐藏层数量 2 隐藏层神经元个数 64 归一化系数 80 - 表 4 脉内侦干策略的对抗成功率(%)Table 4. The success rate of confrontation for the intra-pulse interception-jamming strategy (%)
策略 PRT对抗成功率 CPI对抗成功率 随机频点 9.7 0 PPO 94 9 DQN 100 100 - 表 5 脉内侦干策略下各种雷达策略对抗1000次结果(fJ=fsub1)Table 5. The results of 1000 confrontations with various radar strategies for the intra-pulse interception-jamming strategy (fJ=fsub1)
雷达频点选择 目标检测率(%) 信干噪比(dB) 平均得分 [1,1,1] 0 — –3.00 [1,1,2] 0 11.09 –1.12 [1,1,3] 0 12.25 –0.96 [1,2,2] 97.6 15.20 1.09 [1,2,3] 81.7 12.78 0.78 [1,3,3] 99.7 16.06 1.19 [2,1,1] 98.3 15.35 1.12 [2,1,3] 75.6 12.47 0.64 [2,3,3] 97.7 15.19 1.10 [3,1,1] 99.6 16.07 1.18 注:综合考虑噪声随机性引起的得分波动情况,加粗项为最优策略 - 表 6 脉间侦干策略的对抗成功率(%)Table 6. The success rate of confrontation for the pulse-to-pulse interception-jamming strategy (%)
策略 PRT对抗成功率 CPI对抗成功率 随机频点 0.7 0 PPO 93.6 31 DQN 100 100 - 表 7 脉间侦干策略下各种雷达策略对抗1000次的结果(fJ=1)Table 7. The results of 1000 confrontations with various radar strategies for the pulse-to-pulse interception-jamming strategy (fJ=1)
雷达频点选择 目标检测率(%) 信干噪比(dB) 平均得分 [1,1,1] 0 — –3.00 [1,2,3] 81.3 12.74 0.76 [2,2,2] 99.7 17.08 3.17 [3,3,3] 100 17.58 3.22 注:加粗项表示最优策略
Step 1:初始化: Step 1-1:使用随机参数θ初始化估计值Q网络 Step 1-2:使用参数θ−=θ初始化目标值ˆQ网络 Step 1-3:初始化经验池D Step 1-4:初始化干扰策略,雷达子脉冲数量及频点,折扣因
子γ,学习率α,贪婪因子ε,软间隔更新系数τ等参数Step 2:每幕: Step 2-1:设置初始状态s1=[fR,0,fJ,1] Step 2-2:每个时间步: Step 2-2-1:使用ε-贪婪原则依据估计值网络的输出结果选择
各子脉冲频点at=fR,t=[fsub1,t,fsub2,t,⋯,fsubN,t],即以
1−ε概率选择估计值网络输出的最佳的频点或者以ε概率随
机选择频点Step 2-2-2:雷达发射子脉冲频率捷变波形,接收到回波后,感
知得到下一时刻状态st+1并根据目标检测结果和脉压后的信
干噪比评估当前时刻奖励rtStep 2-2-3:将(st,at,rt,st+1)存储到经验池D中,如果经验池
中的样本数超出预定数量,则删除早期训练样本数据,以便存
储并使用最新样本数据Step 2-2-4:如果经验池D中保存数量超过起始值,则从D中选
择批大小(batchsize)个样本作为训练集输入到估计值和目标值
网络中,分别计算得到Q(st,at;θ)和y=rt+γmaxˆQ(st+1,
a′t+1;θ−),并反向梯度求导使误差函数L(θ)=[y−Q(st,at;
θ)]2趋近0,更新估计值网络参数θStep 2-2-5:每隔一定的时间步软更新目标值网络参数θ− Step 2-3:结束该时间步 Step 2-4:降低贪婪概率ε Step 3:结束该幕 参数 数值 子脉冲调制类型 LFM 子脉冲个数 3 子脉冲频点 [10 MHz, 30 MHz, 50 MHz] 子脉冲脉宽 5 μs 子脉冲带宽 5 MHz 信噪比 0 dB 干扰类型 参数 数值 窄带瞄频 瞄准频点 [10 MHz, 30 MHz, 50 MHz] 带宽 10 MHz 干噪比 35 dB 宽带阻塞 带宽 120 MHz 干噪比 30 dB 参数 数值 批大小 64 学习率 0.001 折扣因子 0.99 缓冲区大小 10000 起始训练样本量 64 贪婪因子衰减系数 0.2 幕 32个时间步 目标值网络更新周期 4个时间步 目标值网络软间隔更新系数 0.01 隐藏层数量 2 隐藏层神经元个数 64 归一化系数 80 策略 PRT对抗成功率 CPI对抗成功率 随机频点 9.7 0 PPO 94 9 DQN 100 100 雷达频点选择 目标检测率(%) 信干噪比(dB) 平均得分 [1,1,1] 0 — –3.00 [1,1,2] 0 11.09 –1.12 [1,1,3] 0 12.25 –0.96 [1,2,2] 97.6 15.20 1.09 [1,2,3] 81.7 12.78 0.78 [1,3,3] 99.7 16.06 1.19 [2,1,1] 98.3 15.35 1.12 [2,1,3] 75.6 12.47 0.64 [2,3,3] 97.7 15.19 1.10 [3,1,1] 99.6 16.07 1.18 注:综合考虑噪声随机性引起的得分波动情况,加粗项为最优策略 策略 PRT对抗成功率 CPI对抗成功率 随机频点 0.7 0 PPO 93.6 31 DQN 100 100 雷达频点选择 目标检测率(%) 信干噪比(dB) 平均得分 [1,1,1] 0 — –3.00 [1,2,3] 81.3 12.74 0.76 [2,2,2] 99.7 17.08 3.17 [3,3,3] 100 17.58 3.22 注:加粗项表示最优策略
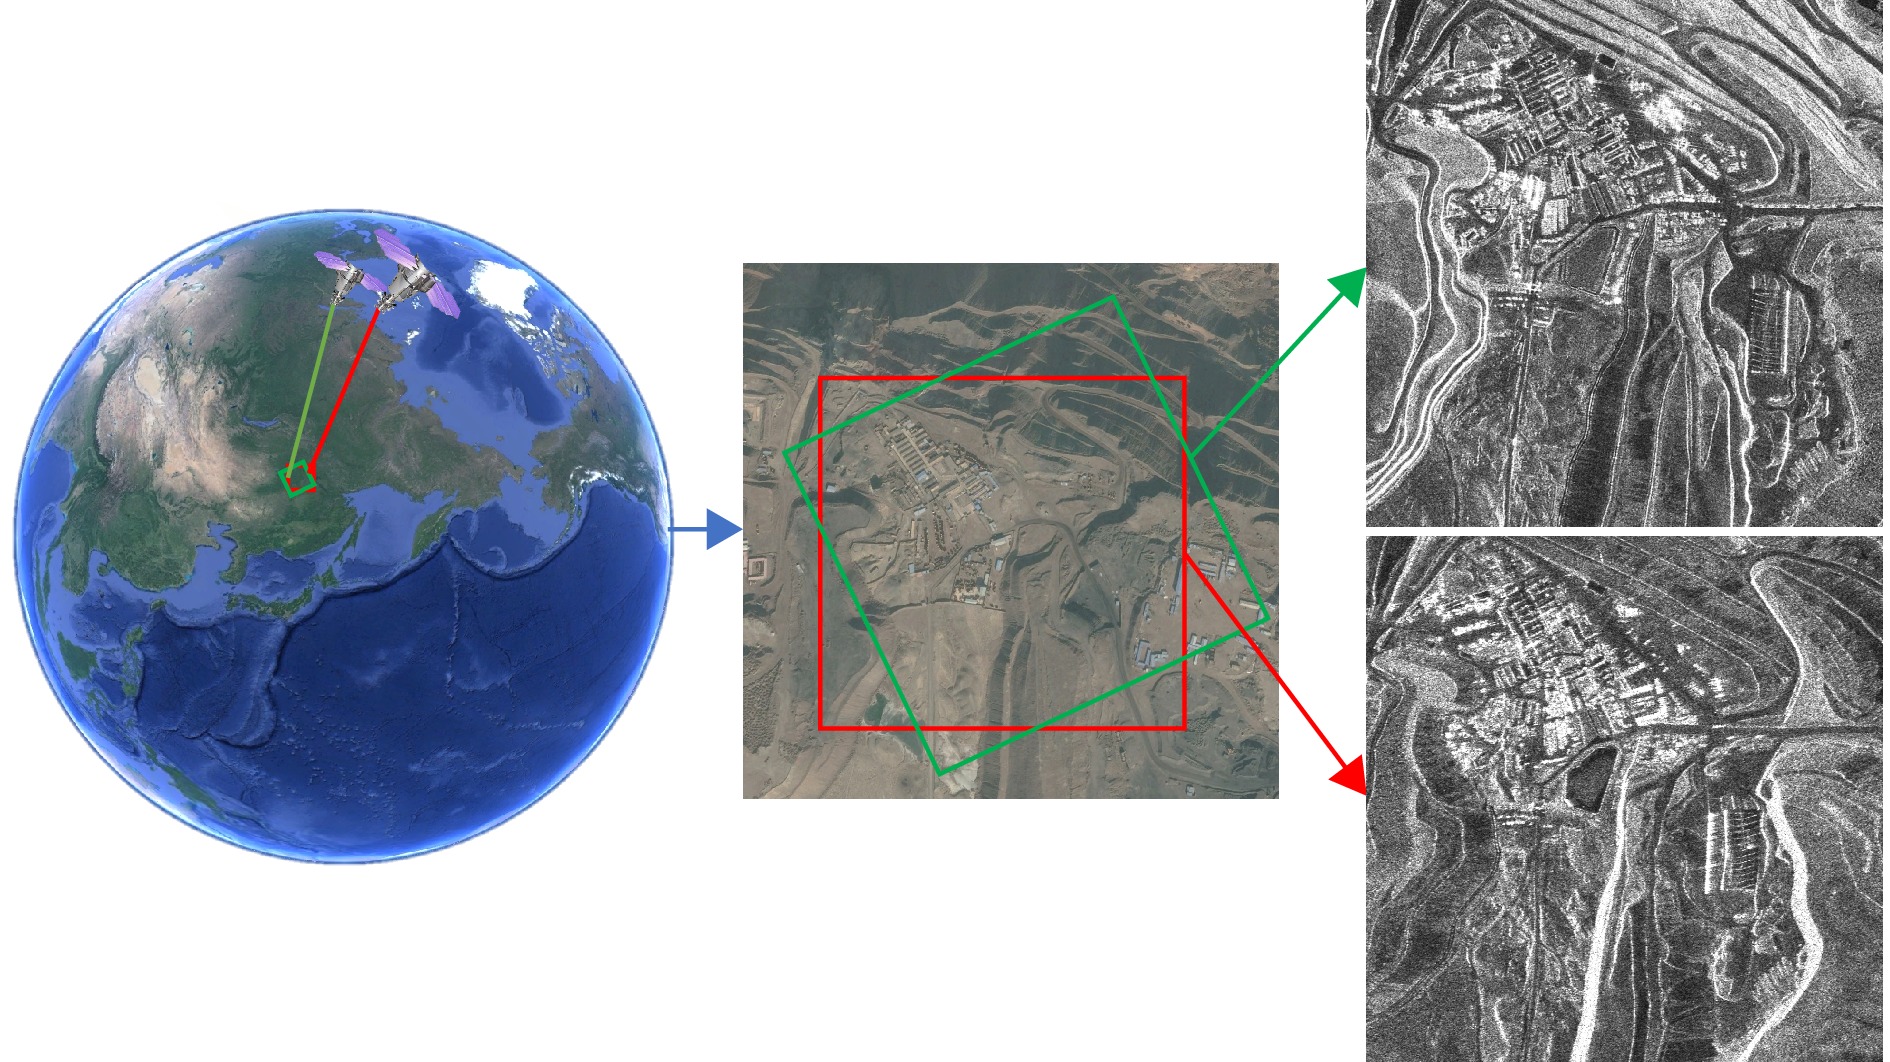
- Figure 1. Schematic diagram of multi-view SAR image in the same area
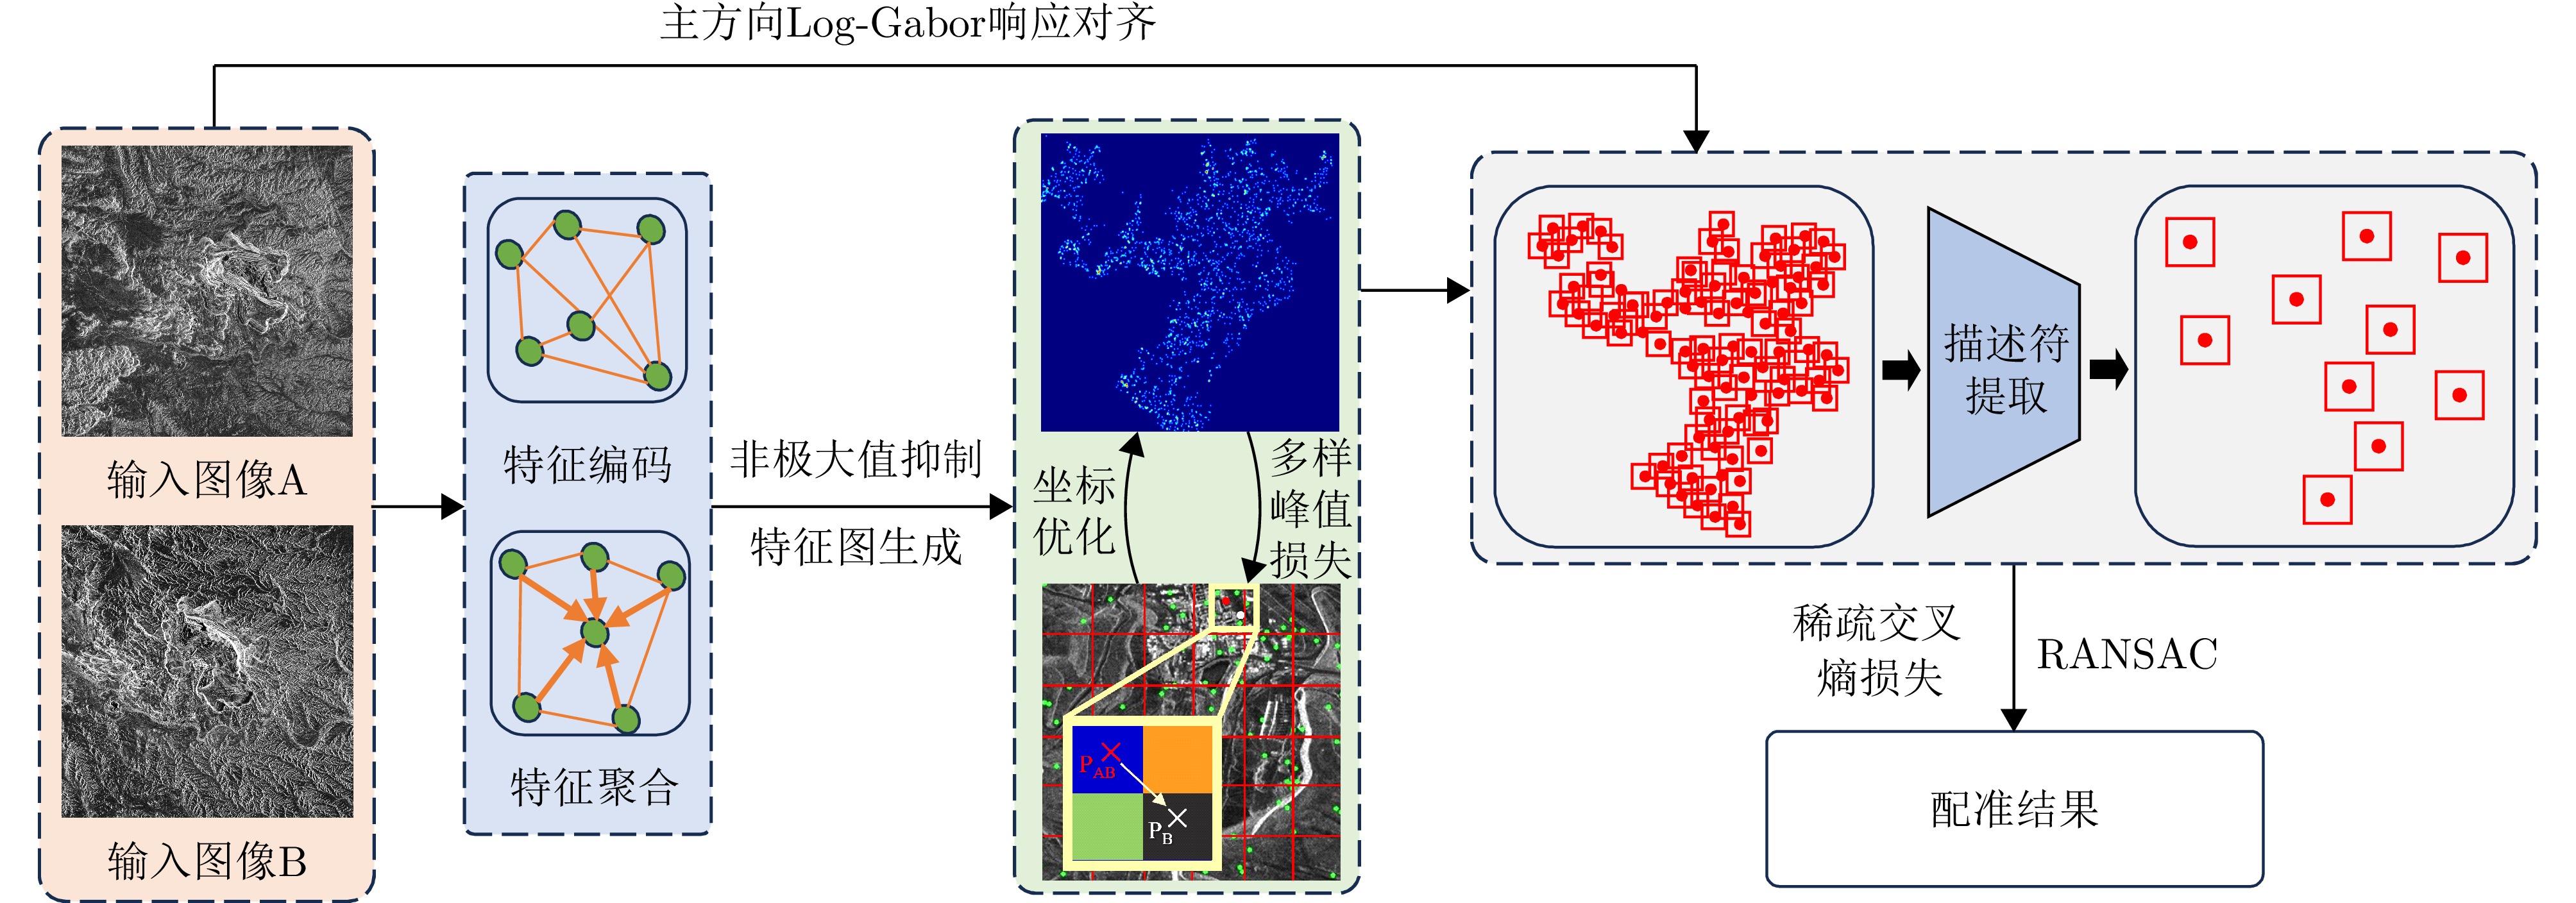
- Figure 2. Overall flow chart of the algorithm in this paper
- Figure 3. Flow chart of feature extraction algorithm based on local pixel migration model
- Figure 4. Feature coding and feature aggregation flow chart
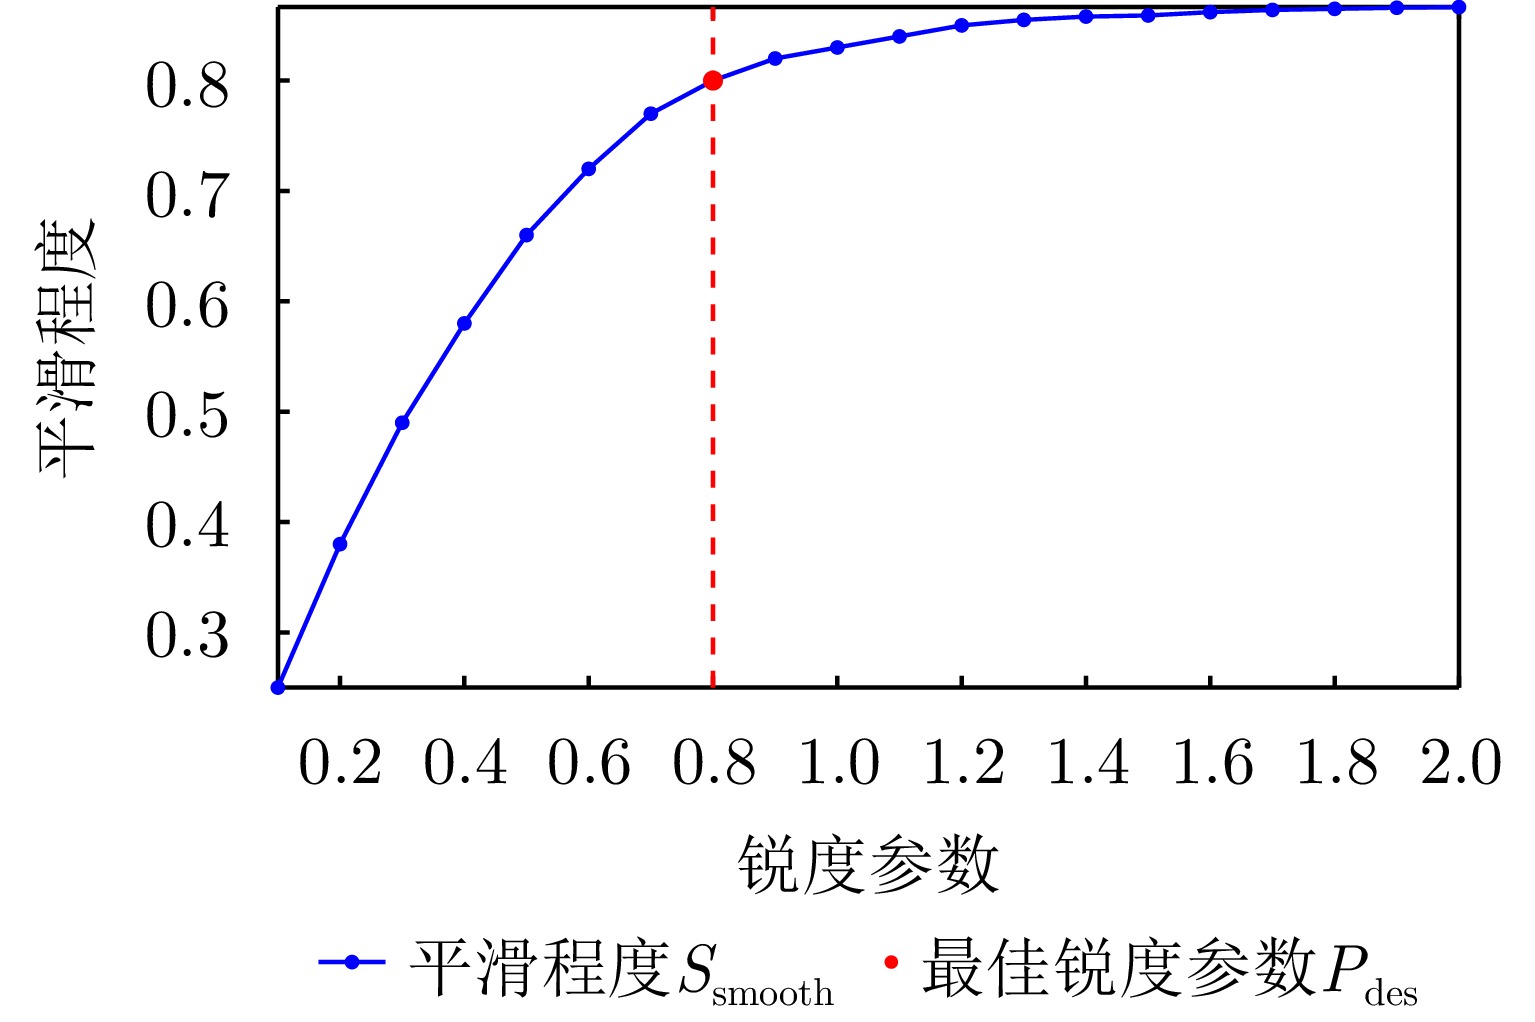
- Figure 5. Line graph of smoothness distribution under different sharpness parameters
- Figure 6. Spaceborne image pairs to be registered
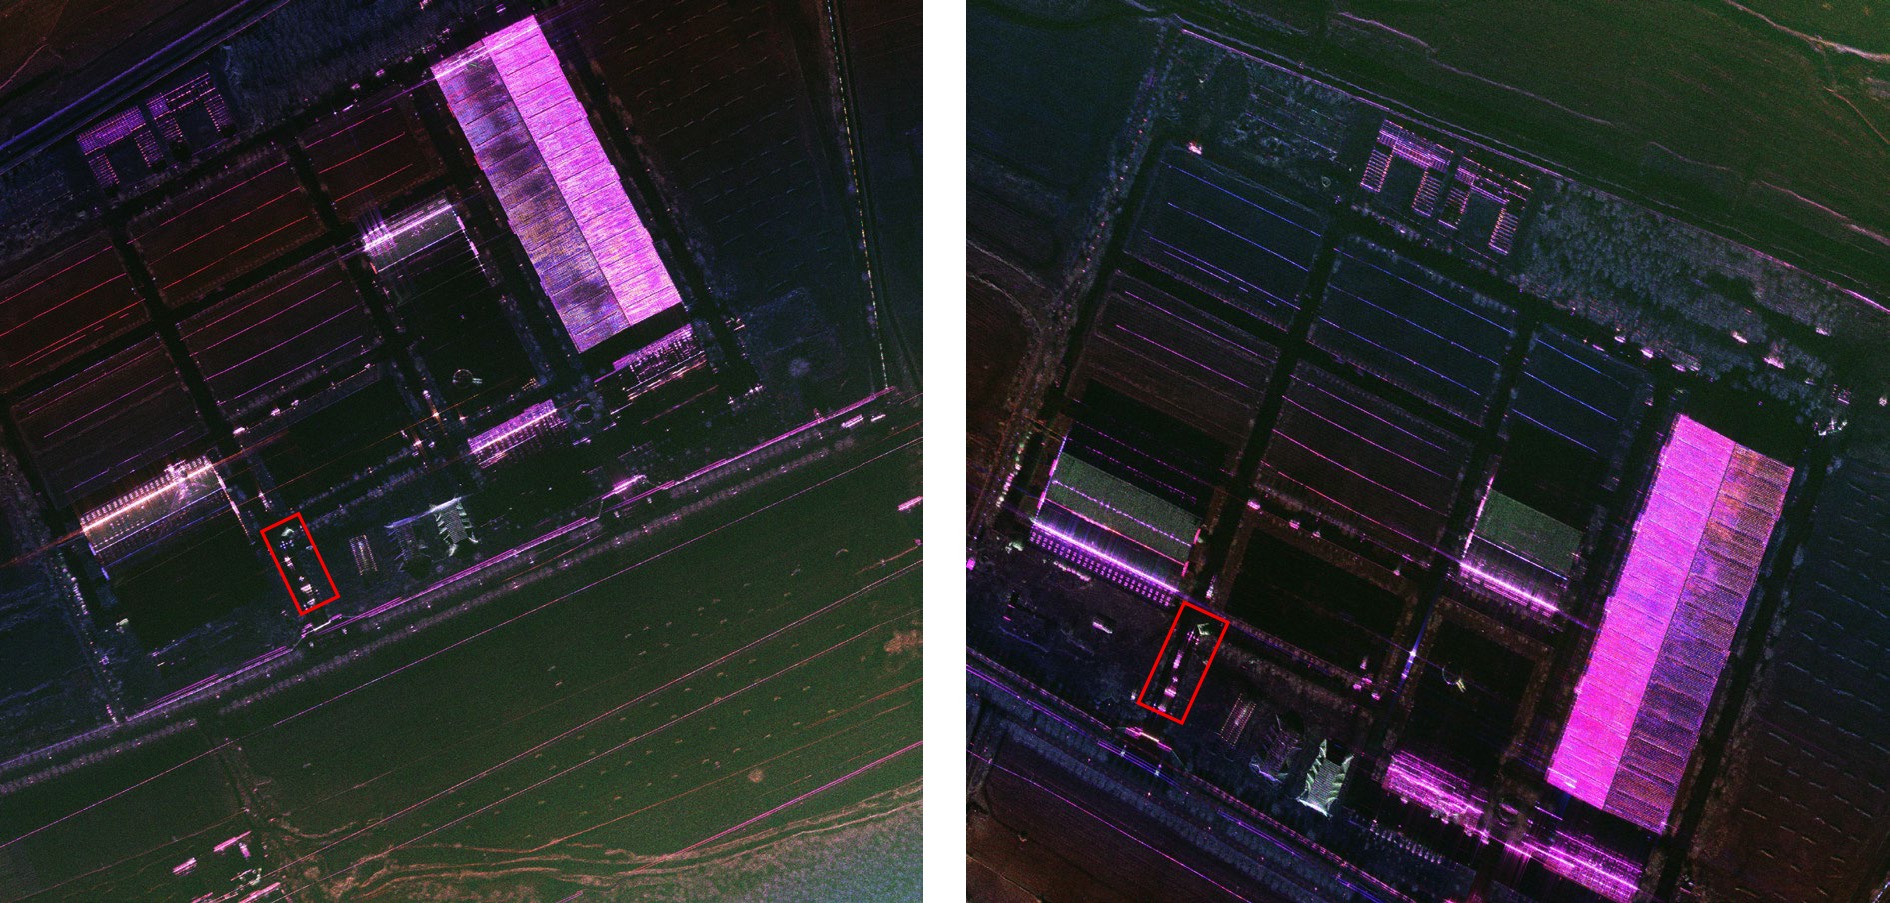
- Figure 7. Images of airborne experiments in Chengde, Hebei
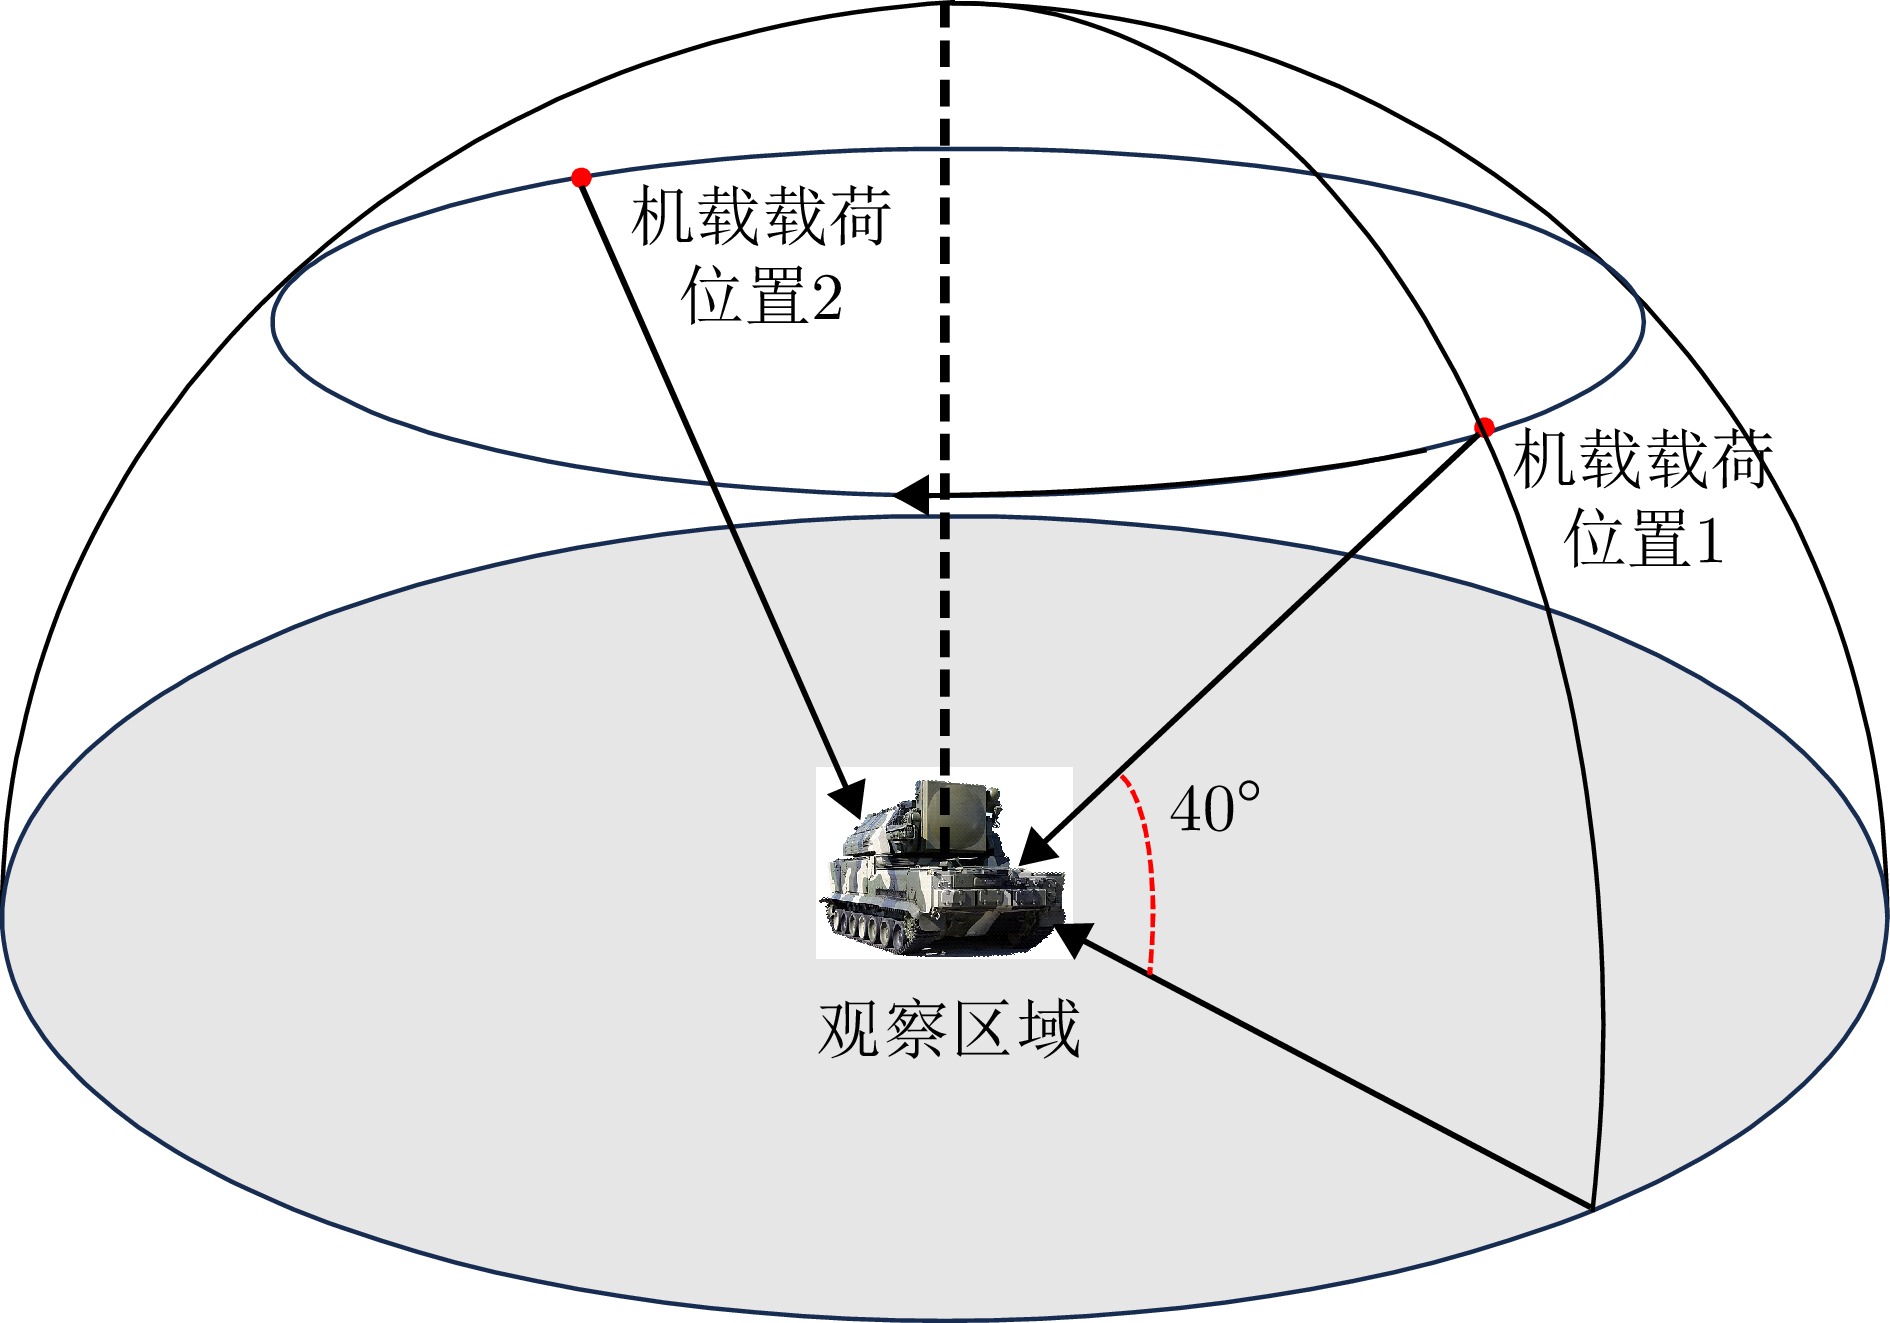
- Figure 8. Airborne data acquisition diagram
- Figure 9. Optical picture and placement of angular inverse array
- Figure 10. Angle counter array and vehicle target
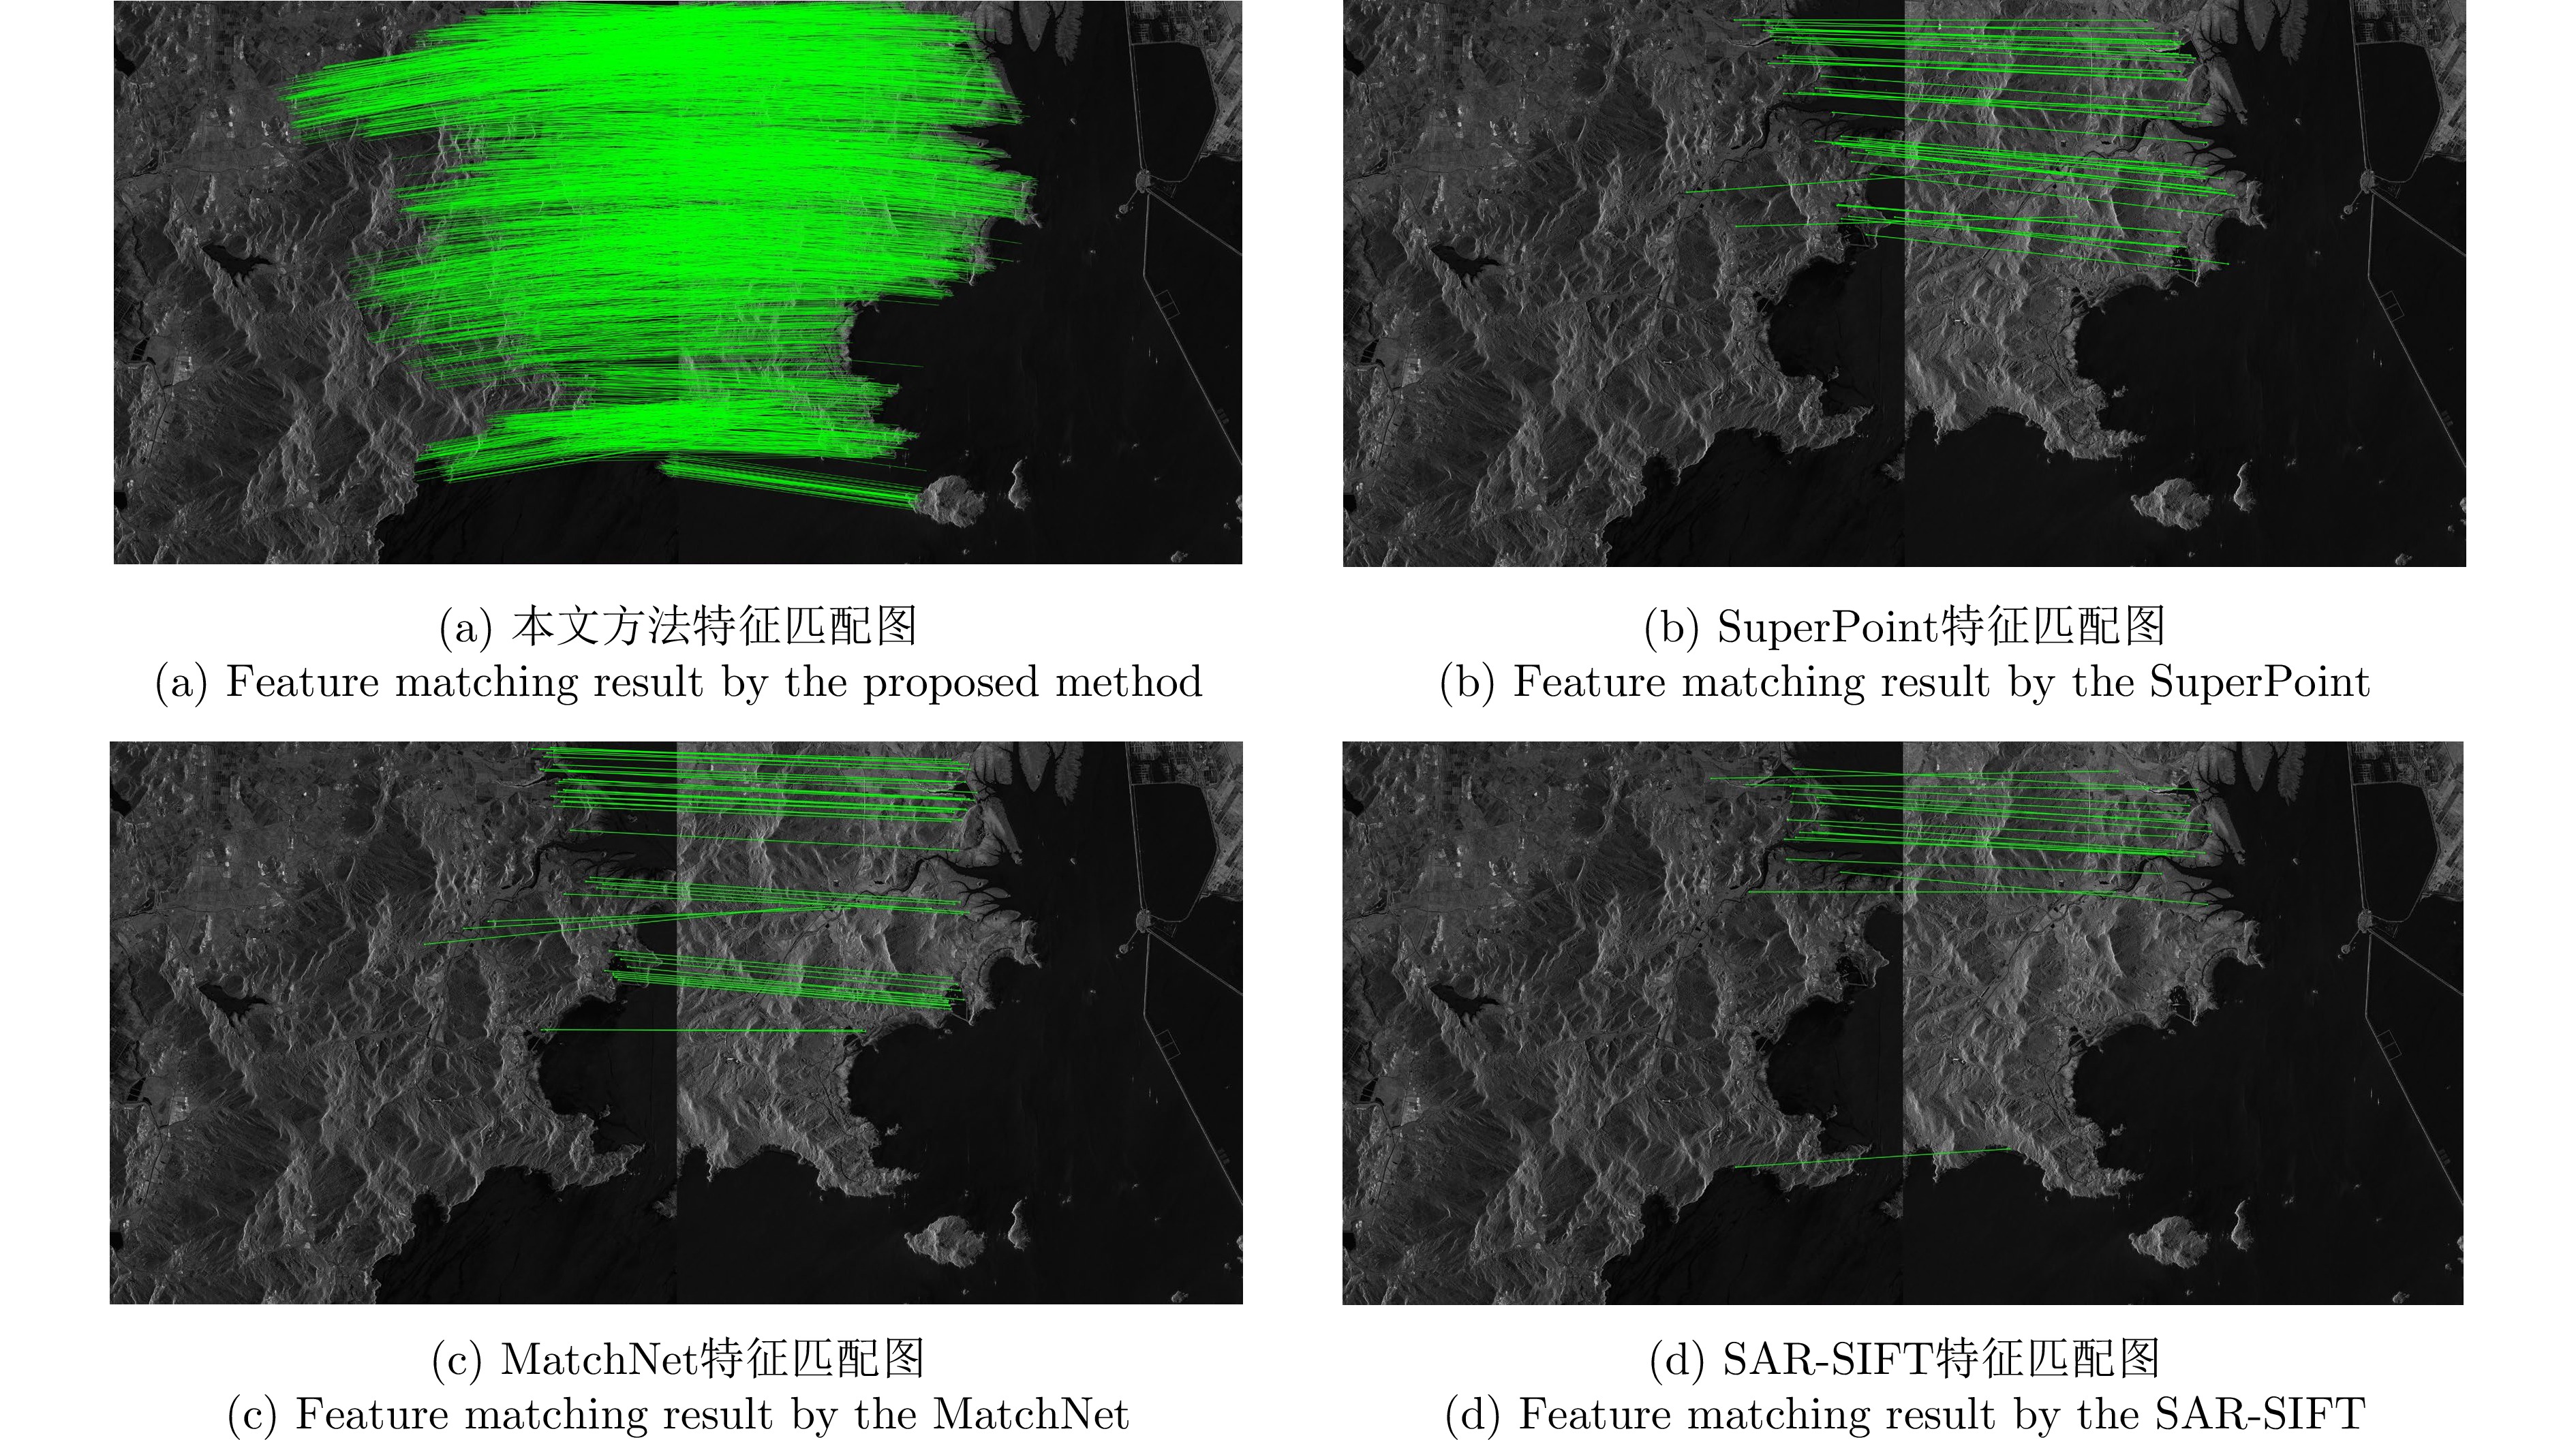
- Figure 11. The matching result of the spaceborne image pair in GF-3 scene A
- Figure 12. The matching result of the spaceborne image pair in GF-3 scene B
- Figure 13. The matching result of the spaceborne image pair in GF-3 scene C
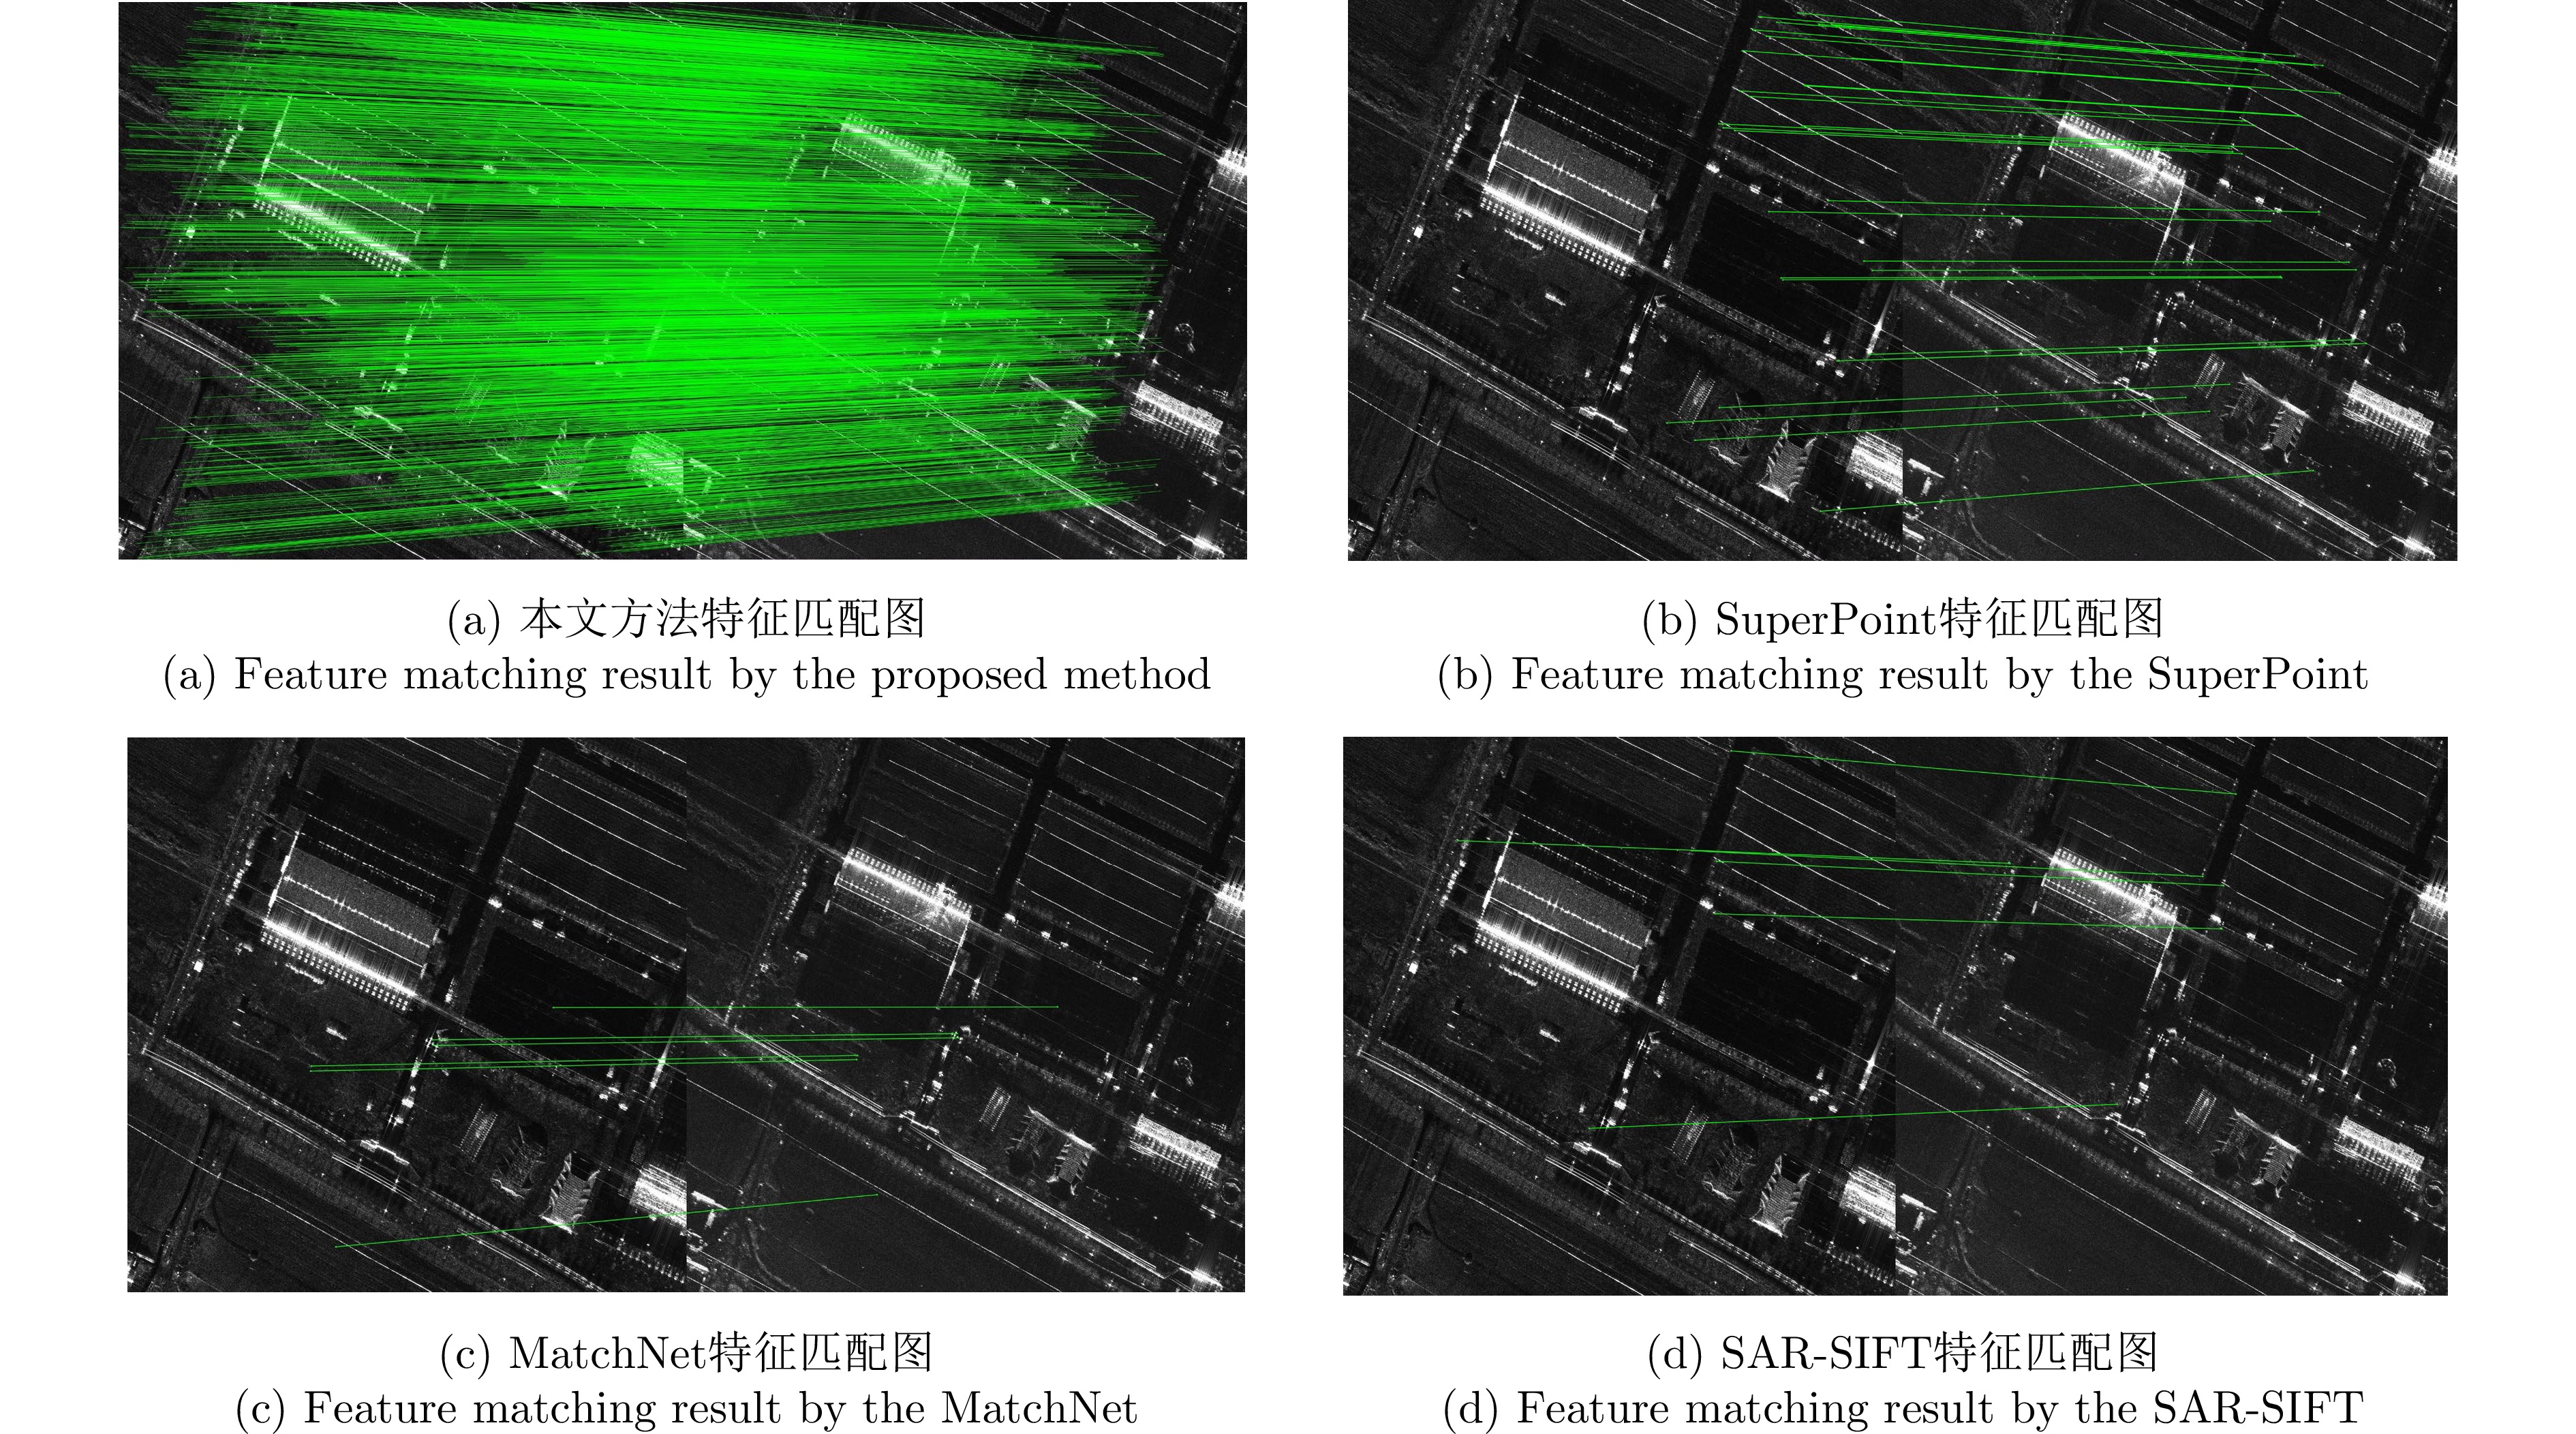
- Figure 14. The matching result of the airborne image pair in Chengde
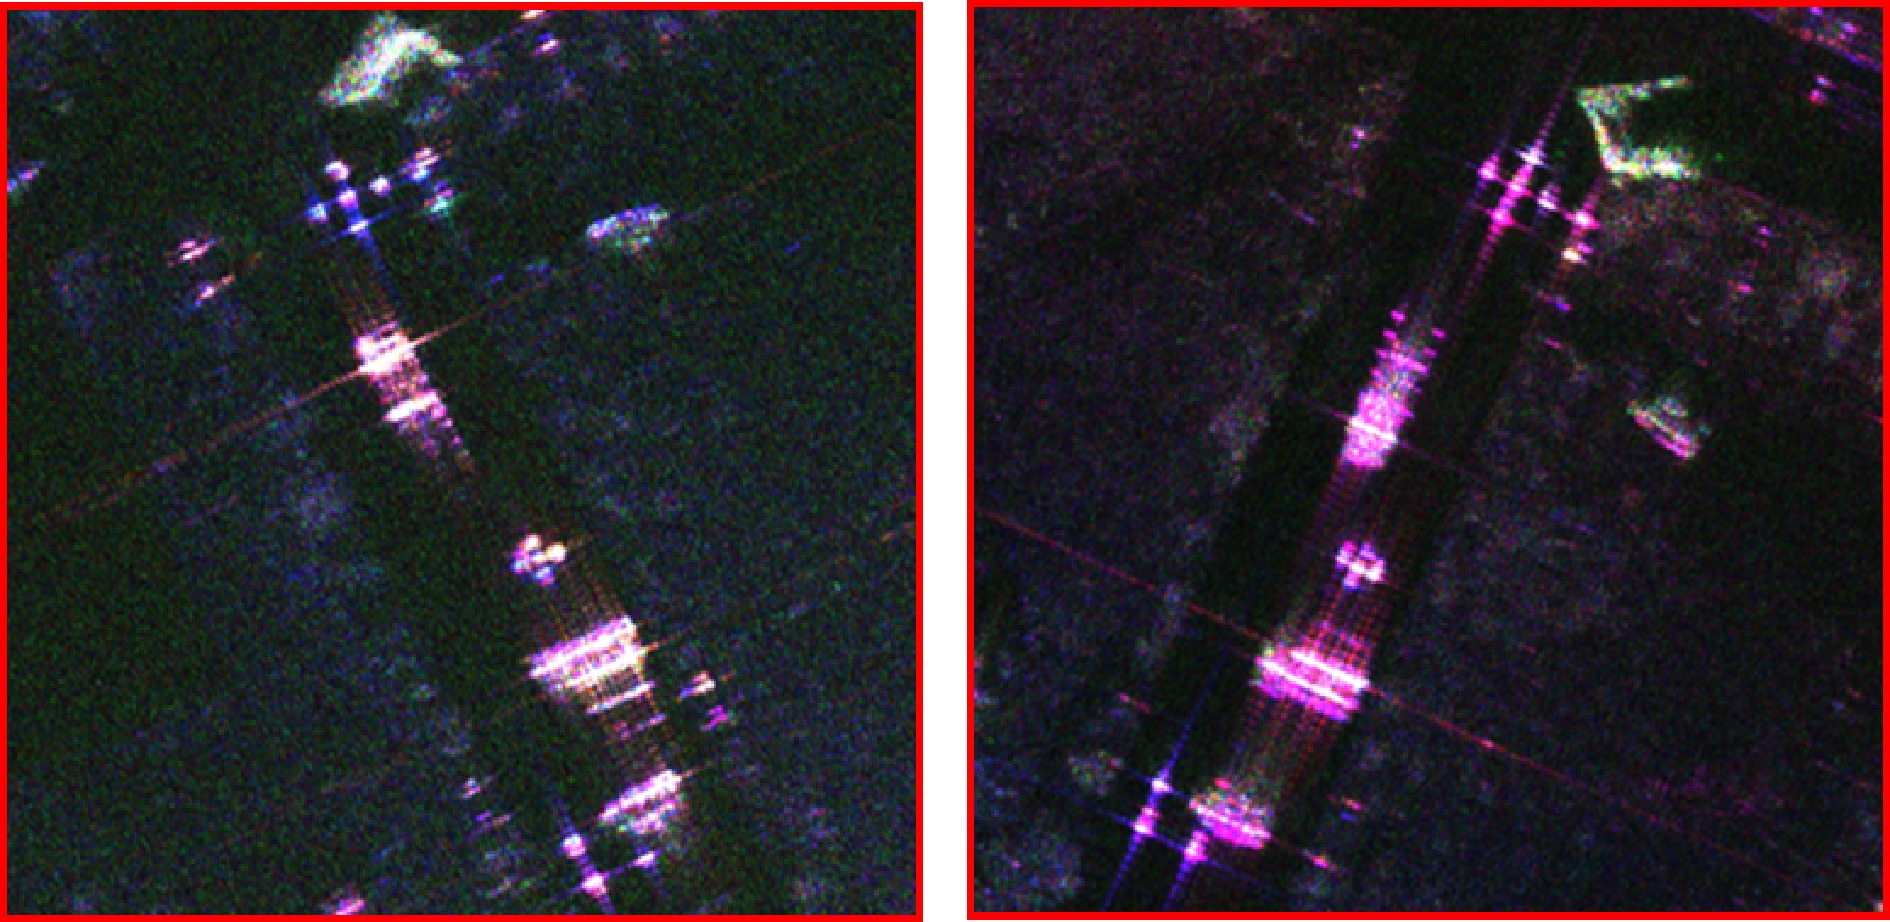
- Figure 15. False-color fusion results after registration of Chengde airborne images
- Figure 16. The result of false-color fusion after image pair registration in scene C of GF-3
- Figure 17. Image pairs to be registered
- Figure 18. The image to be registered is matched with the registration result
- Figure 19. Registered results of proposed method
- Figure 20. Rotate the image against the registered quantization index (ME) line chart


 Submit Manuscript
 Peer Review
 Editor Work



 下载:
下载:













 DownLoad:
