
 Submit Manuscript
 Peer Review
 Editor Work
- Home
- Articles & Issues
-
Data
- Dataset of Radar Detecting Sea
- SAR Dataset
- SARGroundObjectsTypes
- SARMV3D
- AIRSAT Constellation SAR Land Cover Classification Dataset
- 3DRIED
- UWB-HA4D
- LLS-LFMCWR
- FAIR-CSAR
- MSAR
- SDD-SAR
- FUSAR
- SpaceborneSAR3Dimaging
- Sea-land Segmentation
- SAR Multi-domain Ship Detection Dataset
- SAR-Airport
- Hilly and mountainous farmland time-series SAR and ground quadrat dataset
- SAR images for interference detection and suppression
- HP-SAR Evaluation & Analytical Dataset
- GDHuiYan-ATRNet
- Multi-System Maritime Low Observable Target Dataset
- DatasetinthePaper
- DatasetintheCompetition
- Report
- Course
- About
- Publish
- Editorial Board
- Chinese
| Citation: | WU Yun, ZHANG Dongheng, ZHANG Ganlin, et al. WiFi-based respiration detection aided by intelligent reflecting surfaces[J]. Journal of Radars, 2025, 14(1): 189–203. doi: 10.12000/JR24105

|
WiFi-based Respiration Detection Aided by Intelligent Reflecting Surfaces
DOI: 10.12000/JR24105 CSTR: 32380.14.JR24105
More Information-
Abstract
Since 2010, the utilization of commercial WiFi devices for contact-free respiration monitoring has garnered significant attention. However, existing WiFi-based respiration detection methods are susceptible to constraints imposed by hardware limitations and require the person to directly face the WiFi device. Specifically, signal reflection from the thoracic cavity diminishes when the body is oriented sideways or with the back toward the device, leading to complexities in respiratory monitoring. To mitigate these hardware-associated limitations and enhance robustness, we leveraged the signal-amplifying potential of Intelligent Reflecting Surfaces (IRS) to establish a high-precision respiration detection system. This system capitalizes on IRS technology to manipulate signal propagation within the environment to enhance signal reflection from the body, finally achieving posture-resilient respiratory monitoring. Furthermore, the system can be easily deployed without the prior knowledge of antenna placement or environmental intricacies. Compared with conventional techniques, our experimental results validate that this system markedly enhances respiratory monitoring across various postural configurations in indoor environments. -

-
References
[1] 方震, 简璞, 张浩, 等. 基于FMCW雷达的非接触式医疗健康监测技术综述[J]. 雷达学报, 2022, 11(3): 499–516. doi: 10.12000/JR22019.FANG Zhen, JIAN Pu, ZHANG Hao, et al. Review of noncontact medical and health monitoring technologies based on FMCW radar[J]. Journal of Radars, 2022, 11(3): 499–516. doi: 10.12000/JR22019.[2] HUFF A, KARLEN-AMARANTE M, PITTS T, et al. Optogenetic stimulation of pre-Bötzinger complex reveals novel circuit interactions in swallowing-breathing coordination[J]. Proceedings of the National Academy of Sciences of the United States of America, 2022, 119(29): e2121095119. doi: 10.1073/pnas.2121095119.[3] MEHRA R, CHUNG M K, OLSHANSKY B, et al. Sleep-disordered breathing and cardiac arrhythmias in adults: Mechanistic insights and clinical implications: A scientific statement from the American Heart Association[J]. Circulation, 2022, 146(9): e119–e136. doi: 10.1161/CIR.0000000000001082.[4] VAN RUITEN C C, SMITS M M, KOK M D, et al. Mechanisms underlying the blood pressure lowering effects of dapagliflozin, exenatide, and their combination in people with type 2 diabetes: A secondary analysis of a randomized trial[J]. Cardiovascular Diabetology, 2022, 21(1): 63. doi: 10.1186/S12933-022-01492-X.[5] LIN Yunan, NOBLE E, LOH C H, et al. Respiration monitoring using a motion tape chest band and portable wireless sensing node[J]. Journal of Commercial Biotechnology, 2022, 27(1). doi: 10.5912/jcb1026.[6] LI Chengyu, XU Zijie, XU Shuxing, et al. Miniaturized retractable thin-film sensor for wearable multifunctional respiratory monitoring[J]. Nano Research, 2023, 16(9): 11846–11854. doi: 10.1007/s12274-023-5420-1.[7] MOLINARO N, SCHENA E, SILVESTRI S, et al. Multi-roi spectral approach for the continuous remote cardio-respiratory monitoring from mobile device built-in cameras[J]. Sensors, 2022, 22(7): 2539. doi: 10.3390/s22072539.[8] WANG Haowen, HUANG Jia, WANG Guowei, et al. Surveillance camera-based cardio-respiratory monitoring for critical patients in icu[C]. 2022 IEEE-EMBS International Conference on Biomedical and Health Informatics (BHI), Ioannina, Greece, 2022: 1–4. doi: 10.1109/BHI56158.2022.9926954.[9] LIM C, KIM J, KIM J, et al. Estimation of respiratory rate in various environments using microphones embedded in face masks[J]. The Journal of Supercomputing, 2022, 78(17): 19228–19245. doi: 10.1007/s11227-022-04622-0.[10] GONG Hanqin, ZHANG Dongheng, CHEN Jinbo, et al. Enabling orientation-free mmwave-based vital sign sensing with multi-domain signal analysis[C]. IEEE International Conference on Acoustics, Speech and Signal Processing (ICASSP), Seoul, Korea, 2024: 8751–8755. doi: 10.1109/ICASSP48485.2024.10448323.[11] ZHAI Qian, HAN Xiangyu, HAN Yi, et al. A contactless on-bed radar system for human respiration monitoring[J]. IEEE Transactions on Instrumentation and Measurement, 2022, 71: 4004210. doi: 10.1109/TIM.2022.3164145.[12] KREJ M, BARAN P, and DZIUDA Ł. Detection of respiratory rate using a classifier of waves in the signal from a FBG-based vital signs sensor[J]. Computer Methods and Programs in Biomedicine, 2019, 177: 31–38. doi: 10.1016/j.cmpb.2019.05.014.[13] JANUSZ M, ROUDJANE M, MANTOVANI D, et al. Detecting respiratory rate using flexible multimaterial fiber electrodes designed for a wearable garment[J]. IEEE Sensors Journal, 2022, 22(13): 13552–13561. doi: 10.1109/JSEN.2022.3175645.[14] XIE Xuecheng, ZHANG Dongheng, LI Yadong, et al. Robust WiFi respiration sensing in the presence of interfering individual[J]. IEEE Transactions on Mobile Computing, 2024, 23(8): 8447–8462. doi: 10.1109/TMC.2023.3348879.[15] ZHANG Binbin, ZHANG Dongheng, LI Yadong, et al. Unsupervised domain adaptation for RF-based gesture recognition[J]. IEEE Internet of Things Journal, 2023, 10(23): 21026–21038. doi: 10.1109/JIOT.2023.3284496.[16] HE Ying, CHEN Yan, HU Yang, et al. WiFi vision: Sensing, recognition, and detection with commodity MIMO-OFDM WiFi[J]. IEEE Internet of Things Journal, 2020, 7(9): 8296–8317. doi: 10.1109/JIOT.2020.2989426.[17] WANG Xuyu, YANG Chao, and MAO Shiwen. PhaseBeat: Exploiting CSI phase data for vital sign monitoring with commodity WiFi devices[C]. 2017 IEEE 37th International Conference on Distributed Computing Systems (ICDCS), Atlanta, USA, 2017: 1230–1239. doi: 10.1109/ICDCS.2017.206.[18] ZHANG Dongheng, HU Yang, CHEN Yan, et al. BreathTrack: Tracking indoor human breath status via commodity WiFi[J]. IEEE Internet of Things Journal, 2019, 6(2): 3899–3911. doi: 10.1109/JIOT.2019.2893330.[19] WANG W H, ZENG Xaolu, WANG Beibei, et al. Improved wifi-based respiration tracking via contrast enhancement[C]. IEEE International Conference on Acoustics, Speech and Signal Processing (ICASSP), Rhodes Island, Greece, 2023: 1–2. doi: 10.1109/ICASSP49357.2023.10094823.[20] ZENG Youwei, WU Dan, XIONG Jie, et al. FarSense: Pushing the range limit of WiFi-based respiration sensing with CSI ratio of two antennas[J]. Proceedings of the ACM on Interactive, Mobile, Wearable and Ubiquitous Technologies, 2019, 3(3): 121. doi: 10.1145/3351279.[21] 李廉林, 崔铁军. 智能电磁感知的若干进展[J]. 雷达学报, 2021, 10(2): 183–190. doi: 10.12000/JR21049.LI Lianlin and CUI Tiejun. Recent progress in intelligent electromagnetic sensing[J]. Journal of Radars, 2021, 10(2): 183–190. doi: 10.12000/JR21049.[22] ZHANG Ganlin, ZHANG Dongheng, HE Ying, et al. Multi-person passive WiFi indoor localization with intelligent reflecting surface[J]. IEEE Transactions on Wireless Communications, 2023, 22(10): 6534–6546. doi: 10.1109/TWC.2023.3244369.[23] 田团伟, 邓浩, 鲁建华, 等. 智能反射面辅助雷达通信双功能系统的多载波波形优化方法[J]. 雷达学报, 2022, 11(2): 240–254. doi: 10.12000/JR21138.TIAN Tuanwei, DENG Hao, LU Jianhua, et al. Multicarrier waveform optimization method for an intelligent reflecting surface-assisted dual-function radar-communication system[J]. Journal of Radars, 2022, 11(2): 240–254. doi: 10.12000/JR21138.[24] ZHANG Lei, CHEN Xiaoqing, LIU Shuo, et al. Space-time-coding digital metasurfaces[J]. Nature Communications, 2018, 9(1): 4334. doi: 10.1038/s41467-018-06802-0.[25] HE Ying, ZHANG Dongheng, and CHEN Yan. High-resolution wifi imaging with reconfigurable intelligent surfaces[J]. IEEE Internet of Things Journal, 2023, 10(2): 1775–1786. doi: 10.1109/JIOT.2022.3210686.[26] 蒋卫祥, 田翰闱, 宋超, 等. 数字编码超表面: 迈向电磁功能的可编程与智能调控[J]. 雷达学报, 2022, 11(6): 1003–1019. doi: 10.12000/JR22167.JIANG Weixiang, TIAN Hanwei, SONG Chao, et al. Digital coding metasurfaces: Toward programmable and smart manipulations of electromagnetic functions[J]. Journal of Radars, 2022, 11(6): 1003–1019. doi: 10.12000/JR22167.[27] XIA Dexiao, GUAN Lei, LIU Haixia, et al. MetaBreath: Multitarget respiration detection based on space-time-coding digital metasurface[J]. IEEE Transactions on Microwave Theory and Techniques, 2024, 72(2): 1433–1443. doi: 10.1109/TMTT.2023.3297413.[28] LI Zhi, JIN Tian, GUAN Dongfang, et al. MetaPhys: Contactless physiological sensing of multiple subjects using RIS-based 4-D radar[J]. IEEE Internet of Things Journal, 2023, 10(14): 12616–12626. doi: 10.1109/JIOT.2023.3252587.[29] TEWES S, HEINRICHS M, KRONBERGER R, et al. IRS-enabled breath tracking with colocated commodity WiFi transceivers[J]. IEEE Internet of Things Journal, 2023, 10(8): 6870–6886. doi: 10.1109/JIOT.2022.3228158.[30] ZHANG Dongheng, HU Yang, CHEN Yan, et al. Calibrating phase offsets for commodity WiFi[J]. IEEE Systems Journal, 2020, 14(1): 661–664. doi: 10.1109/JSYST.2019.2904714.[31] CHEN Yan, SU Xiang, HU Yang, et al. Residual carrier frequency offset estimation and compensation for commodity WiFi[J]. IEEE Transactions on Mobile Computing, 2020, 19(12): 2891–2902. doi: 10.1109/TMC.2019.2934106.[32] CHEN Yan, DENG Hongyu, ZHANG Dongheng, et al. SpeedNet: Indoor speed estimation with radio signals[J]. IEEE Internet of Things Journal, 2021, 8(4): 2762–2774. doi: 10.1109/JIOT.2020.3022071.[33] HAN Yi, CHEN Yan, WANG Beibei, et al. Enabling heterogeneous connectivity in internet of things: A time-reversal approach[J]. IEEE Internet of Things Journal, 2016, 3(6): 1036–1047. doi: 10.1109/JIOT.2016.2548659.[34] XU Qinyi, CHEN Yan, WANG Beibei, et al. TRIEDS: Wireless events detection through the wall[J]. IEEE Internet of Things Journal, 2017, 4(3): 723–735. doi: 10.1109/JIOT.2017.2663318.[35] ZHANG Tianyu, ZHANG Dongheng, WANG Guanzhong, et al. RLoc: Towards robust indoor localization by quantifying uncertainty[J]. Proceedings of the ACM on Interactive, Mobile, Wearable and Ubiquitous Technologies, 2023, 7(4): 200. doi: 10.1145/3631437.[36] REA M, FAKHREDDINE A, GIUSTINIANO D, et al. Filtering noisy 802.11 time-of-flight ranging measurements from commoditized wifi radios[J]. IEEE/ACM Transactions on Networking, 2017, 25(4): 2514–2527. doi: 10.1109/TNET.2017.2700430.[37] XIE Yaxiong, XIONG Jie, LI Mo, et al. mD-track: Leveraging multi-dimensionality for passive indoor Wi-Fi tracking[C]. The 25th Annual International Conference on Mobile Computing and Networking, Los Cabos, Mexico, 2019: 8. doi: 10.1145/3300061.3300133.[38] YUE Shichao, HE Hao, WANG Hao, et al. Extracting multi-person respiration from entangled RF signals[J]. Proceedings of the ACM on Interactive, Mobile, Wearable and Ubiquitous Technologies, 2018, 2(2): 86. doi: 10.1145/3214289. -
Proportional views

- Publishing Ethics
- Journal Insights
- Abstracting & Indexing
- Peer Review Policies
- Guide for Authors
- Conference
- ISSN 2095-283X (Print)ISSN 2097-339X (Online)
- CN 10-1030/TN
- CODEN LXEUAO
About Journal
- Sponsor: China Radio Detection and Ranging Industry Association (CRIA)
- Phone: 010-58887062
- Email:radars@aircas.ac.cn
- Publisher: Leida Xuebao Bianjibu (Editorial office of the Journal of Radars)
Contacts Us

京ICP备20021838号-14
Supported by: Beijing Renhe Information Technology Co. Ltd

Export File
Citation
Format
Content
 DownLoad:


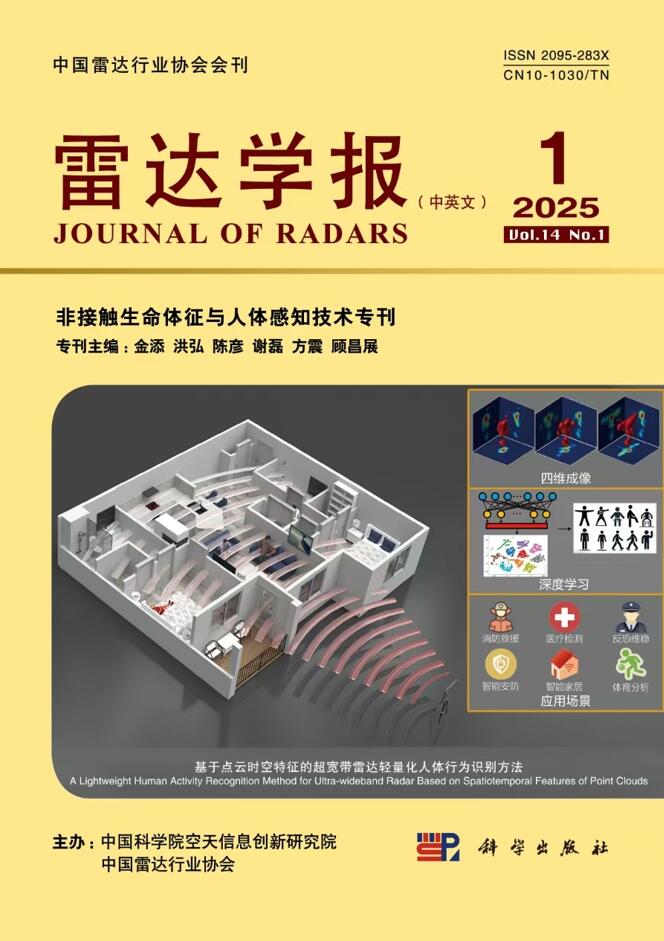
- Figure 1. Deployment scenario of an indoor respiration sensing system assisted by IRS
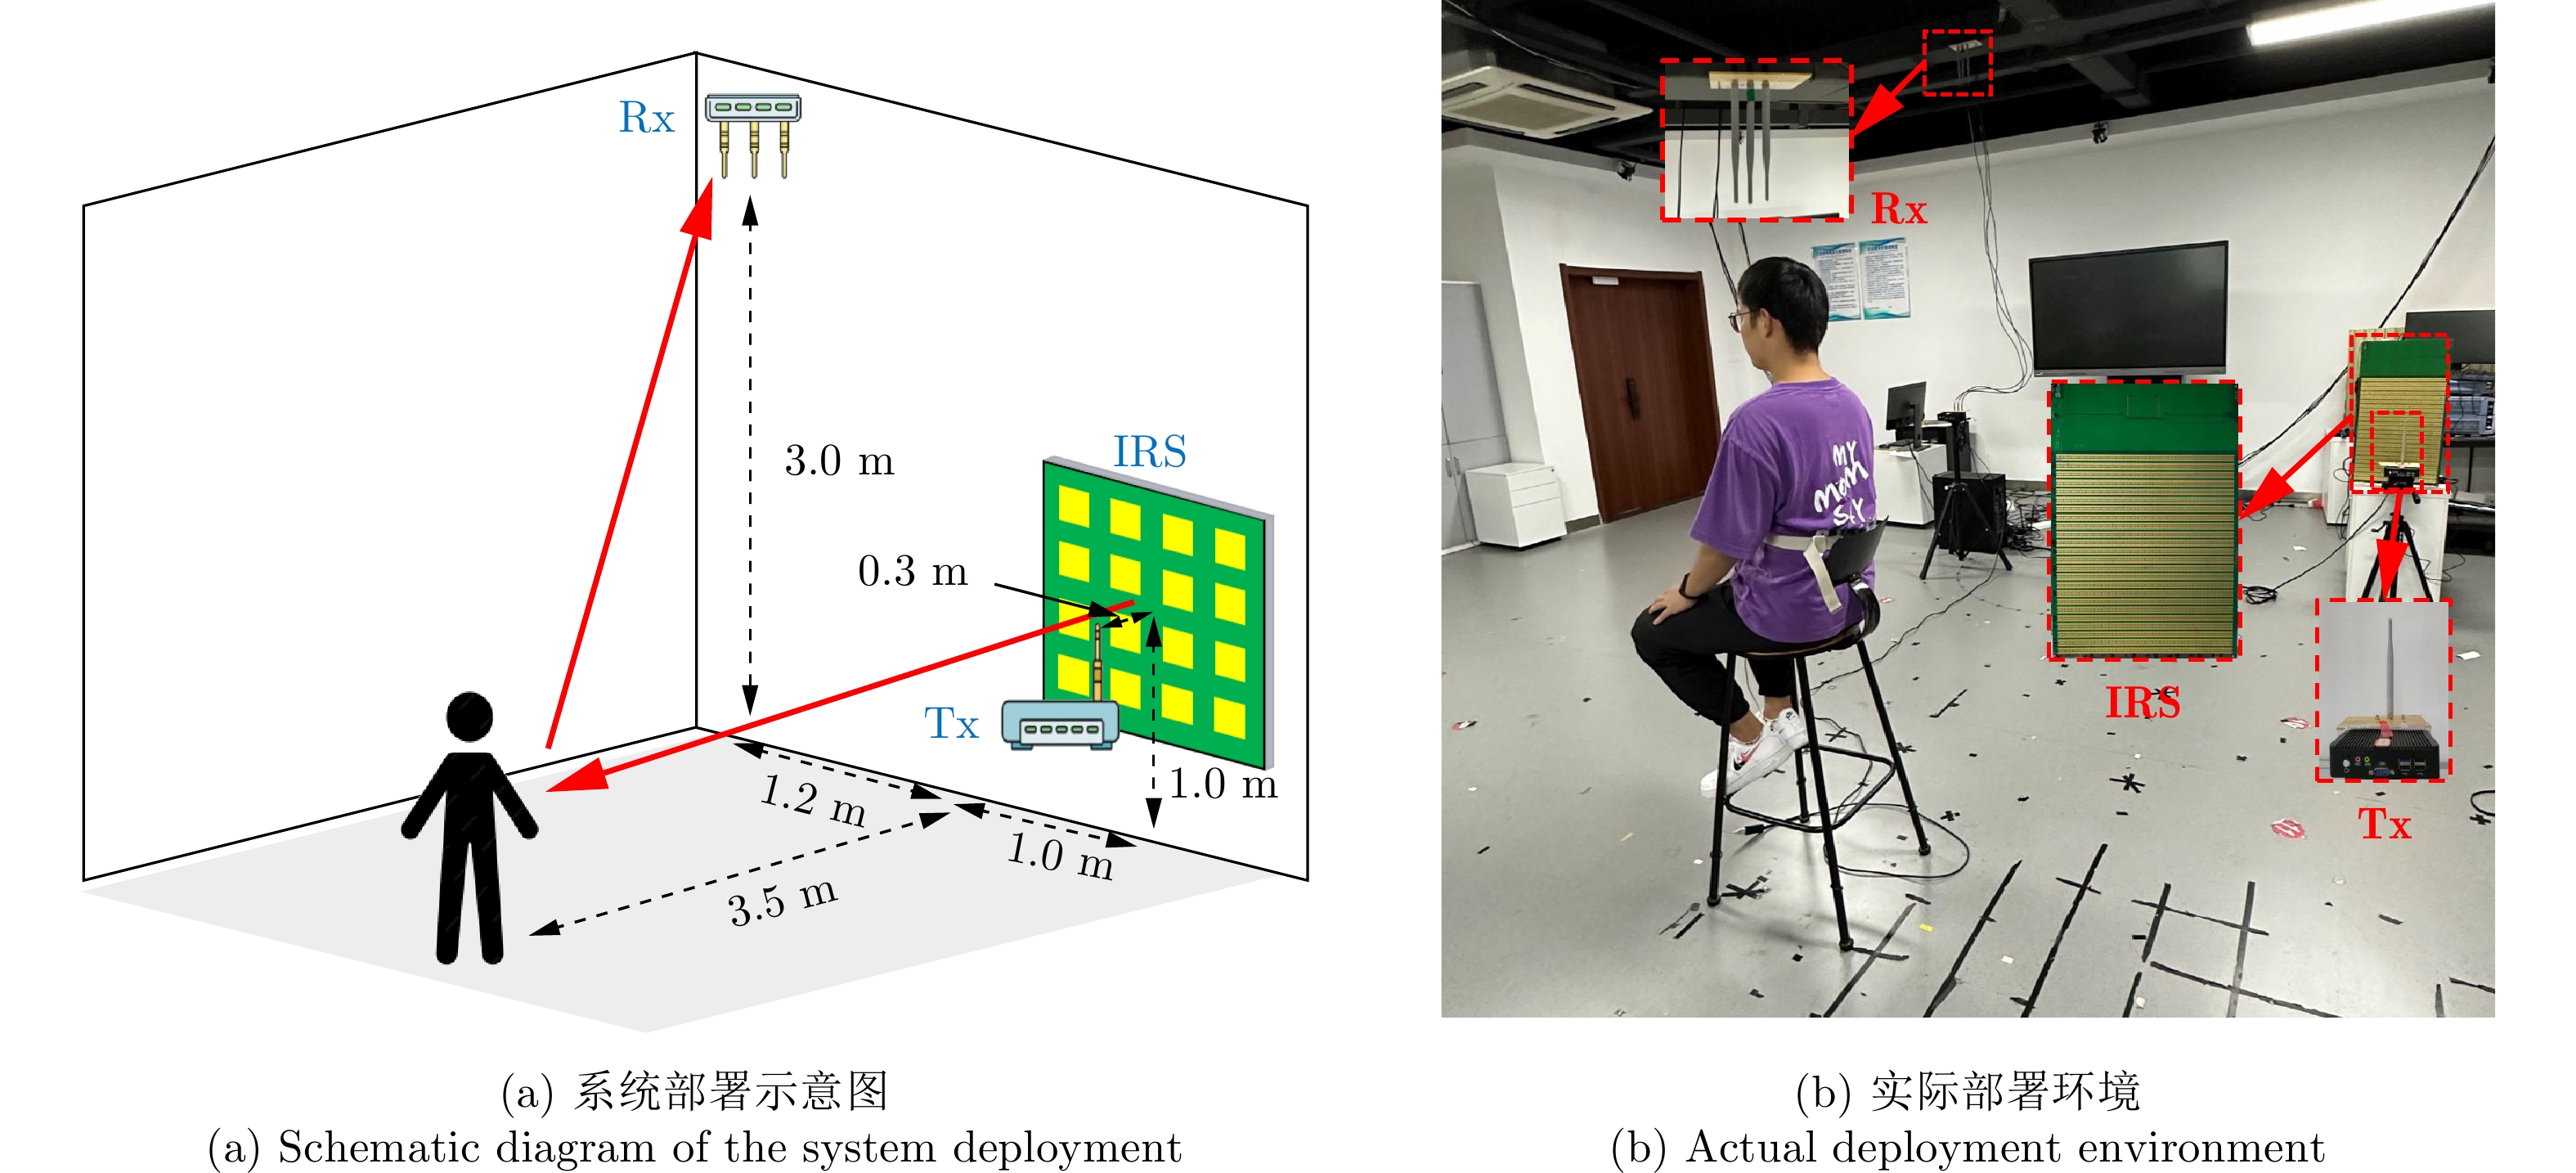
- Figure 2. Respiration signal propagation assisted by IRS
- Figure 3. Location map
- Figure 4. Differential diagrams of respiratory signals
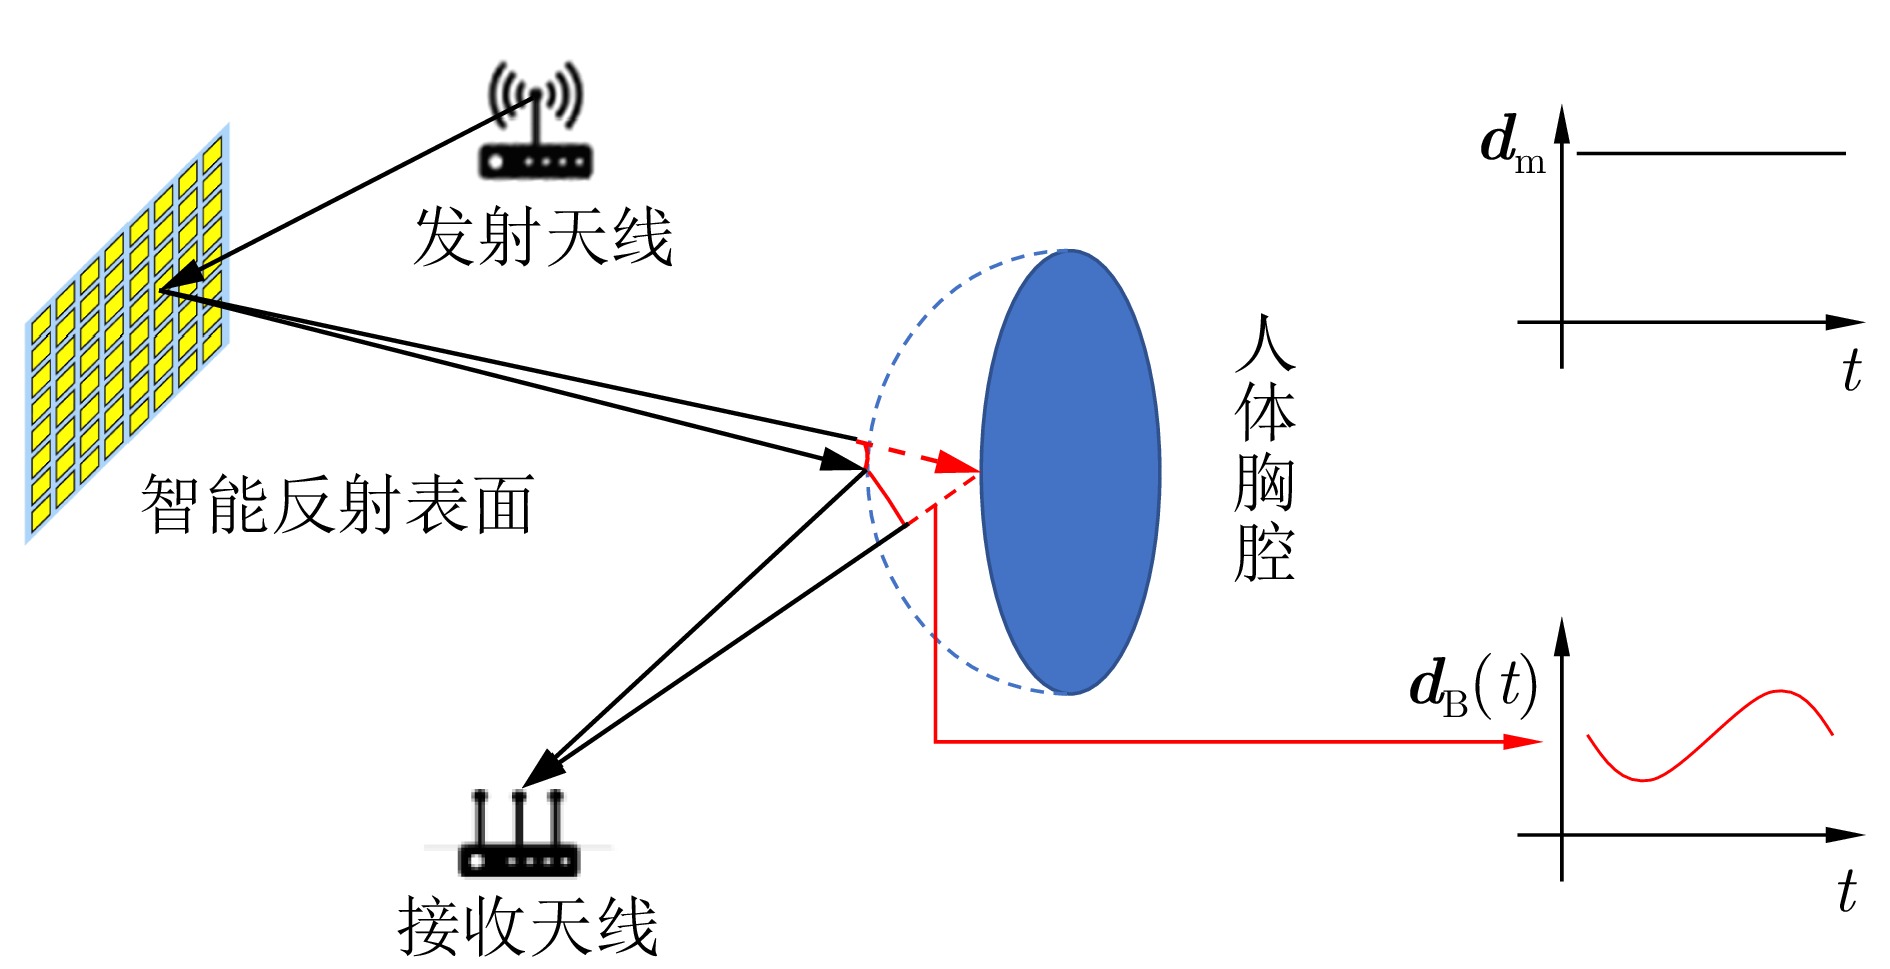
- Figure 5. We utilize time division to evaluate the codebooks (each color represents a codebook)
- Figure 6. Structure of the IRS element (unit: mm)
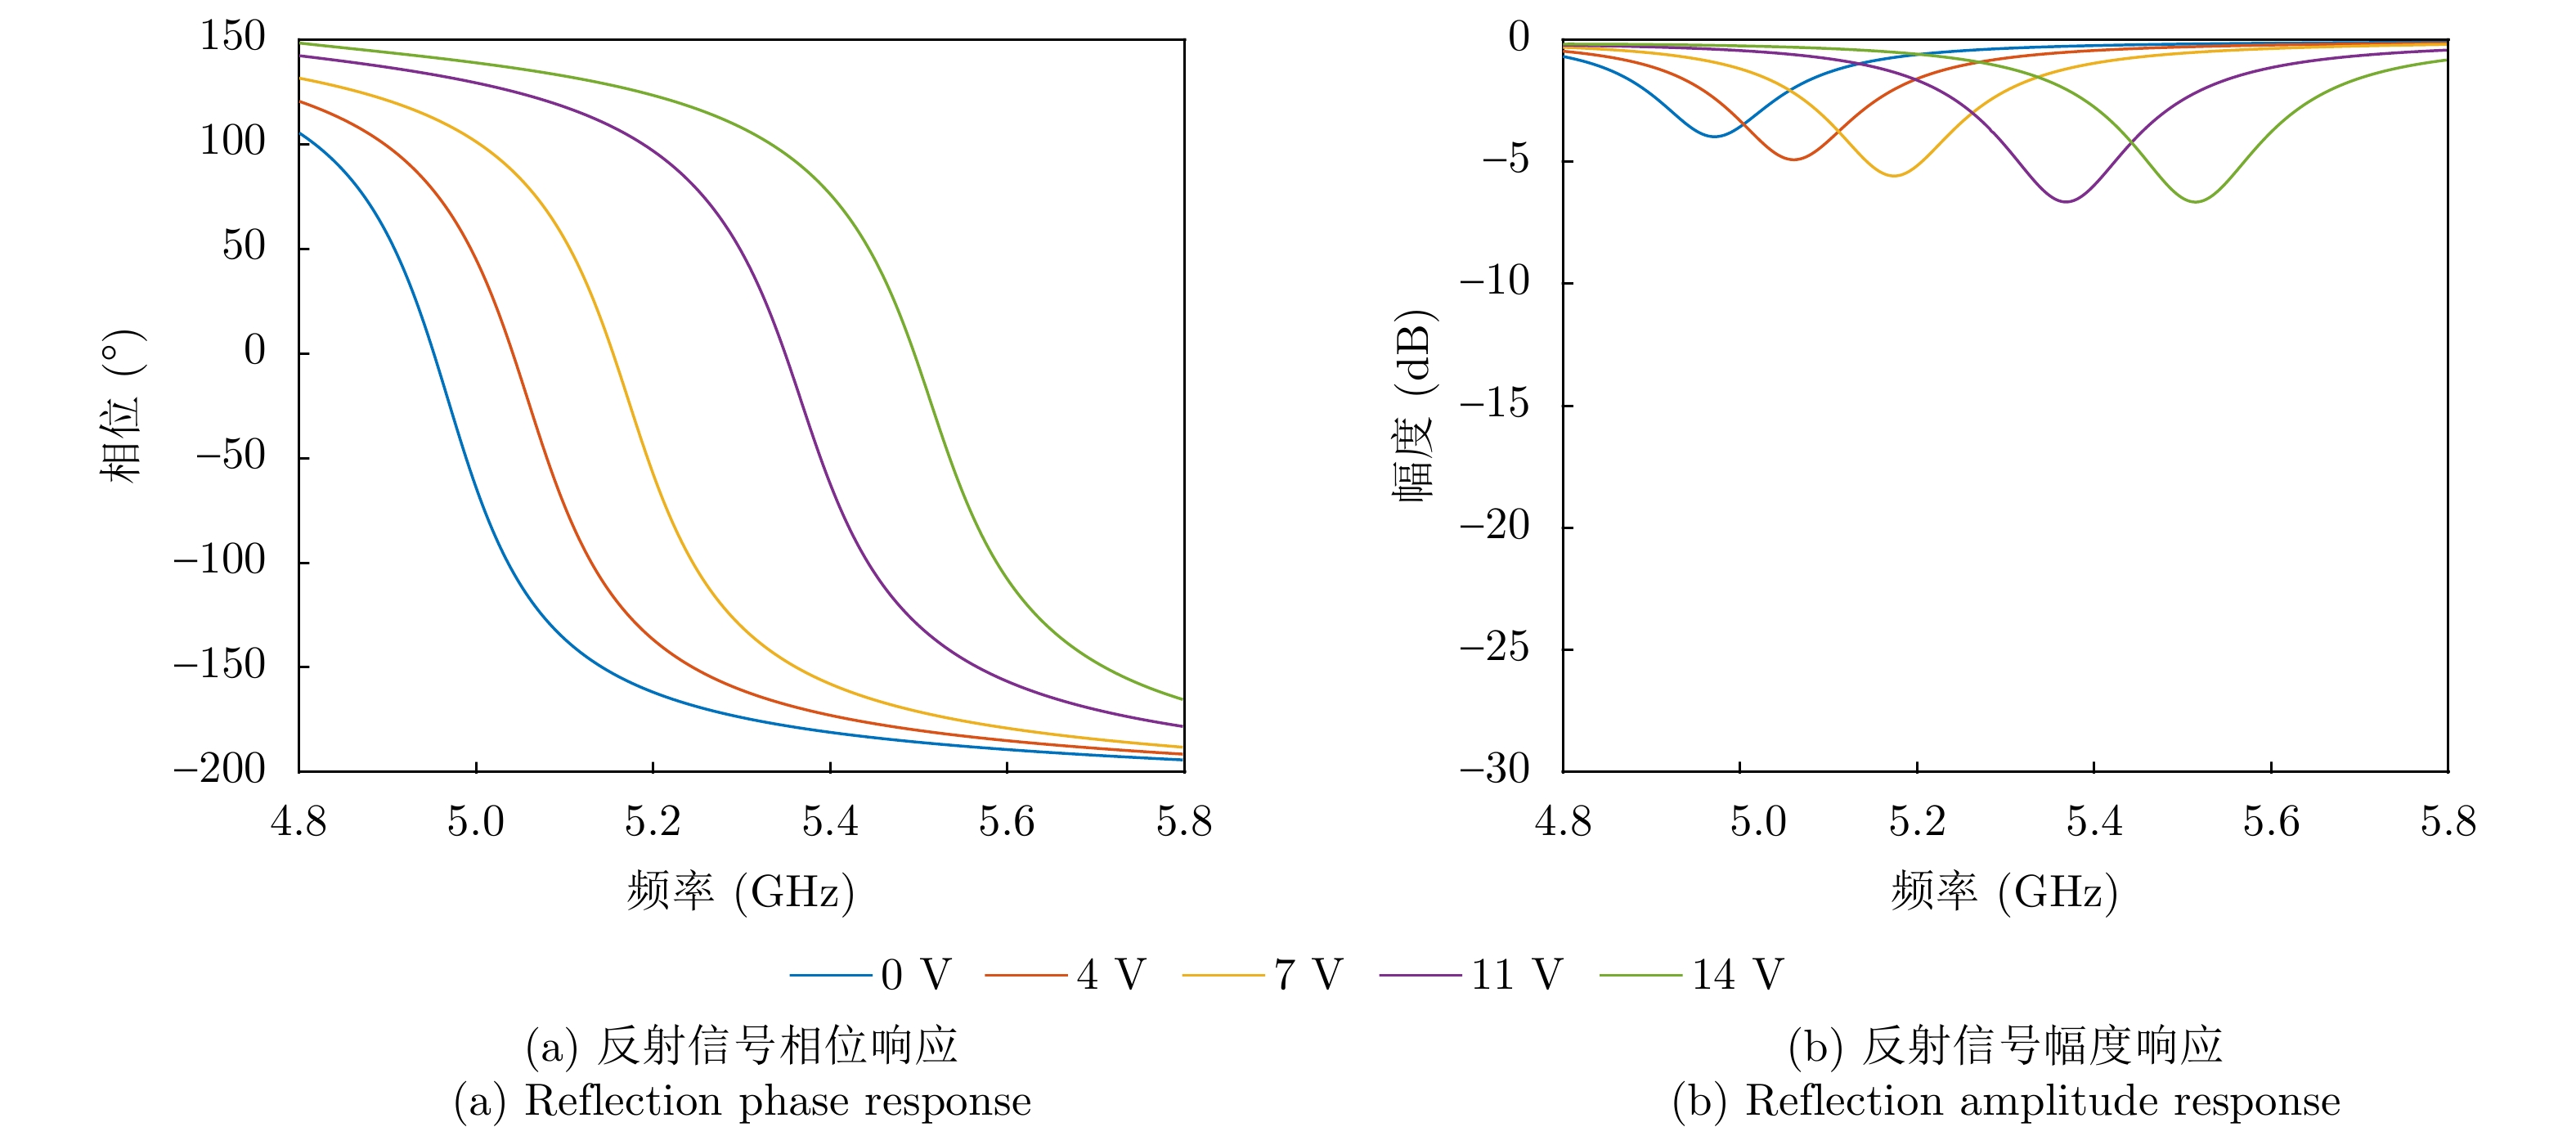
- Figure 7. Simulation results of IRS unit generated by CST
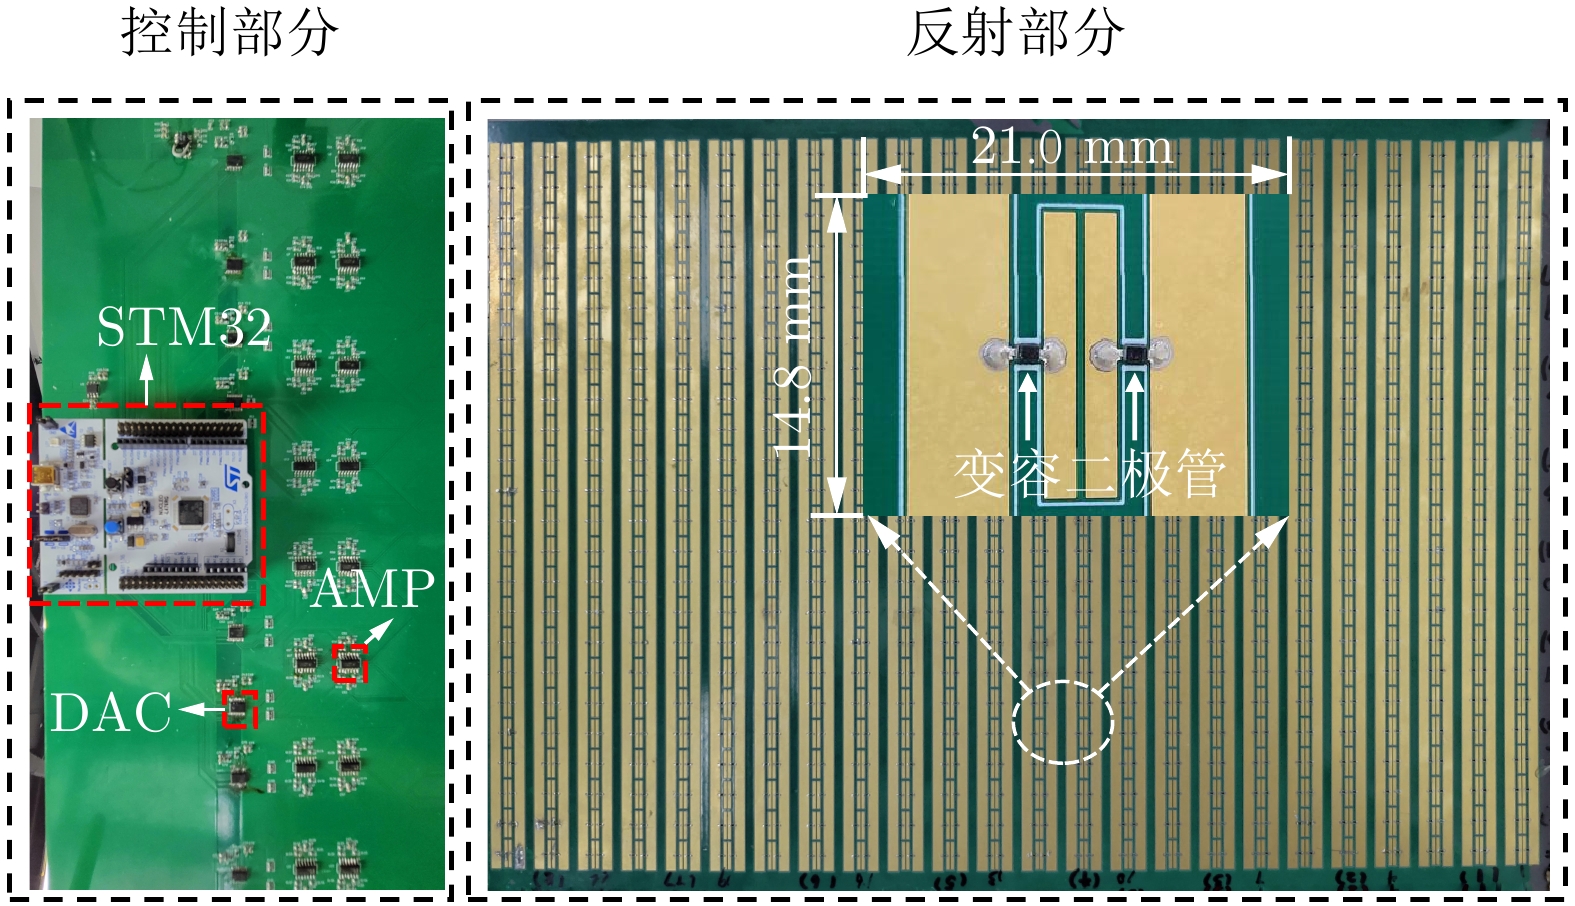
- Figure 8. The prototype of IRS
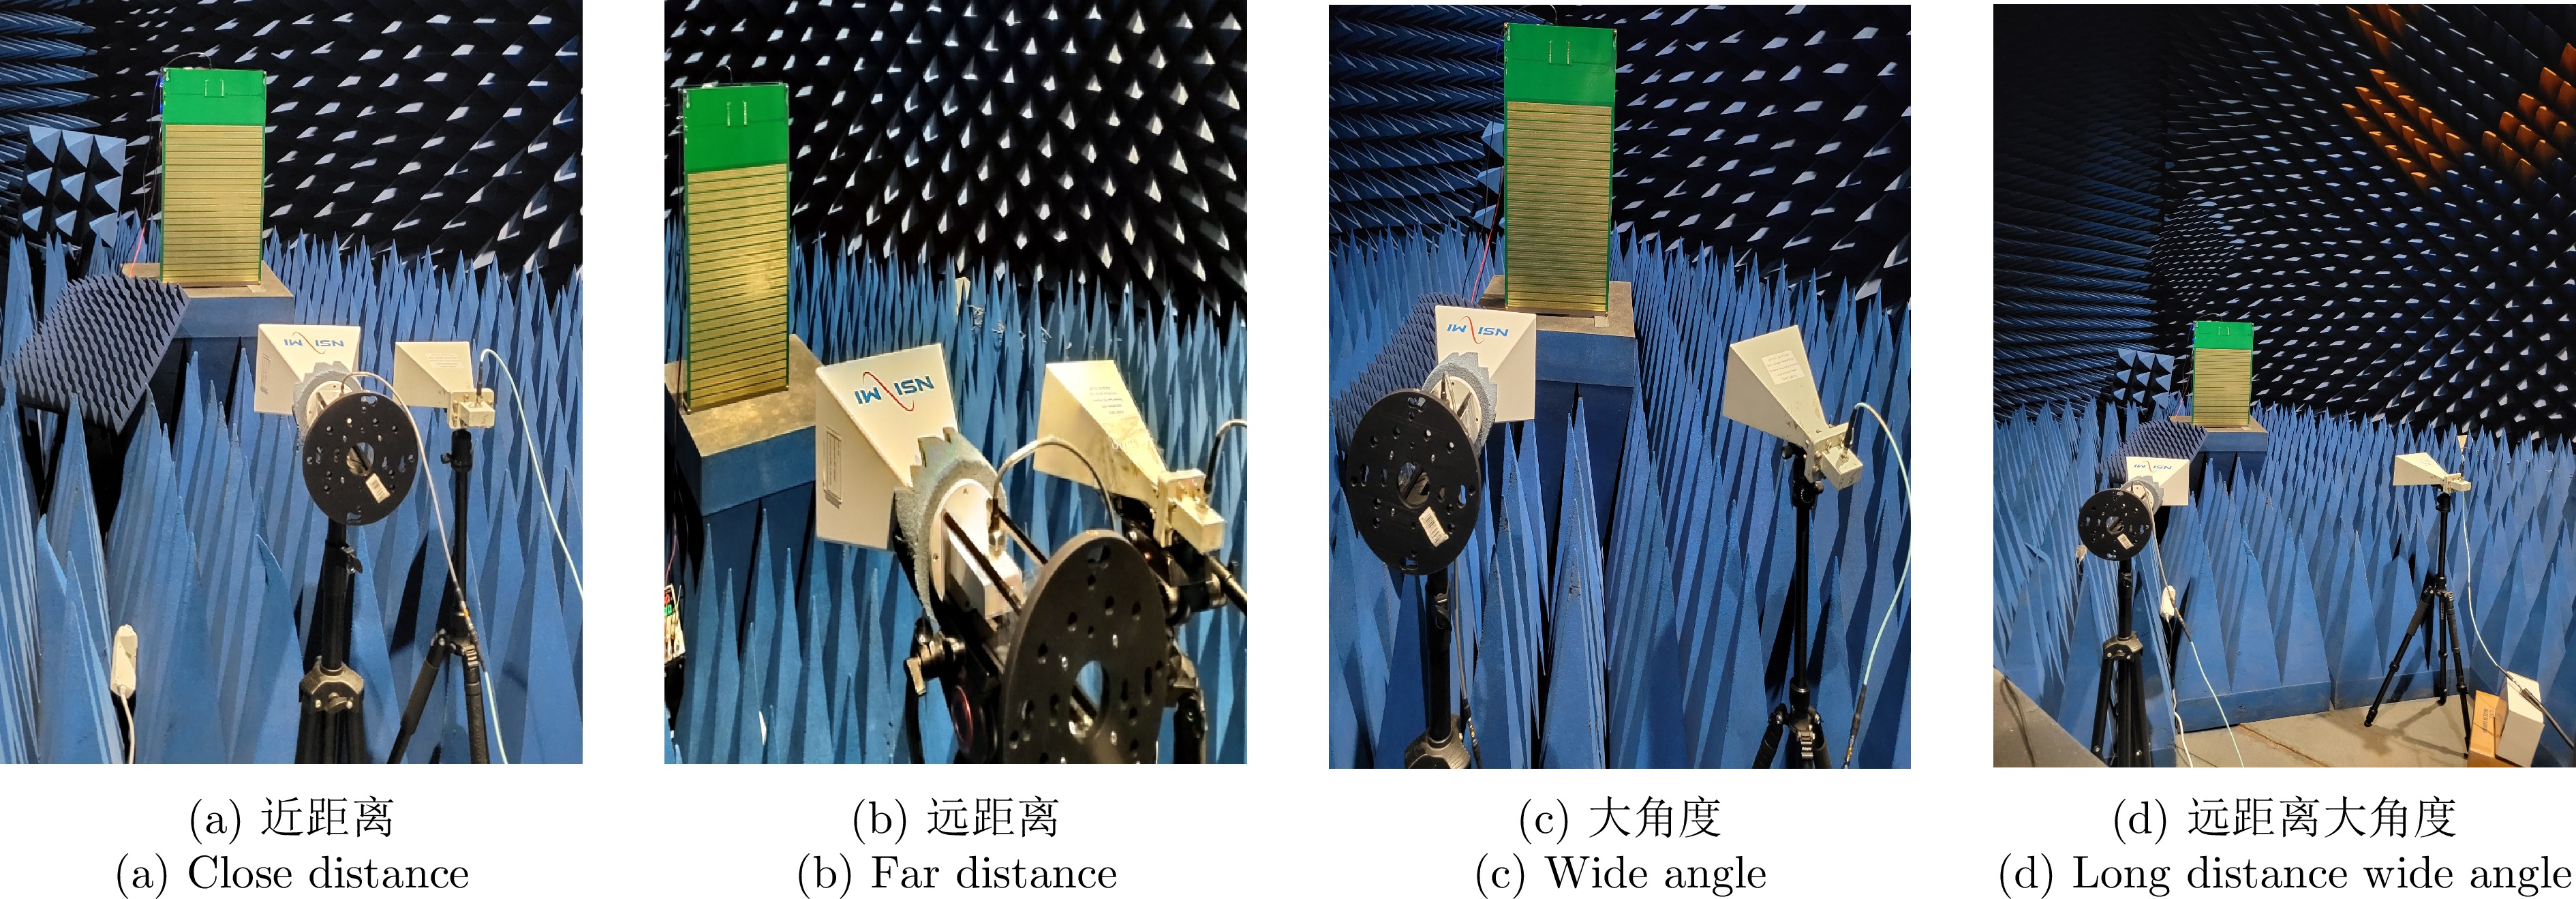
- Figure 9. Darkroom test scenarios
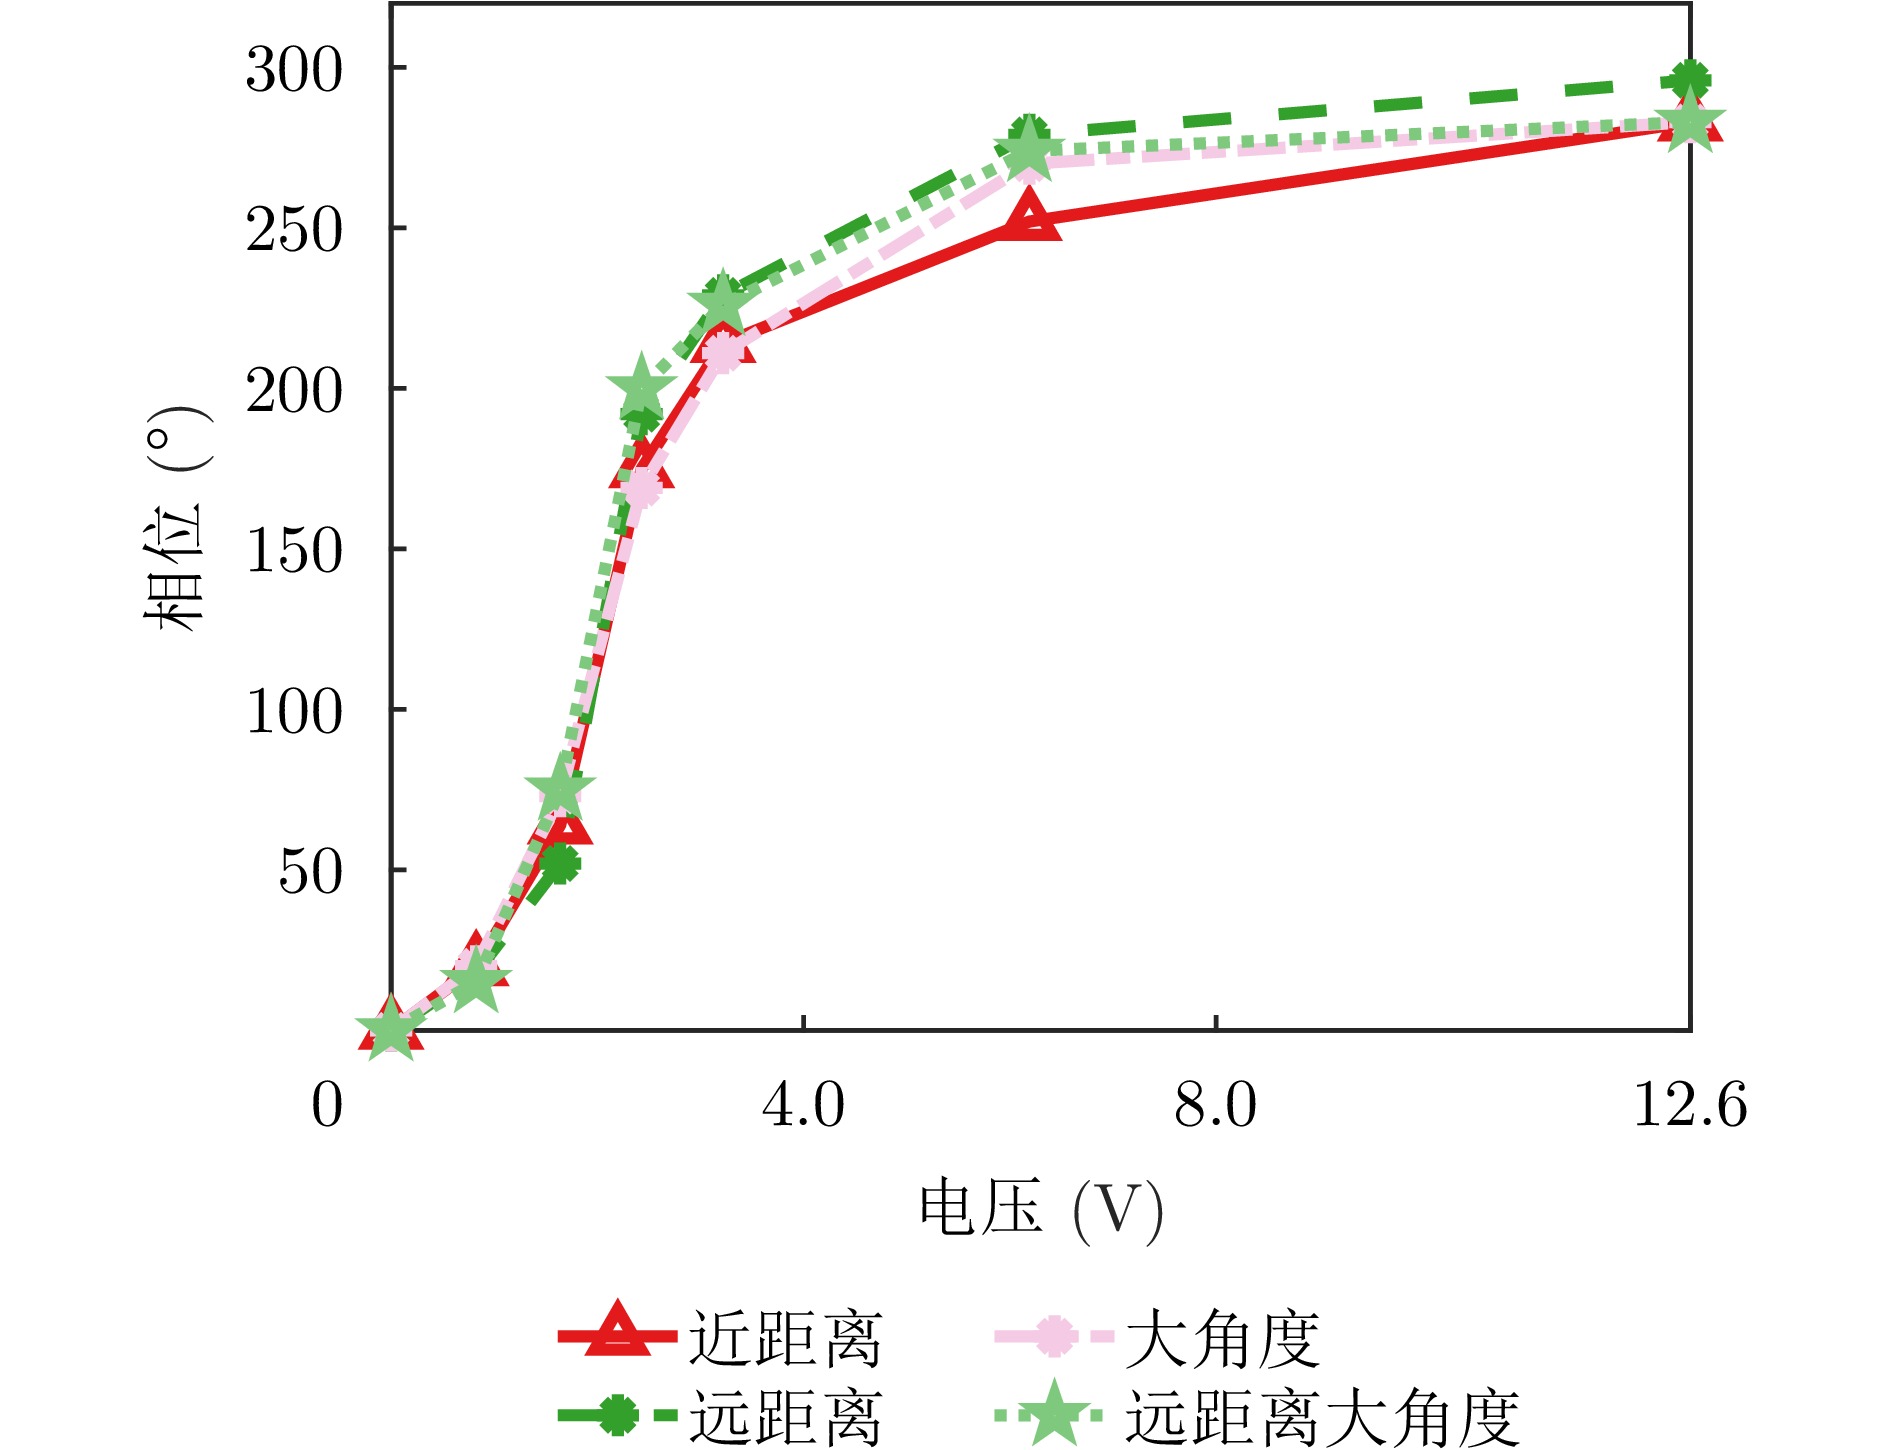
- Figure 10. Experimental result in the darkroom
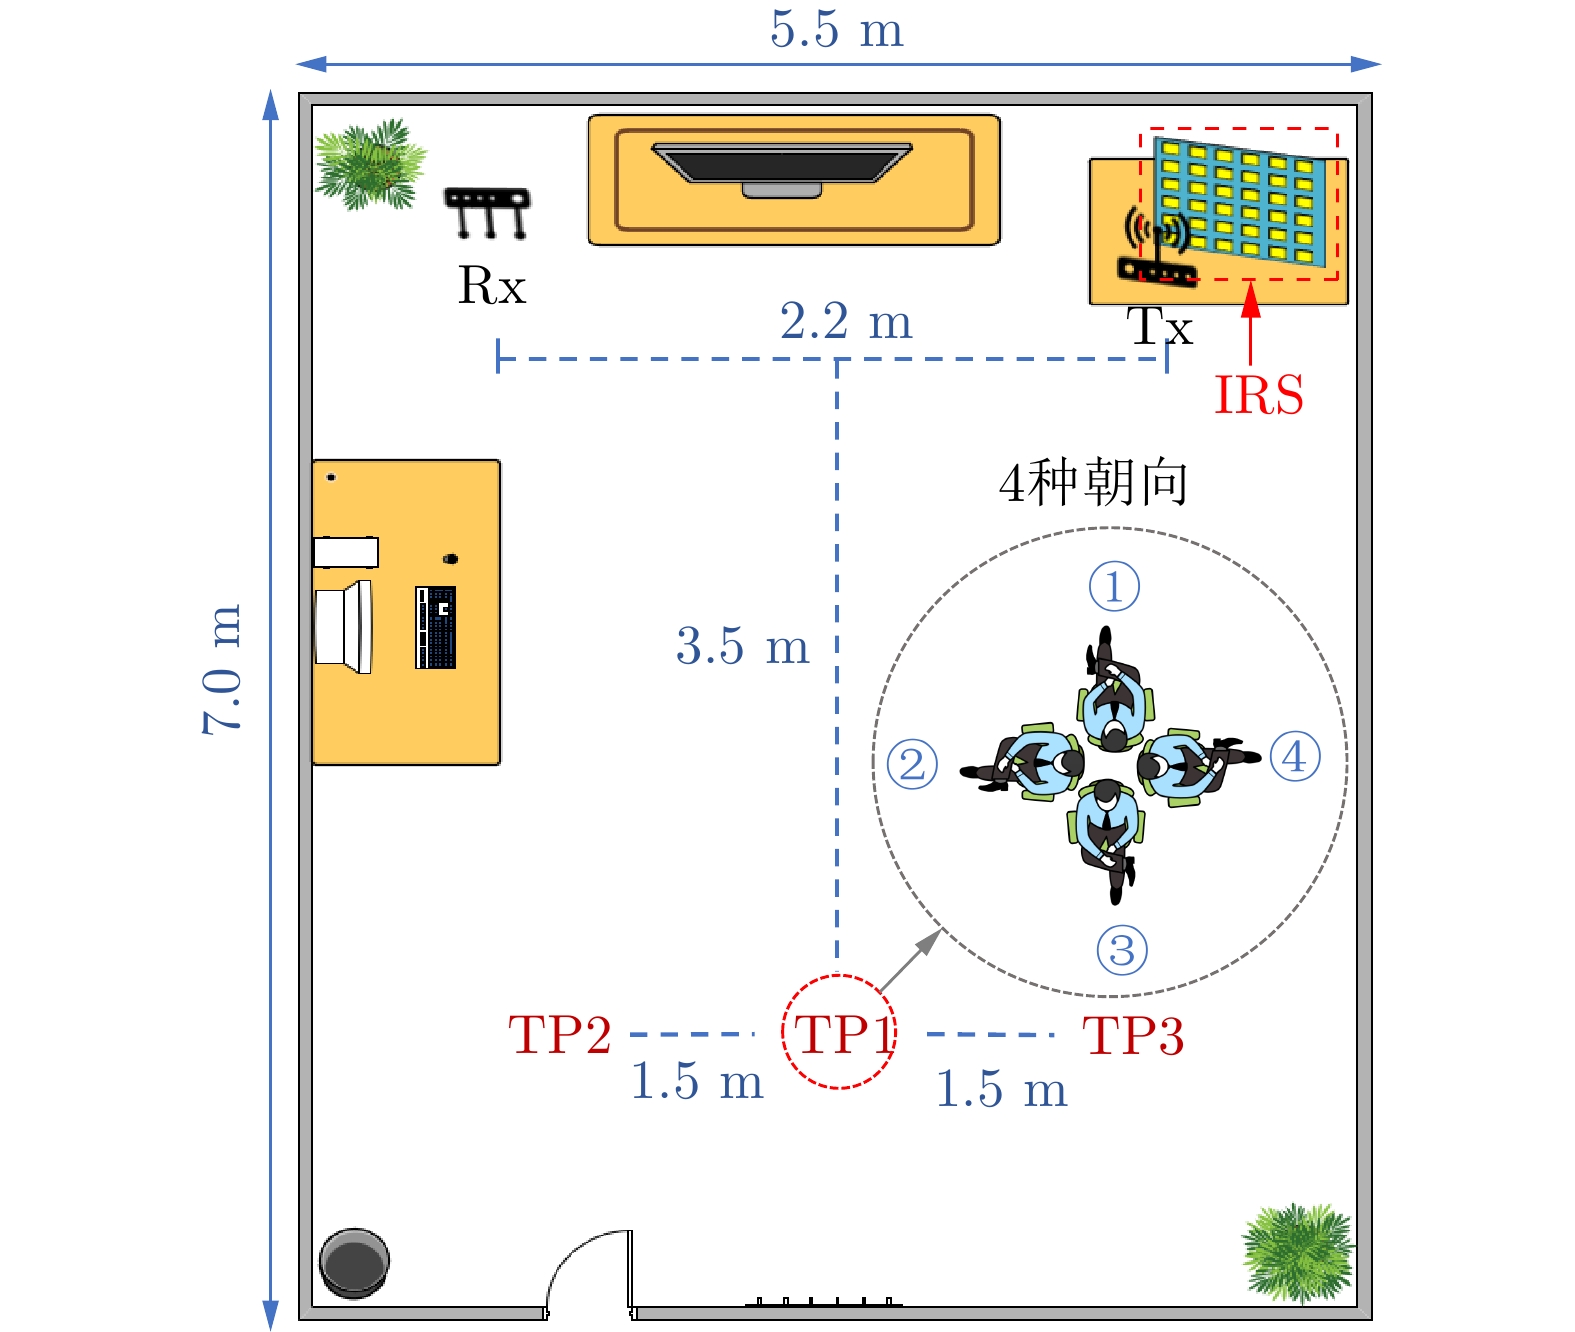
- Figure 11. Schematic diagram of the experimental environment
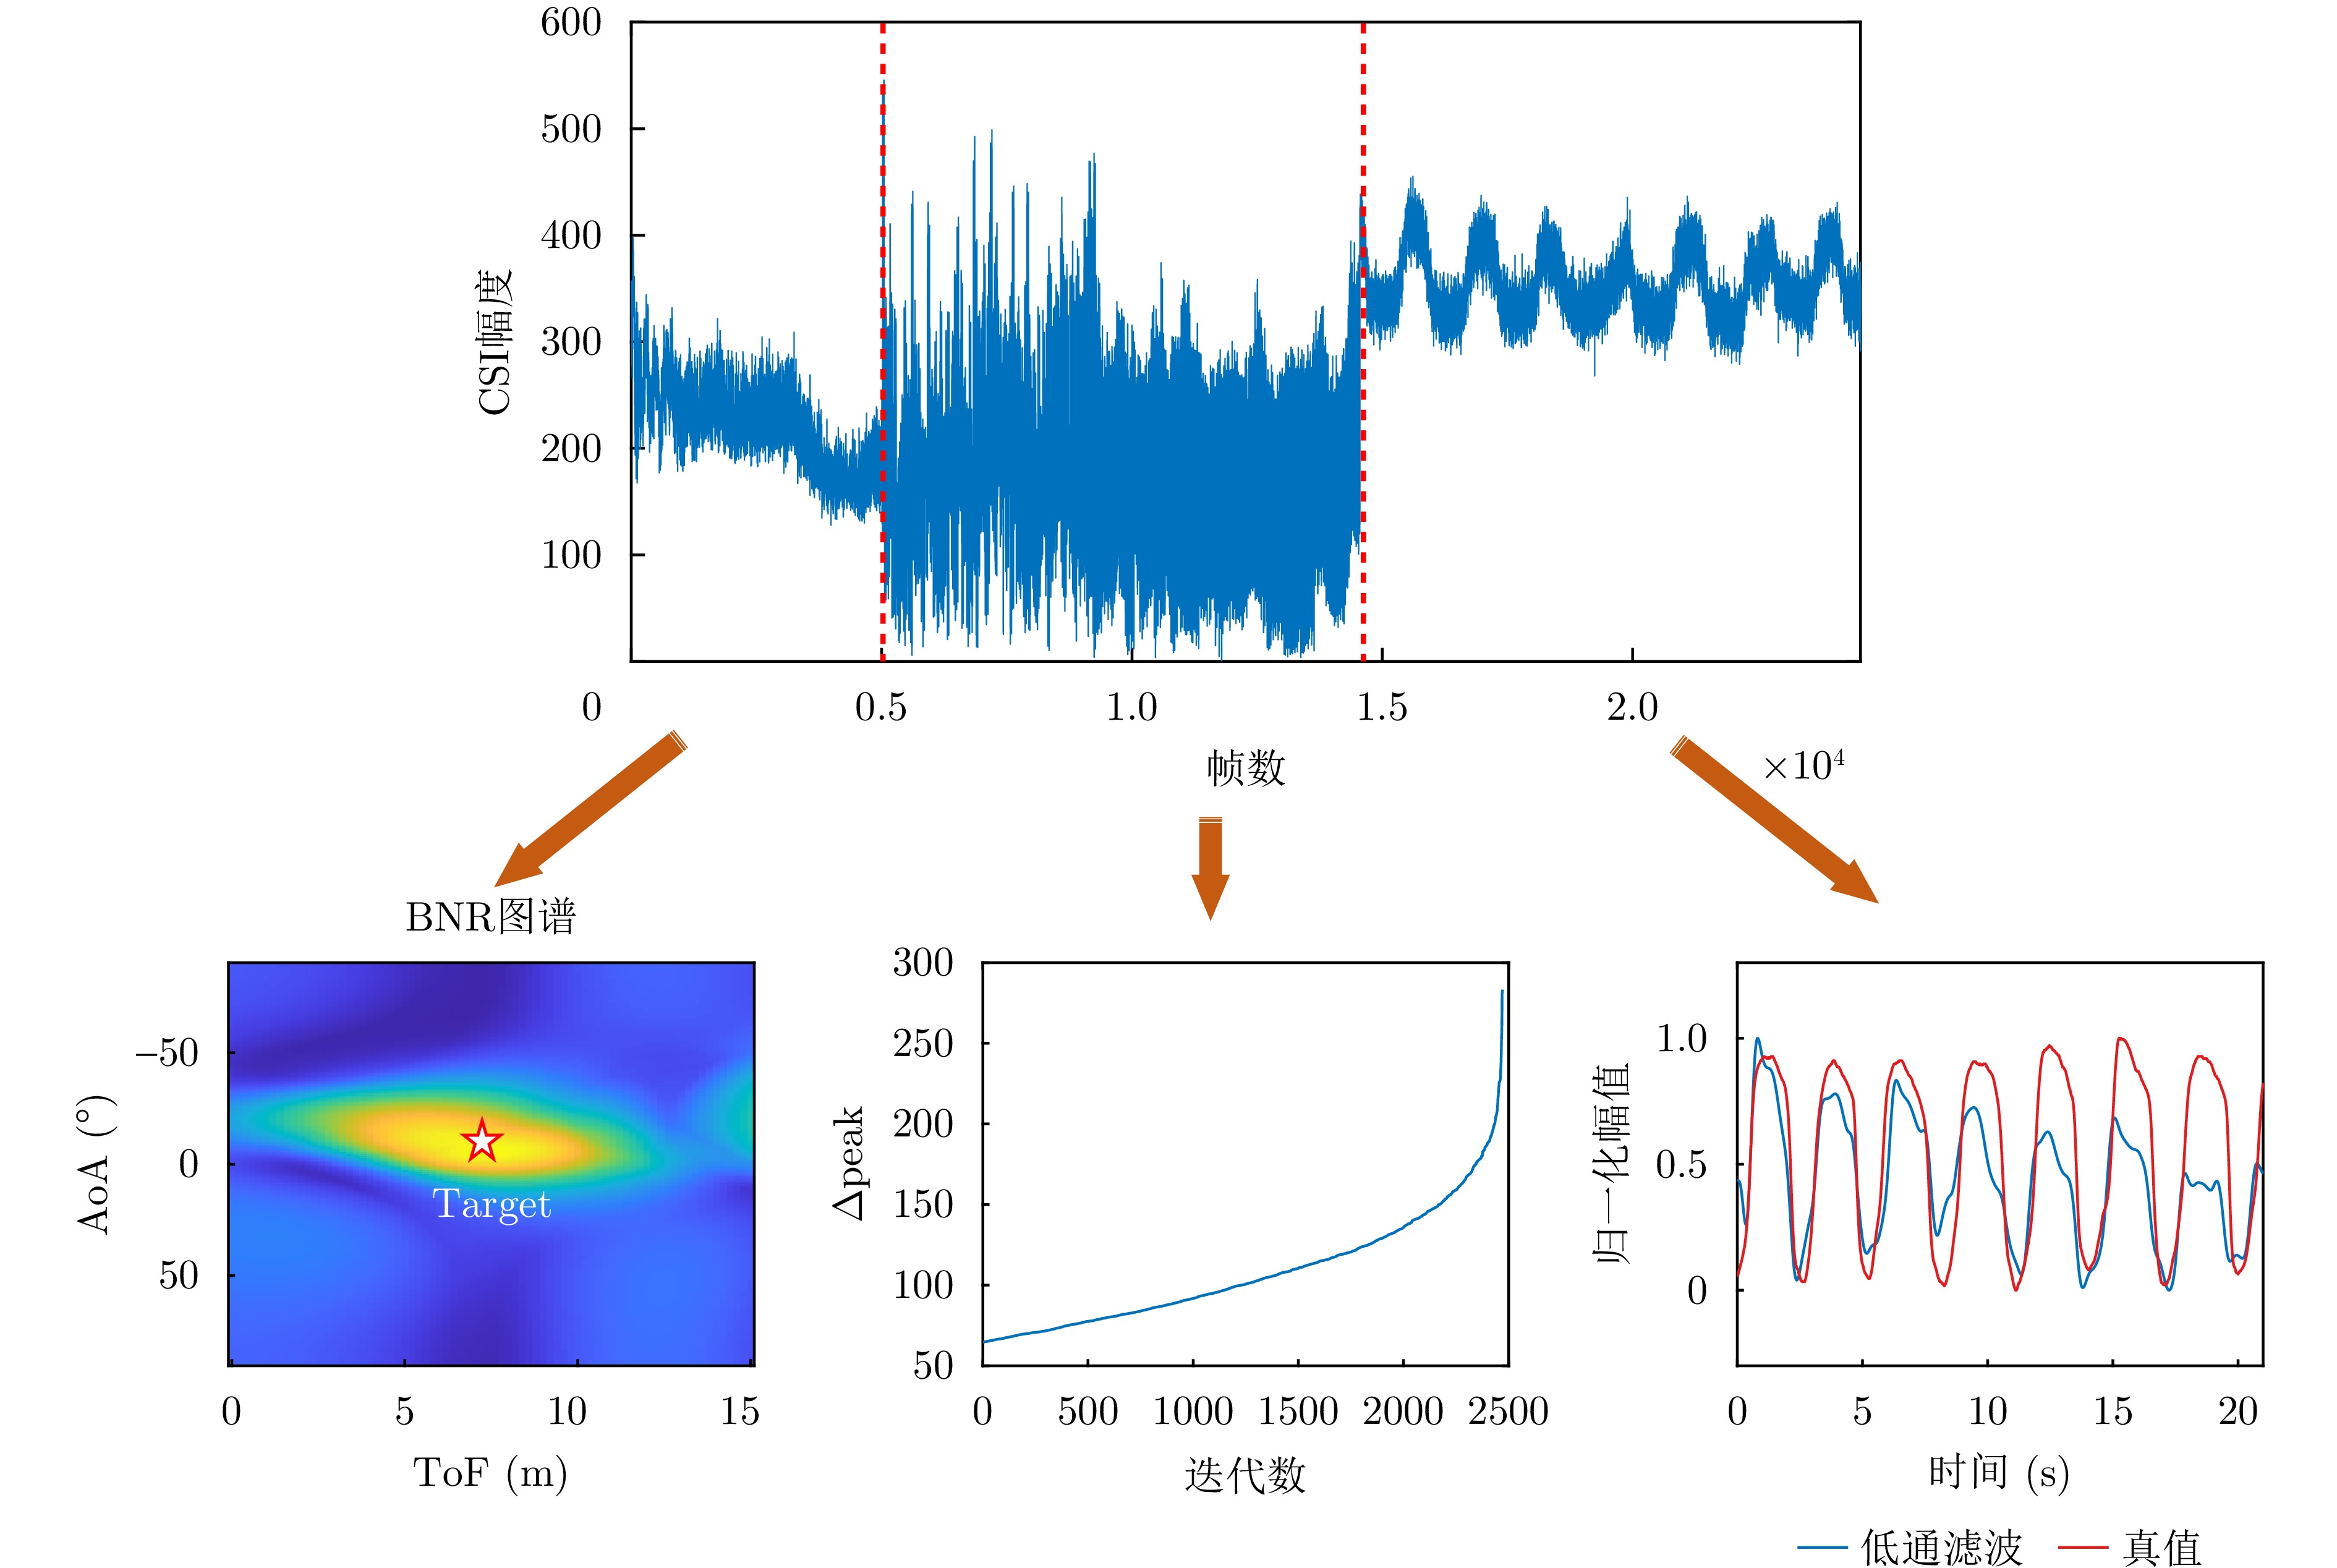
- Figure 12. The breathing detection process
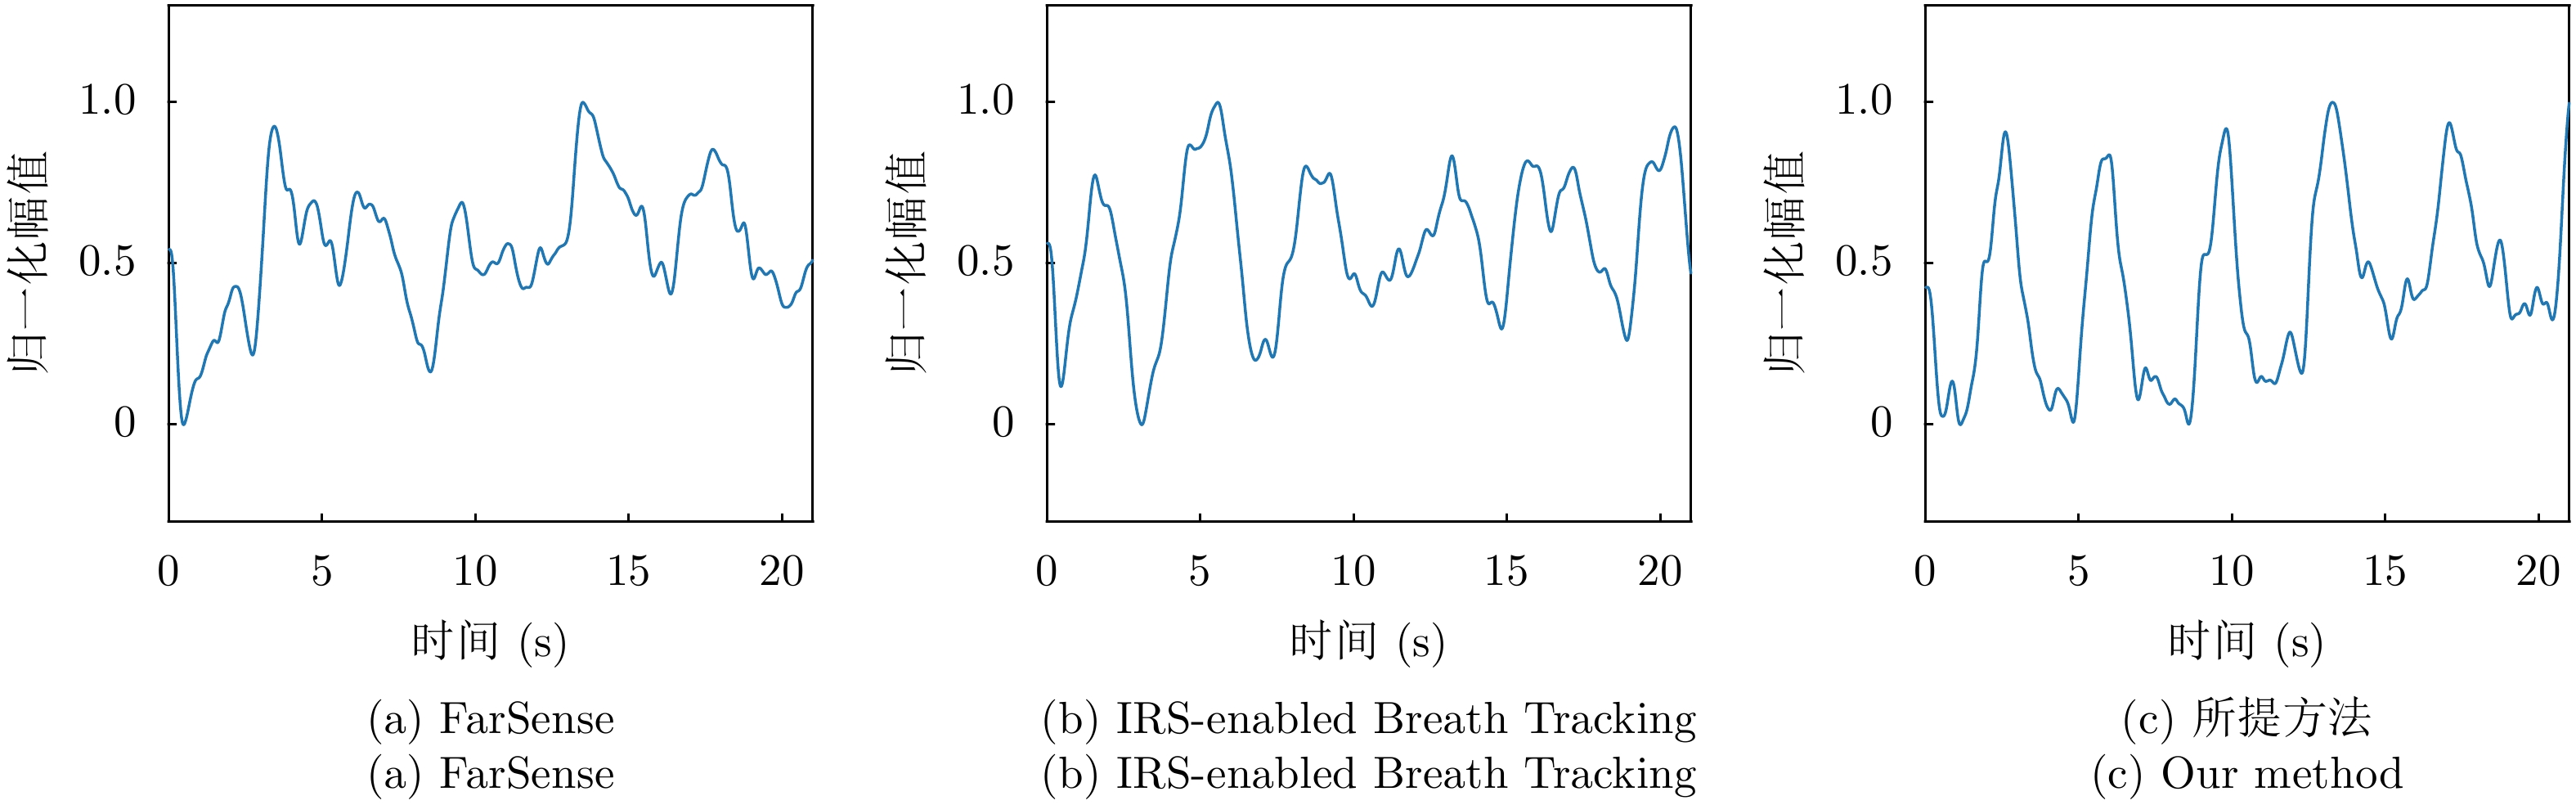
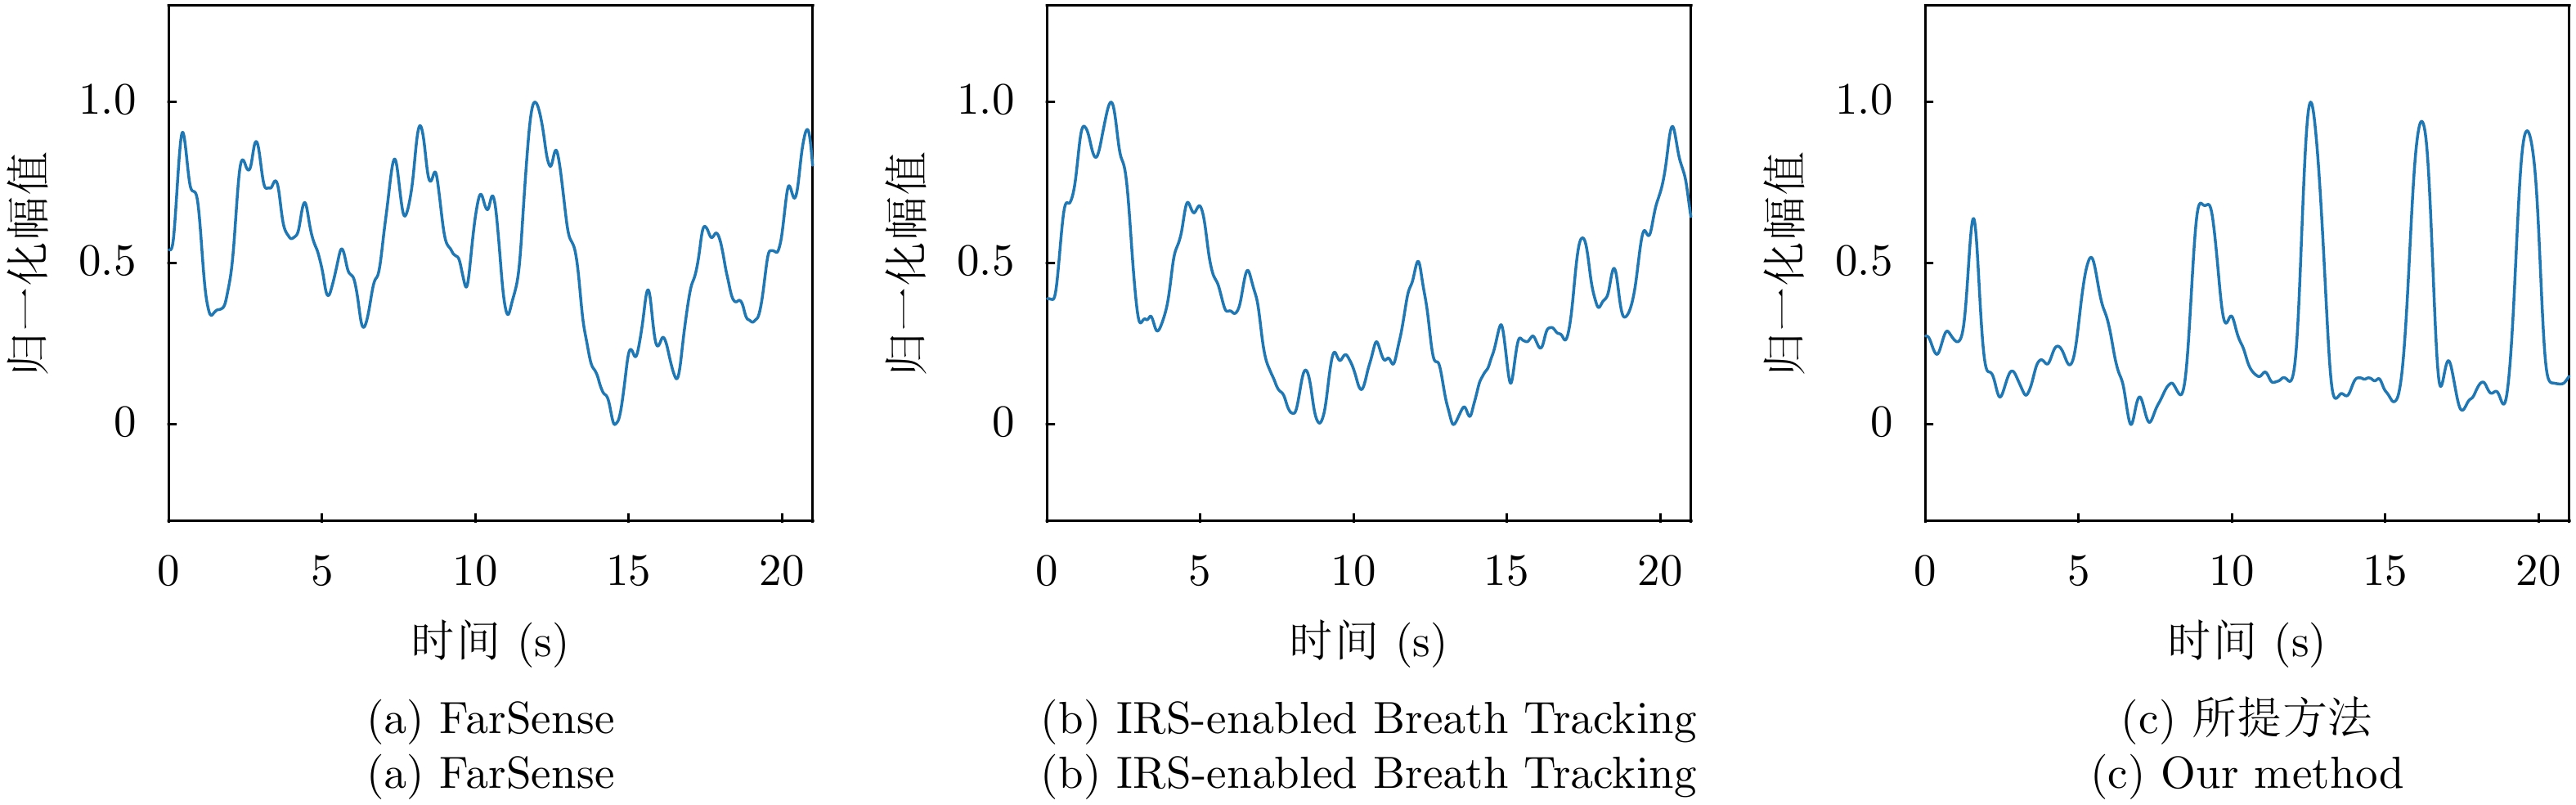
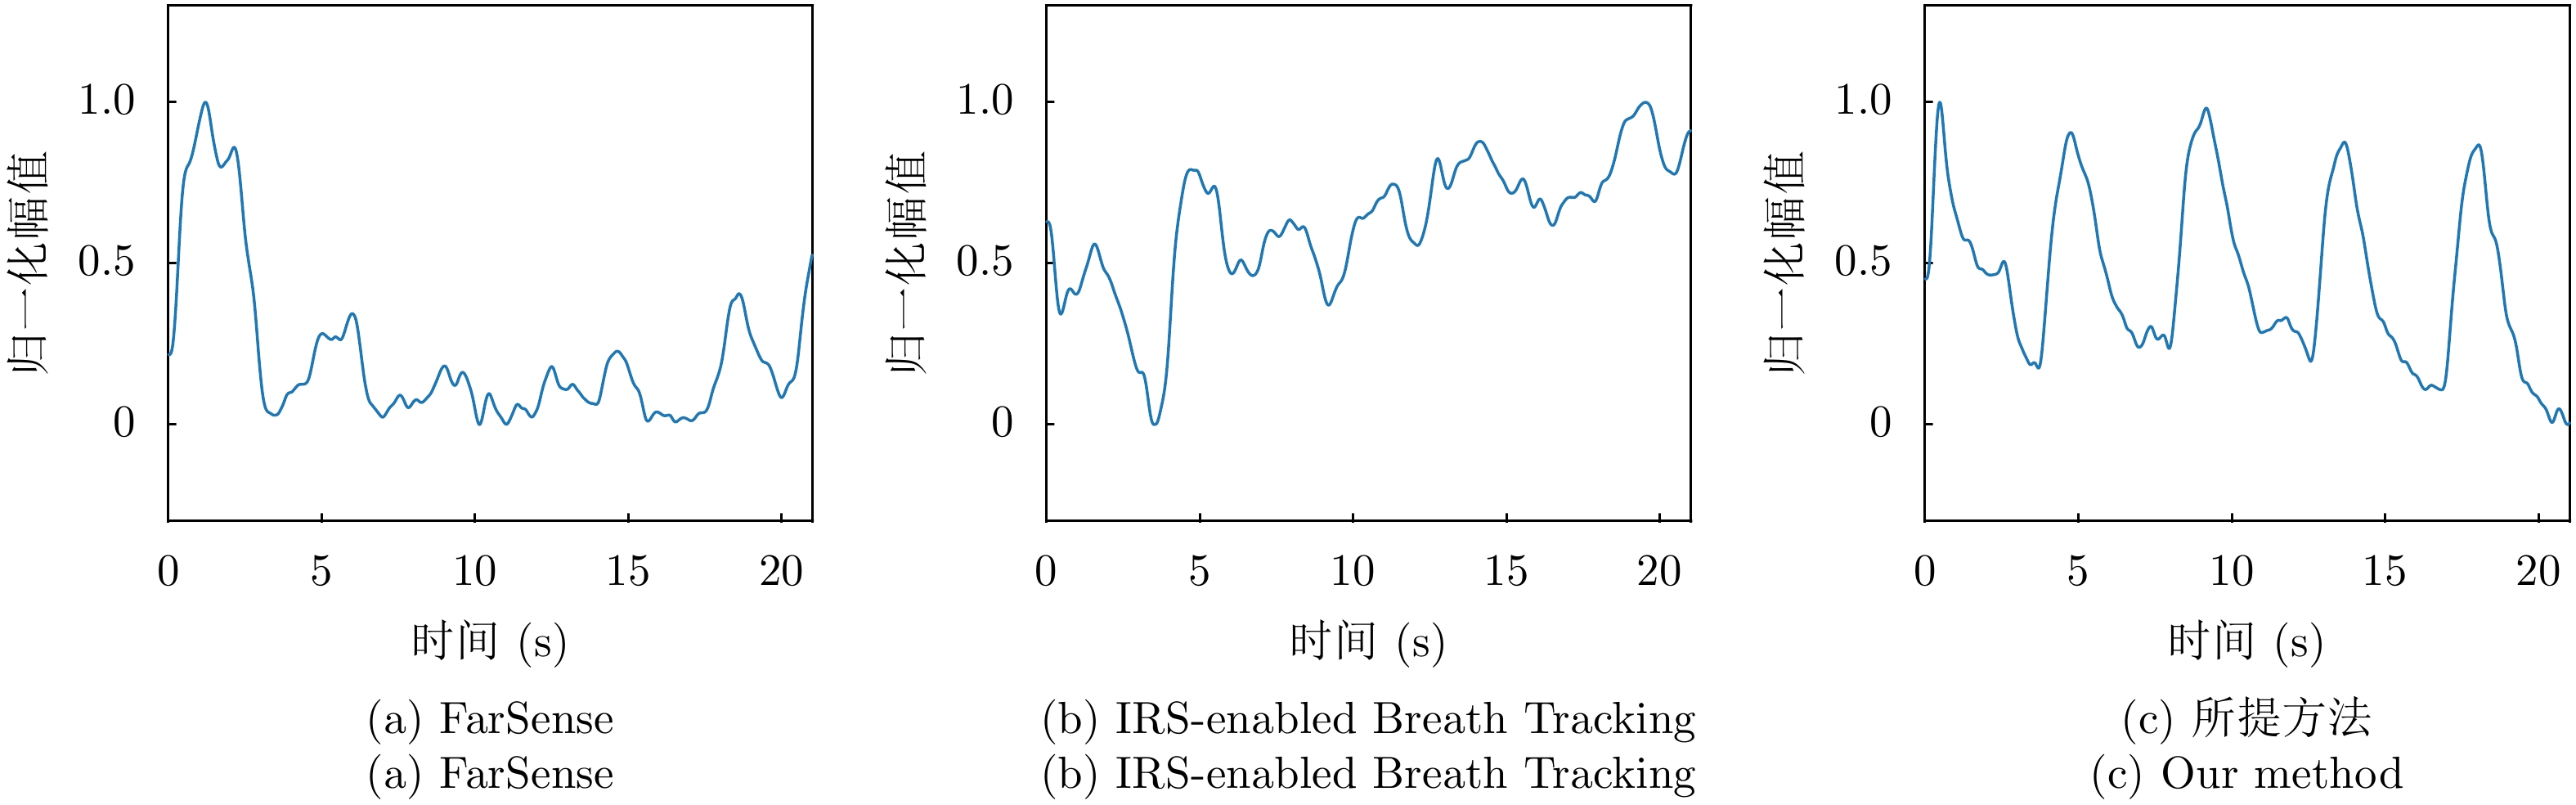
- Figure 13. Different results when the target person at location TP2 faces the WiFi device
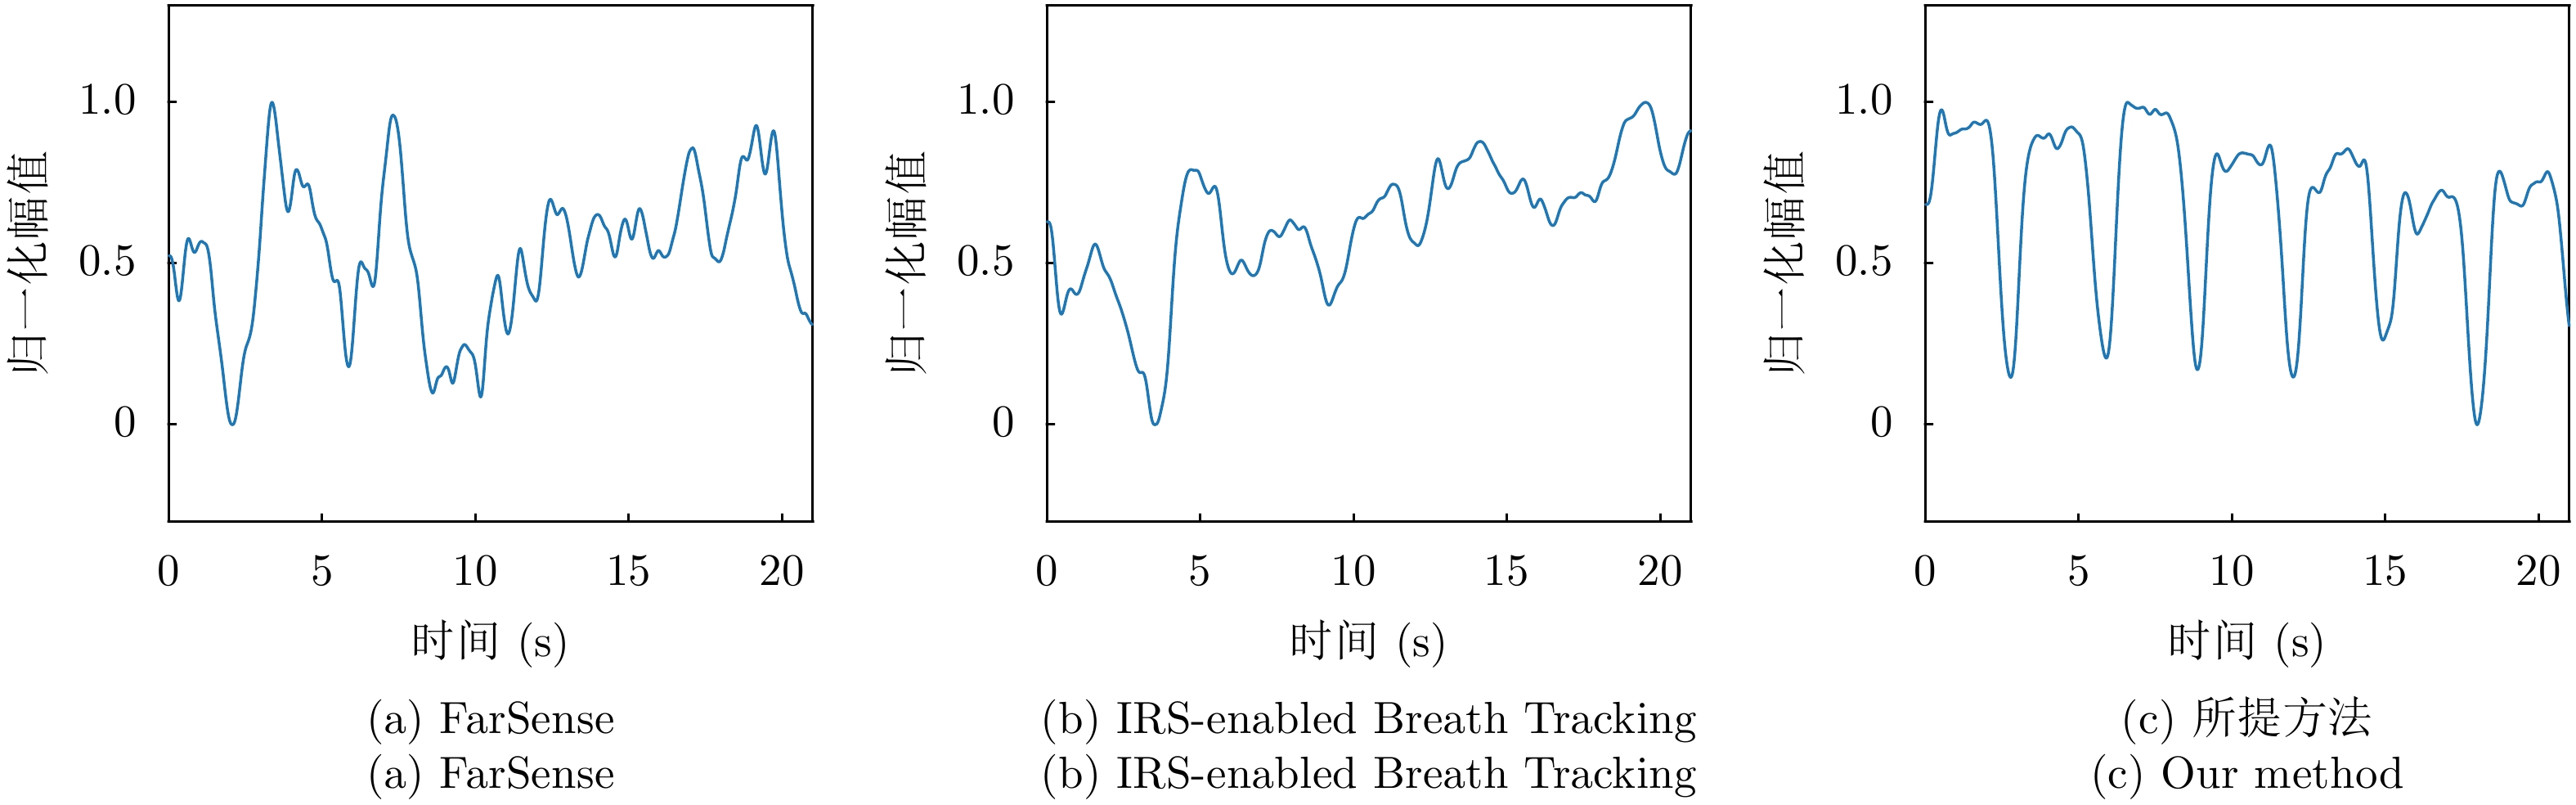
- Figure 14. Different results when the target person at location TP2 left to the WiFi device
- Figure 15. Different results when the target person at location TP2 right to the WiFi device
- Figure 16. Different results when the target person at location TP1 backs to the WiFi device
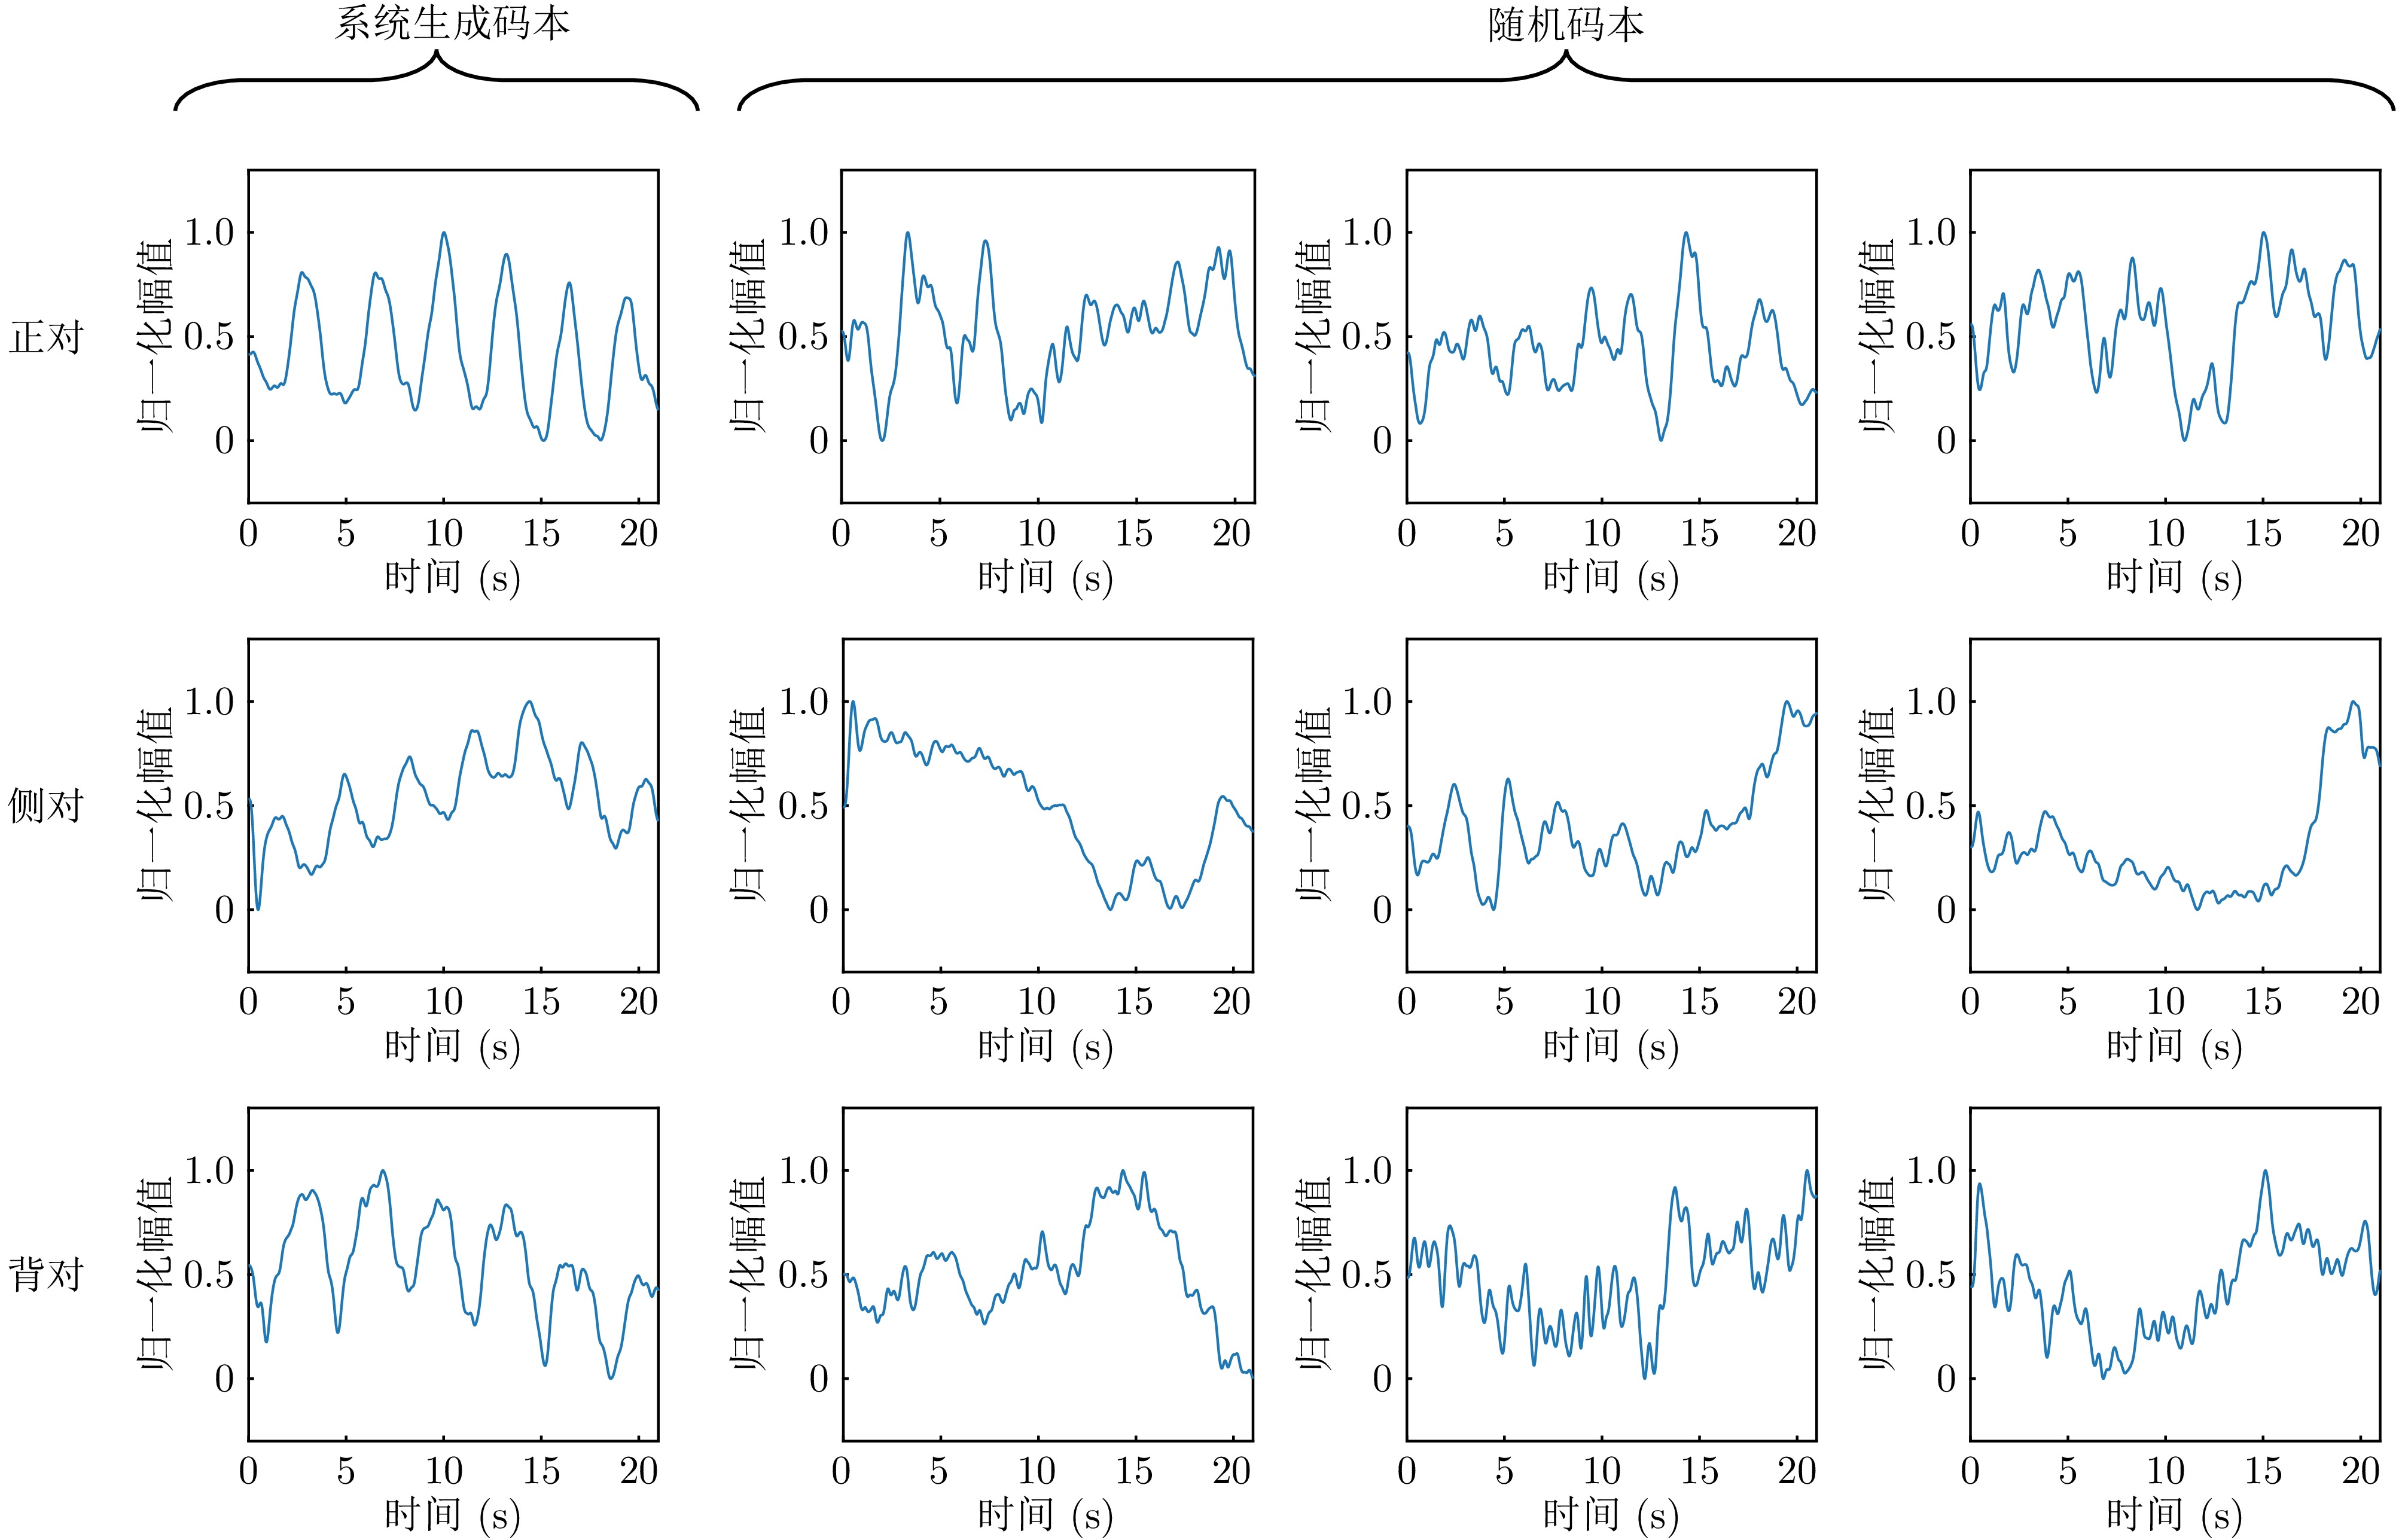
- Figure 17. Results of the codebook generated by the proposed system and the random approach, with the target positioned 4 m away from the detection device
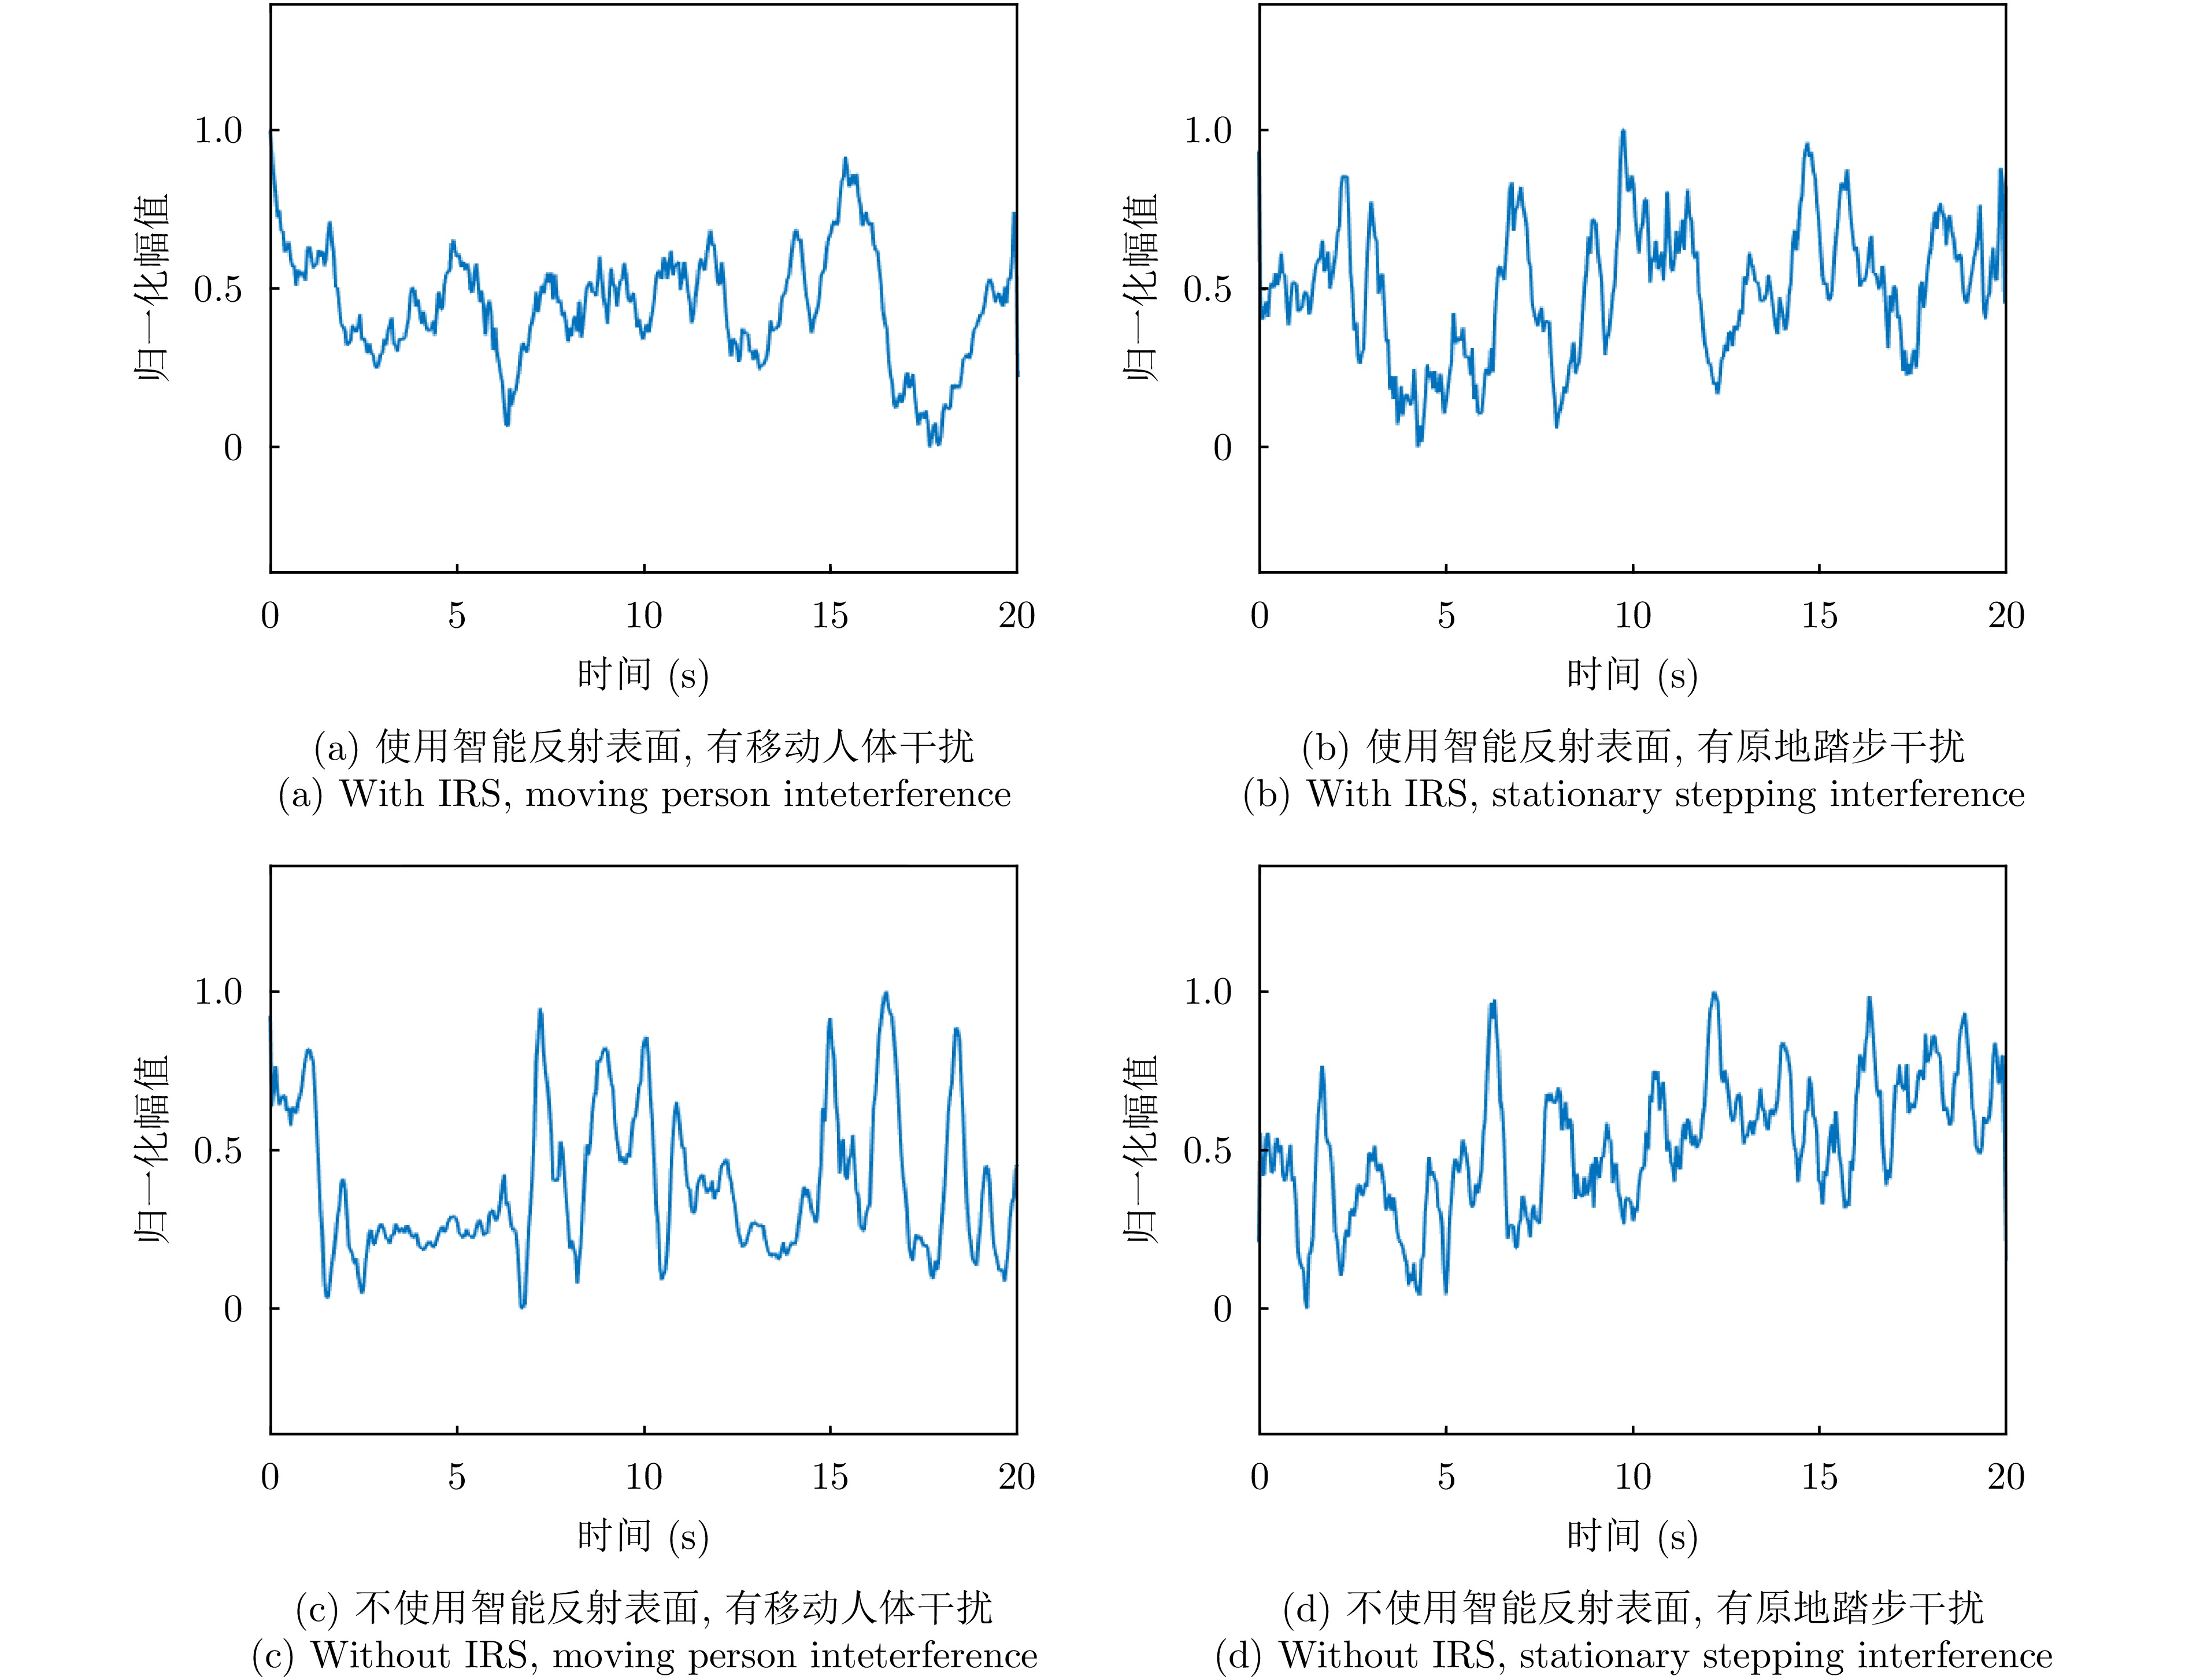
- Figure 18. Respiration detection results in dynamic environments