
 Submit Manuscript
 Peer Review
 Editor Work
- Home
- Articles & Issues
-
Data
- Dataset of Radar Detecting Sea
- SAR Dataset
- SARGroundObjectsTypes
- SARMV3D
- AIRSAT Constellation SAR Land Cover Classification Dataset
- 3DRIED
- UWB-HA4D
- LLS-LFMCWR
- FAIR-CSAR
- MSAR
- SDD-SAR
- FUSAR
- SpaceborneSAR3Dimaging
- Sea-land Segmentation
- SAR Multi-domain Ship Detection Dataset
- SAR-Airport
- Hilly and mountainous farmland time-series SAR and ground quadrat dataset
- SAR images for interference detection and suppression
- HP-SAR Evaluation & Analytical Dataset
- GDHuiYan-ATRNet
- Multi-System Maritime Low Observable Target Dataset
- DatasetinthePaper
- DatasetintheCompetition
- Report
- Course
- About
- Publish
- Editorial Board
- Chinese
| Citation: | HUANG Shuaiming, ZHU Xiaohua, WANG Wubin, et al. U-Sodar: Noncontact vital sign detection technology based on ultrasonic radar[J]. Journal of Radars, 2025, 14(1): 168–188. doi: 10.12000/JR24114

|
U-Sodar: Noncontact Vital Sign Detection Technology Based on Ultrasonic Radar
DOI: 10.12000/JR24114 CSTR: 32380.14.JR24114
More Information-
Abstract
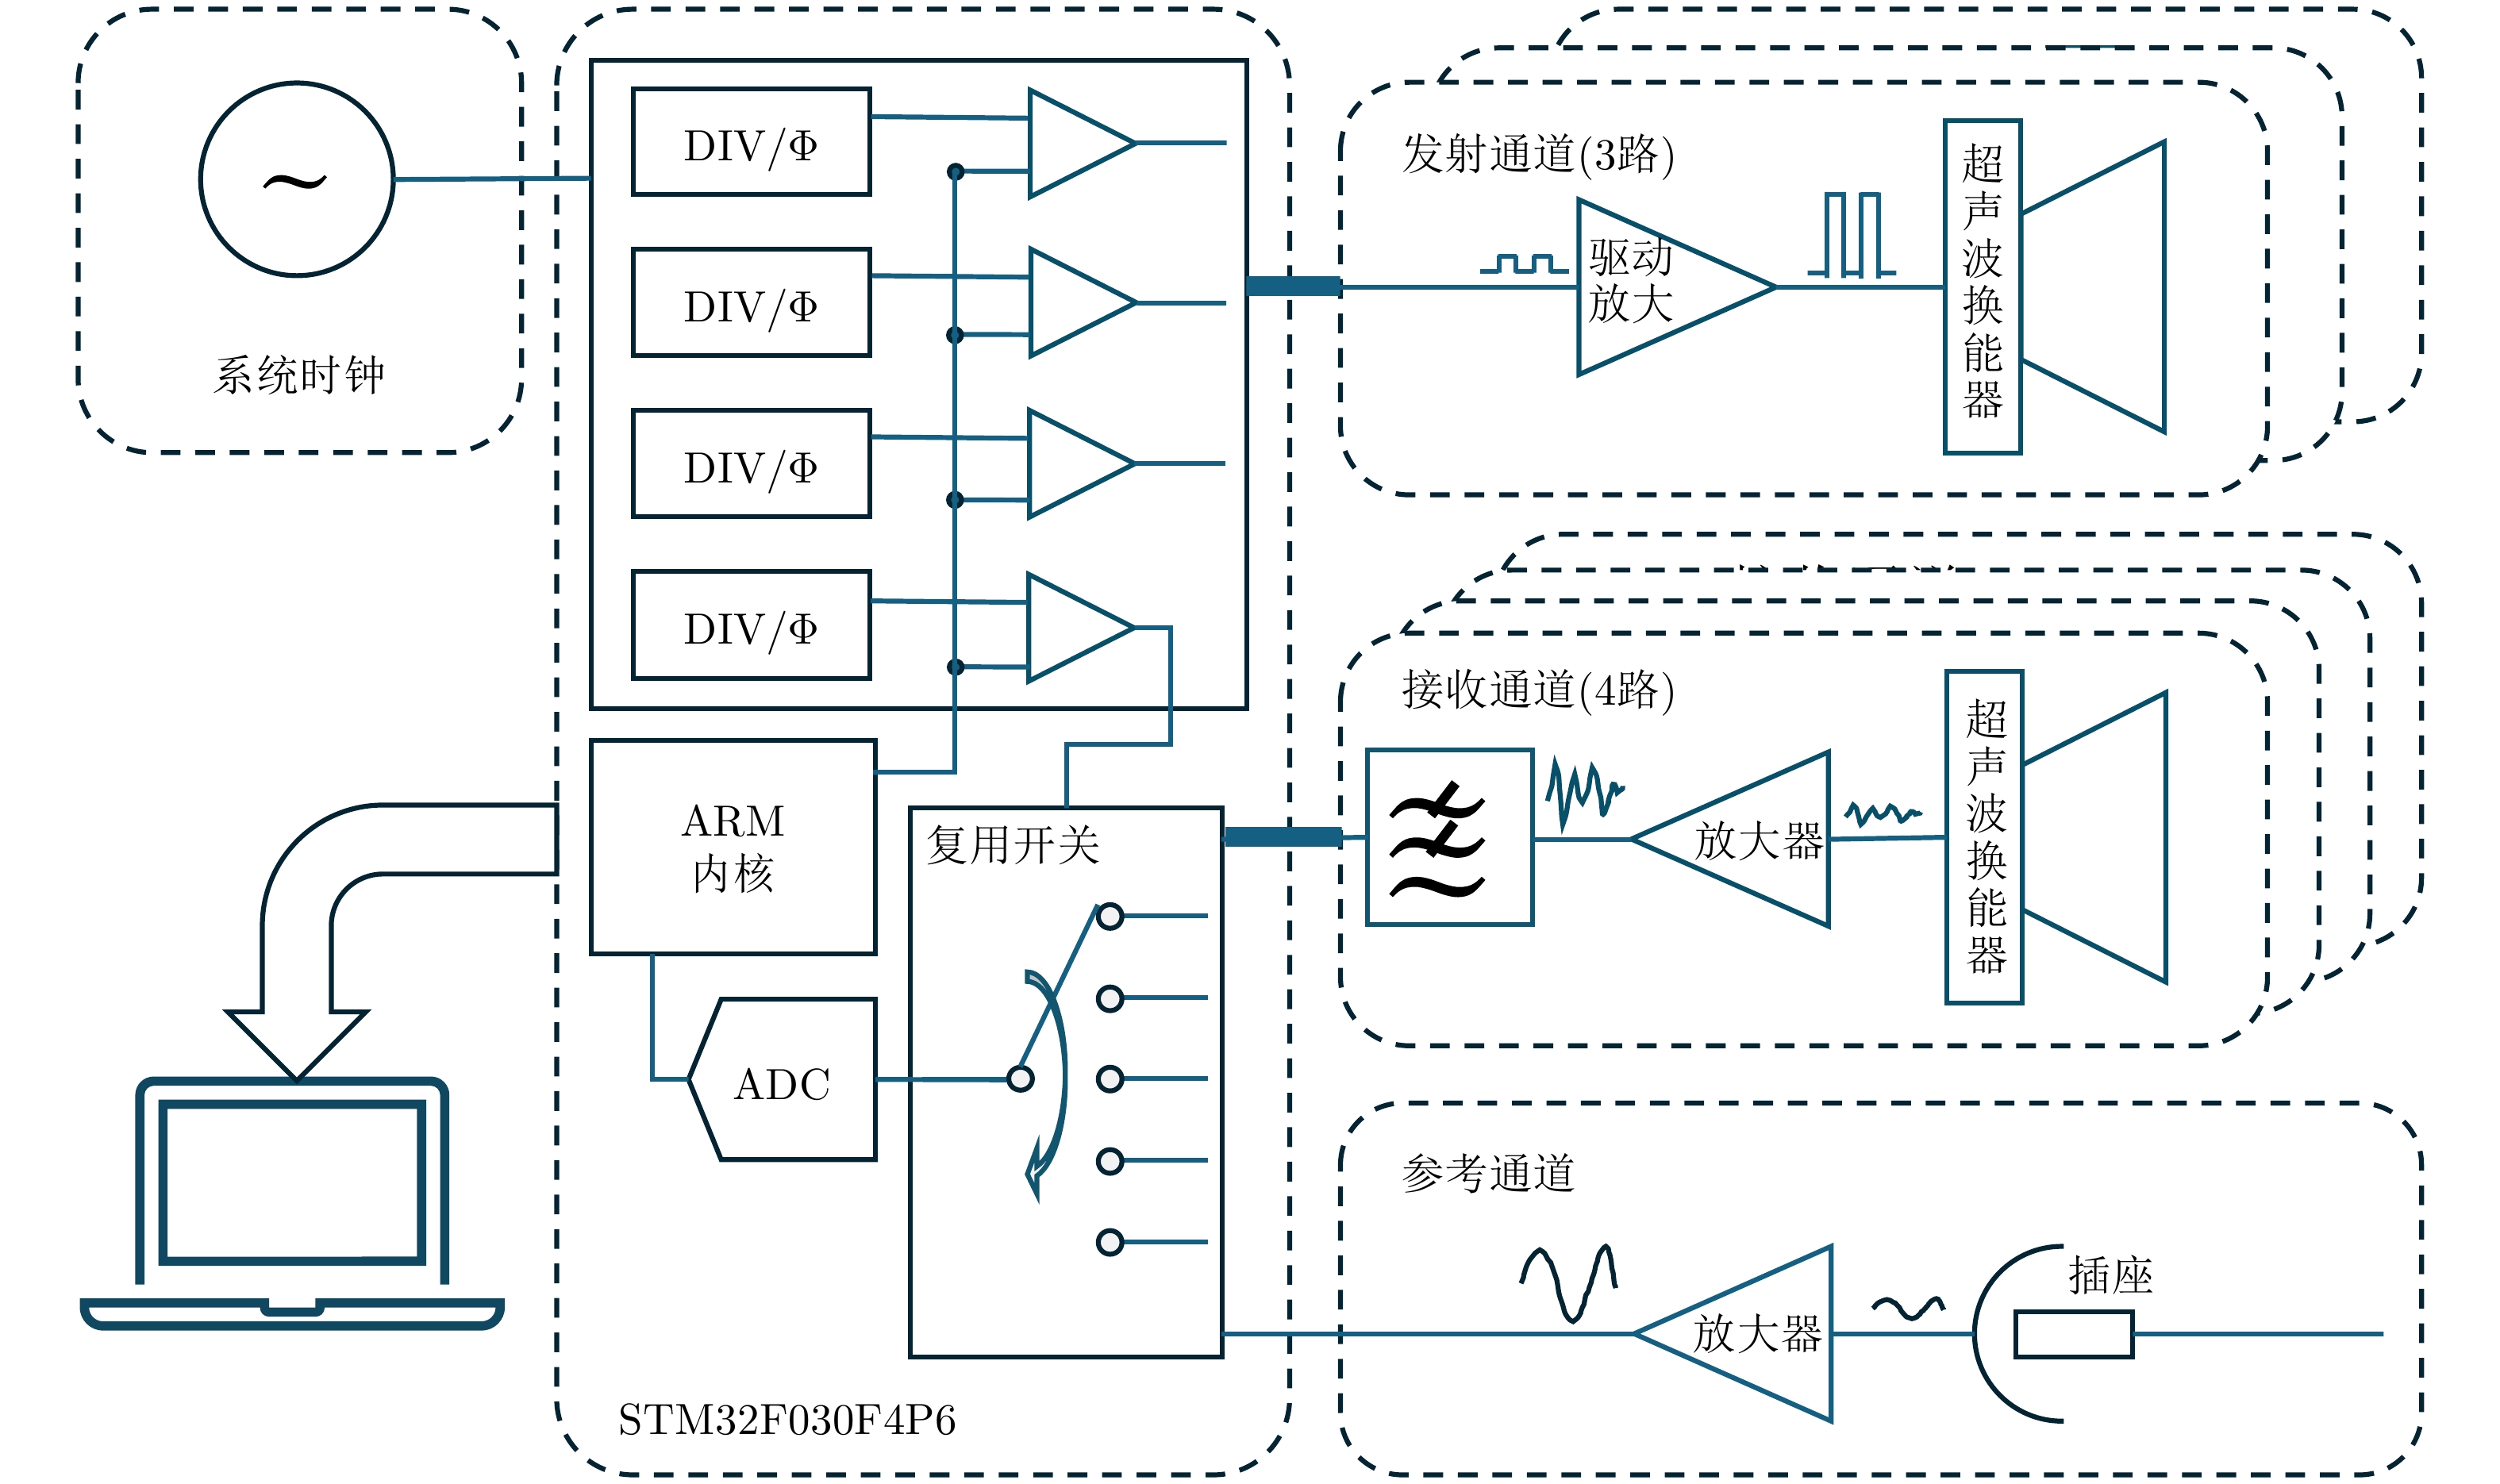
Amidst the global aging trend and a growing emphasis on healthy living, there is an increased demand for unobtrusive home health monitoring systems. However, the current mainstream detection methods in this regard suffer from low privacy trust, poor electromagnetic compatibility, and high manufacturing costs. To address these challenges, this paper introduces a noncontact vital signal collection device using Ultrasonic radar (U-Sodar), including a set of hardware based on a three-transmitter four-receiver Multiple Input Multiple Output (MIMO) architecture and a set of signal processing algorithms. The U-Sodar local oscillator uses frequency division technology with low phase noise and high detection accuracy; the receiver employs front-end direct sampling technology to simplify the involved structure and effectively reduce external noise, and the transmitter uses an adjustable PWM direct drive to emit various ultrasonic waveforms, possessing software-defined ultrasonic system characteristics. The signal processing algorithm of U-Sodar adopts the graph processing technique of signal chord length and realizes accurate recovery of signal phase under 5 dB Signal-to-Noise Ratio (SNR) using picture filtering and then reconstruction. Experimental tests on the U-Sodar system demonstrated its anti-interference and penetration capabilities, proving that ultrasonic penetration relies on material porosity rather than intermedium vibration conduction. The minimum measurable displacement for a given SNR with correct demodulation probability is also derived. The results of actual human vital sign signal measurement experiments indicate that U-Sodar can accurately measure respiration and heartbeat at 3.0 m and 1.5 m, respectively, and the heartbeat waveforms can be measured within 1.0 m. Overall, the experimental results demonstrate the feasibility and application potential of U-Sodar in noncontact vital sign detection.-
Keywords:
- Non-contact detection,
- Vital signals detection,
- CW radar,
- Ultrasound,
- U-Sodar
-

-
References
[1] United Nations. Ageing[EB/OL]. https://www.un.org/en/global-issues/ageing, 2024.[2] 民政部, 全国老龄办. 2022年度国家老龄事业发展公报[EB/OL]. https://www.gov.cn/lianbo/bumen/202312/P020231214405906944856.pdf, 2023.Ministry of Civil Affairs of China, National Office for Aging of China. 2022 national report on the development of aging services[EB/OL] https://www.gov.cn/lianbo/bumen/202312/P020231214405906944856.pdf, 2023.[3] PIRZADA P, WILDE A, and HARRIS-BIRTILL D. Remote photoplethysmography for heart rate and blood oxygenation measurement: A review[J]. IEEE Sensors Journal, 2024, 24(15): 23436–23453. doi: 10.1109/JSEN.2024.3405414.[4] WANG Wenjin, DEN BRINKER A C, STUIJK S, et al. Algorithmic principles of remote PPG[J]. IEEE Transactions on Biomedical Engineering, 2017, 64(7): 1479–1491. doi: 10.1109/TBME.2016.2609282.[5] KOBAYASHI L, CHUCK C C, KIM C K, et al. Comparison of video photoplethysmography, video motion analysis, and passive infrared thermography against traditional contact methods for acquiring vital signs in emergency department populations[C]. 2023 IEEE 14th Annual Ubiquitous Computing, Electronics & Mobile Communication Conference, New York, USA, 2023: 134–141. doi: 10.1109/UEMCON59035.2023.10316088.[6] PEREIRA C B, YU Xinchi, BLAZEK V, et al. Robust remote monitoring of breathing function by using infrared thermography[C]. 2015 37th Annual International Conference of the IEEE Engineering in Medicine and Biology Society, Milan, Italy, 2015: 4250–4253. doi: 10.1109/EMBC.2015.7319333.[7] 方震, 简璞, 张浩, 等. 基于FMCW雷达的非接触式医疗健康监测技术综述[J]. 雷达学报, 2022, 11(3): 499–516. doi: 10.12000/JR22019.FANG Zhen, JIAN Pu, ZHANG Hao, et al. Review of noncontact medical and health monitoring technologies based on FMCW radar[J]. Journal of Radars, 2022, 11(3): 499–516. doi: 10.12000/JR22019.[8] XIONG Junjun, HONG Hong, XIAO Lei, et al. Vital signs detection with difference beamforming and orthogonal projection filter based on SIMO-FMCW radar[J]. IEEE Transactions on Microwave Theory and Techniques, 2023, 71(1): 83–92. doi: 10.1109/TMTT.2022.3181129.[9] MA Yuanren, ZHAO Heng, ZHUANG Zhongxu, et al. Sleep-disordered breathing detection based on radar-pulse oximeter sensor fusion[C]. 2023 Asia-Pacific Microwave Conference, Taipei, China, 2023: 260–262. doi: 10.1109/APMC57107.2023.10439668.[10] SUN Li, BAI Ge, LUO Changhao, et al. A large-scale movement path fitting based phase compensation algorithm for FMCW radar vital sign detection[C]. 2024 IEEE Topical Conference on Wireless Sensors and Sensor Networks, San Antonio, USA, 2024: 37–40. doi: 10.1109/WiSNeT59910.2024.10438585.[11] 工业和信息化部. 中华人民共和国无线电频率划分规定[EB/OL]. https://www.gov.cn/zhengce/zhengceku/2018-12/31/content_5439640.htm, 2023.Ministry of Industry and Information Technology of China. Provisions on the allocation of radio frequencies of the People’s Republic of China[EB/OL]. https://www.gov.cn/zhengce/zhengceku/2018-12/31/content_5439640.htm, 2023.[12] 国际电信联盟. ITU-R SM.2093-4[EB/OL]. https://www.itu.int/dms_pub/itu-r/opb/rep/R-REP-SM.2093-4-2021-PDF-C.pdf, 2021.ITU. ITU-R SM.2093-4[EB/OL]. https://www.itu.int/dms_pub/itu-r/opb/rep/R-REP-SM.2093-4-2021-PDF-C.pdf, 2021.[13] 国家药品监督管理局. YY 9706.102-2021 医用电气设备 第1-2部分: 基本安全和基本性能的通用要求 并列标准: 电磁兼容 要求和试验[S]. 北京: 中国标准出版社, 2021.National Medical Products Administration. YY 9706.102-2021 Medical electrical equipment—Part 1-2: General requirements for basic safety and essential performance—collateral standard: Electromagnetic compatibility—requirements and tests[S]. Beijing: Standards Press of China, 2021.[14] Micradar. Healthy care radar[EB/OL]. https://en.micradar.cn/, 2024.[15] NAM Y, REYES B A, and CHON K H. Estimation of respiratory rates using the built-in microphone of a smartphone or headset[J]. IEEE Journal of Biomedical and Health Informatics, 2016, 20(6): 1493–1501. doi: 10.1109/JBHI.2015.2480838.[16] FUJITA Y, WATANABE K, KOBAYASHI K, et al. Development of system for unrestrained measurement of vital signs in the bathroom[C]. SICE Annual Conference 2011, Tokyo, Japan, 2011: 2322–2325.[17] DAFNA E, HALEVI M, BEN OR D, et al. Estimation of macro sleep stages from whole night audio analysis[C]. Annu Int Conf IEEE Eng Med Biol Soc 2016, Florida, USA, 2016: 2847–2850. doi: 10.1109/EMBC.2016.7591323.[18] WANG Zhi, ZHANG Fusang, LI Siheng, et al. Exploiting passive beamforming of smart speakers to monitor human heartbeat in real time[C]. 2021 IEEE Global Communications Conference, Madrid, Spain, 2021: 1–6. doi: 10.1109/GLOBECOM46510.2021.9685922.[19] 王军强. 噪声敏感建筑隔声与声舒适性要求[J]. 声学技术, 2023, 42(1): 57–61. doi: 10.16300/j.cnki.1000-3630.2023.01.010.WANG Junqiang. Requirements for sound insulation and sound comfort of noise-sensitive buildings[J]. Technical Acoustics, 2023, 42(1): 57–61. doi: 10.16300/j.cnki.1000-3630.2023.01.010.[20] 国家环境保护总部. GB 22337-2008 社会生活环境噪声排放标准[S]. 北京: 中国环境科学出版社, 2008.National Environmental Protection Headquarters. GB 22337-2008 Emission standard for community noise[S]. Beijing: China Environmental Press, 2008.[21] AL-NAJI A, AL-ASKERY A J, GHARGHAN S K, et al. A system for monitoring breathing activity using an ultrasonic radar detection with low power consumption[J]. Journal of Sensor and Actuator Networks, 2019, 8(2): 32. doi: 10.3390/jsan8020032.[22] AMBROSANIO M, FRANCESCHINI S, GRASSINI G, et al. A multi-channel ultrasound system for non-contact heart rate monitoring[J]. IEEE Sensors Journal, 2020, 20(4): 2064–2074. doi: 10.1109/JSEN.2019.2949435.[23] WANG Yili. Vital signs estimation scheme based on autocorrelation and variational mode decomposition using ultra-wide band radar[C]. 2023 8th International Conference on Intelligent Computing and Signal Processing, Xi’an, China, 2023: 350–354. doi: 10.1109/ICSP58490.2023.10248772.[24] MA Shaopeng, XUE Wei, CHEN Kehui, et al. Radar vital signs detection method based on variational mode decomposition and wavelet transform[C]. 2021 China Automation Congress, Beijing, China, 2021: 7469–7474. doi: 10.1109/CAC53003.2021.9728129.[25] XIA Ziliang, WANG Xinhuai, WEI Hongbo, et al. Detection of vital signs based on variational mode decomposition using FMCW radar[C]. 2021 International Conference on Microwave and Millimeter Wave Technology, Nanjing, China, 2021: 1–3. doi: 10.1109/ICMMT52847.2021.9617967.[26] YANG Xuan, WANG Ziying, ZHANG Li, et al. A novel arc-chord approximation demodulation based on green’s theorem[C]. 2023 IEEE MTT-S International Wireless Symposium, Qingdao, China, 2023: 1–3. doi: 10.1109/IWS58240.2023.10222839.[27] LV Qinyi, CAO Congqi, and ZHOU Deyun. Wireless vital-sign detection based on improved arc-chord approximation demodulation[C]. 2022 IEEE MTT-S International Microwave Biomedical Conference, Suzhou, China, 2022: 57–59. doi: 10.1109/IMBioC52515.2022.9790242.[28] LV Qinyi, MIN Lingtong, CAO Congqi, et al. Time-domain Doppler biomotion detections immune to unavoidable DC offsets[J]. IEEE Transactions on Instrumentation and Measurement, 2021, 70: 8505010. doi: 10.1109/TIM.2021.3125096.[29] ZHANG Li, FU Changhong, ZHUANG Zhongxu, et al. Kalman filter and cross-multiply algorithm with adaptive DC offset removal[J]. IEEE Transactions on Instrumentation and Measurement, 2022, 71: 4002710. doi: 10.1109/TIM.2022.3147317.[30] CAO Zhiyuan, ZHANG Chengcheng, JIN Zirui, et al. A DC offset cancellation circuit using digital assistance technique and self-calibrating comparator for RF transceiver[C]. 2023 IEEE 15th International Conference on ASIC, Nanjing, China, 2023: 1–4. doi: 10.1109/ASICON58565.2023.10396145.[31] HAZRA S, FUSCO A, KIPRIT G N, et al. Robust radar-based vital sensing with adaptive sinc filtering and random body motion rejections[J]. IEEE Sensors Letters, 2023, 7(5): 7001604. doi: 10.1109/LSENS.2023.3266237.[32] TARIQ A and GHAFOURI-SHIRAZ H. Vital signs detection using Doppler radar and continuous wavelet transform[C]. 5th European Conference on Antennas and Propagation, Rome, Italy, 2011: 285–288.[33] ZHANGI T, VALERIO G, SARRAZIN J, et al. Wavelet-based analysis of 60 GHz Doppler radar for non-stationary vital sign monitoring[C]. 2017 11th European Conference on Antennas and Propagation, Paris, France, 2017: 1876–1877. doi: 10.23919/EuCAP.2017.7928689.[34] FU Yangye, SUN Lijuan, GUO Jian, et al. EEMD-MICA based heart rate extraction algorithm for radar signals[C]. 2023 35th Chinese Control and Decision Conference, Yichang, China, 2023: 1649–1655. doi: 10.1109/CCDC58219.2023.10327001.[35] INDU S, GUPTA A, KAW A, et al. Life detection system using continuous wave Doppler radar and blind source separation[C]. 2017 Devices for Integrated Circuit, Kalyani, India, 2017: 711–715. doi: 10.1109/DEVIC.2017.8074043.[36] LIU Heng, WANG Yong, ZHOU Mu, et al. Millimeter-wave radar vital signs detection based on modified independent component analysis[C]. 2023 IEEE 11th Asia-Pacific Conference on Antennas and Propagation, Guangzhou, China, 2023: 1–2. doi: 10.1109/APCAP59480.2023.10470254.[37] CHOWDHURY J H, SHIHAB M, PRAMANIK S K, et al. Separation of heartbeat waveforms of simultaneous two-subjects using independent component analysis and empirical mode decomposition[J]. IEEE Microwave and Wireless Technology Letters, 2024, 34(8): 1059–1062. doi: 10.1109/LMWT.2024.3420253.[38] HUANG C Y, FANG Guanwei, CHUANG H R, et al. Clutter-resistant vital sign detection using amplitude-based demodulation by EEMD-PCA-correlation algorithm for FMCW radar systems[C]. 2019 49th European Microwave Conference, Paris, France, 2019: 928–931. doi: 10.23919/EuMC.2019.8910730.[39] YU Xiaogang, LI Changzhi, and LIN J. Noise analysis for noncontact vital sign detectors[C]. 2010 IEEE 11th Annual Wireless and Microwave Technology Conference, Melbourne, USA, 2010: 1–4. doi: 10.1109/WAMICON.2010.5461889.[40] MARZO A, CORKETT T, and DRINKWATER B W. Ultraino: An open phased-array system for narrowband airborne ultrasound transmission[J]. IEEE Transactions on Ultrasonics, Ferroelectrics, and Frequency Control, 2018, 65(1): 102–111. doi: 10.1109/TUFFC.2017.2769399.[41] MÄKINEN Y, AZZARI L, and FOI A. Collaborative filtering of correlated noise: Exact transform-domain variance for improved shrinkage and patch matching[J]. IEEE Transactions on Image Processing, 2020, 29: 8339–8354. doi: 10.1109/TIP.2020.3014721.[42] WANG Jingyu, WANG Xiang, ZHU Zhongbo, et al. 1-D microwave imaging of human cardiac motion: An ab-initio investigation[J]. IEEE Transactions on Microwave Theory and Techniques, 2013, 61(5): 2101–2107. doi: 10.1109/TMTT.2013.2252186.[43] YANG Xiufang, JIAO Zhen, and YANG Yankang. Researchon linear demodulation method of Doppler radar vital signal[C]. 2022 IEEE International Conference on Electrical Engineering, Big Data and Algorithms, Changchun, China, 2022: 1381–1385. doi: 10.1109/EEBDA53927.2022.9744892.[44] WANG Jingyu, WANG Xiang, CHEN Lei, et al. Noncontact distance and amplitude-independent vibration measurement based on an extended DACM algorithm[J]. IEEE Transactions on Instrumentation and Measurement, 2014, 63(1): 145–153. doi: 10.1109/TIM.2013.2277530. -
Proportional views

- Publishing Ethics
- Journal Insights
- Abstracting & Indexing
- Peer Review Policies
- Guide for Authors
- Conference
- ISSN 2095-283X (Print)ISSN 2097-339X (Online)
- CN 10-1030/TN
- CODEN LXEUAO
About Journal
- Sponsor: China Radio Detection and Ranging Industry Association (CRIA)
- Phone: 010-58887062
- Email:radars@aircas.ac.cn
- Publisher: Leida Xuebao Bianjibu (Editorial office of the Journal of Radars)
Contacts Us

京ICP备20021838号-14
Supported by: Beijing Renhe Information Technology Co. Ltd

Export File
Citation
Format
Content
 DownLoad:


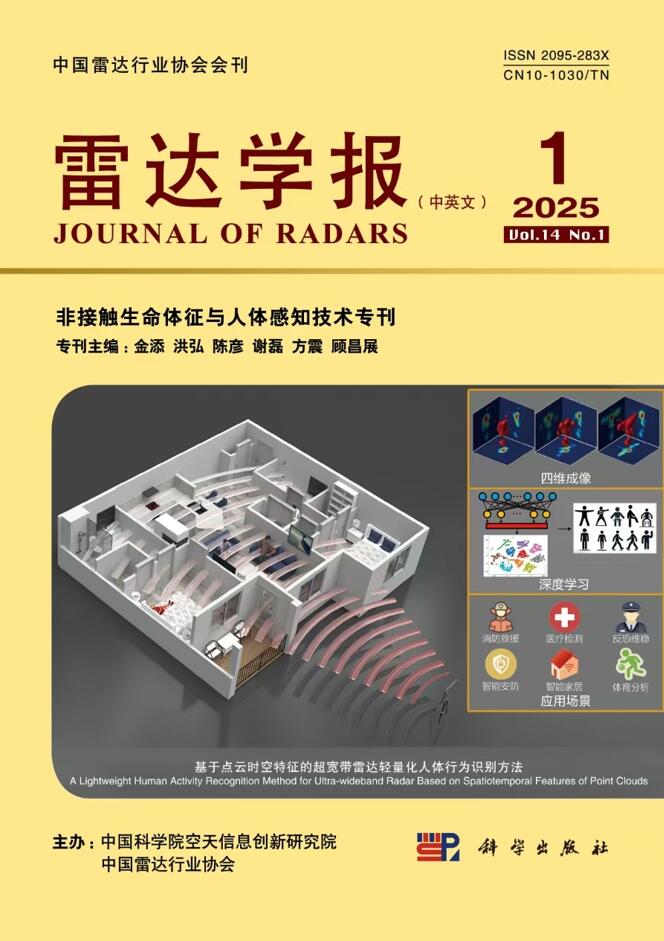
- Figure 1. Overview of U-Sodar vital signal monitoring system
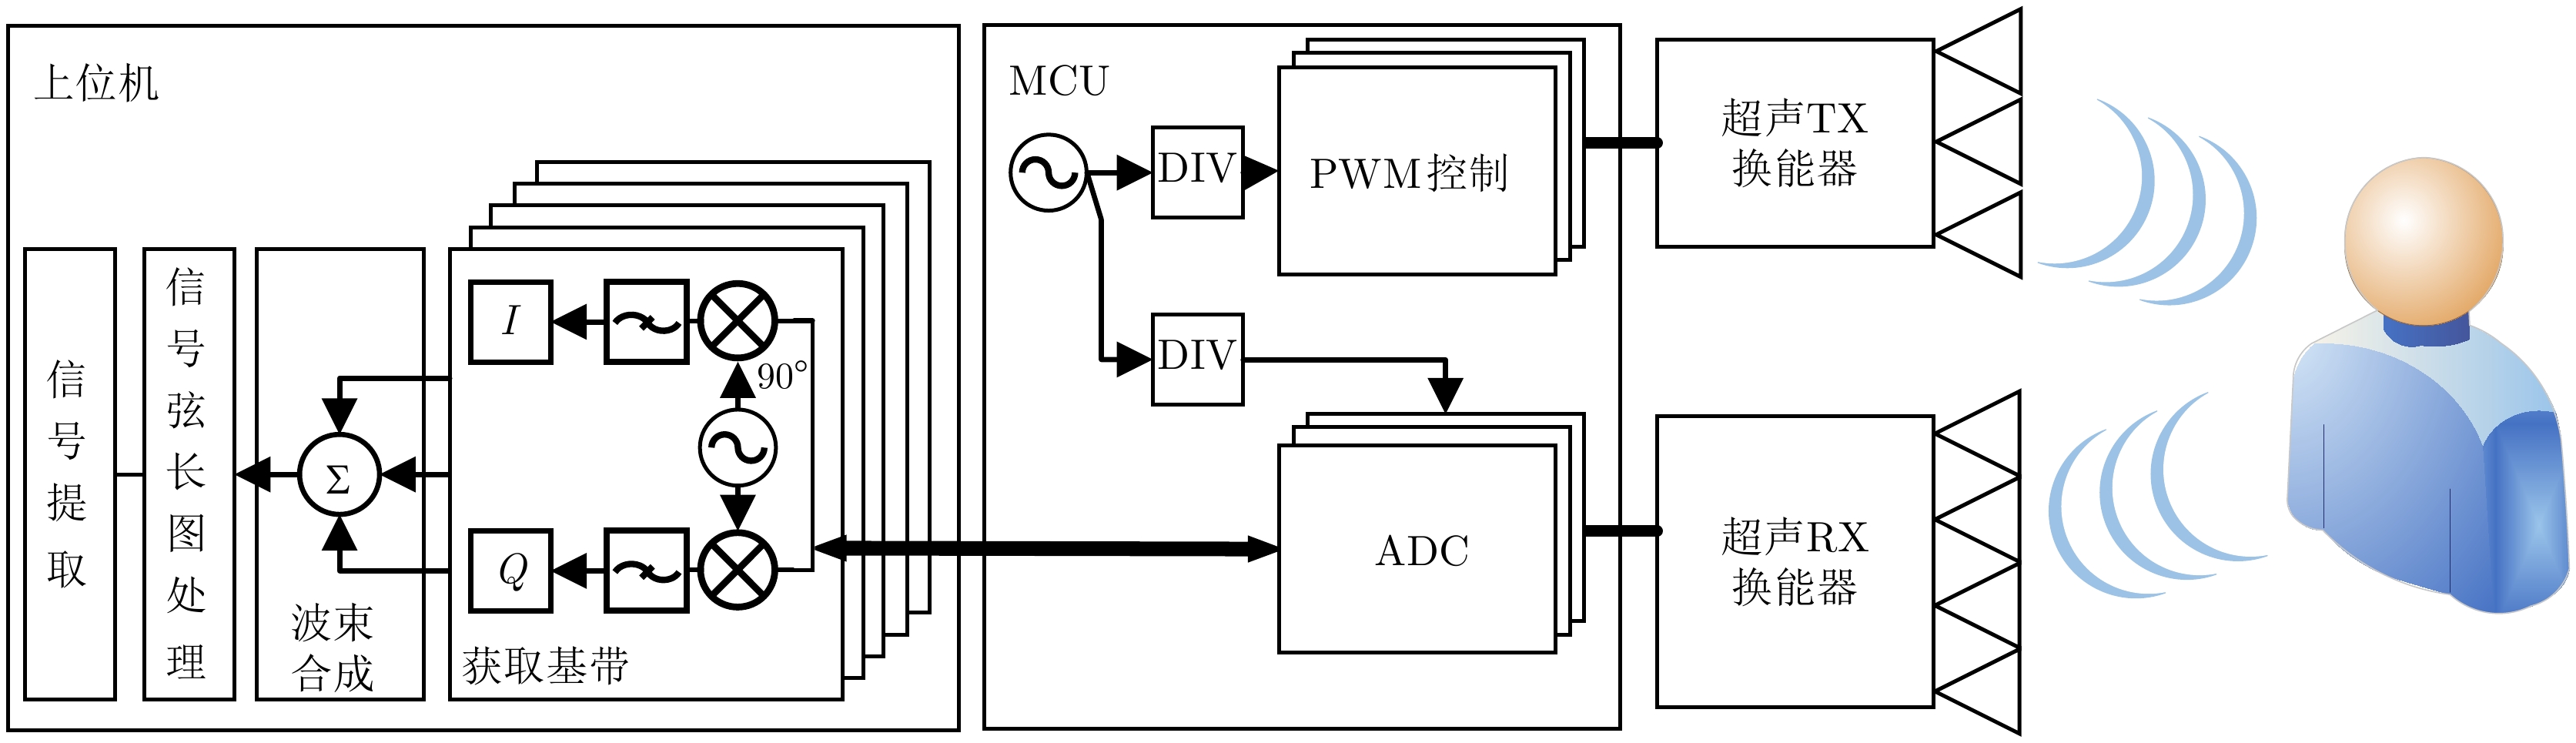
- Figure 2. Schematic of phase resolution error due to DC bias
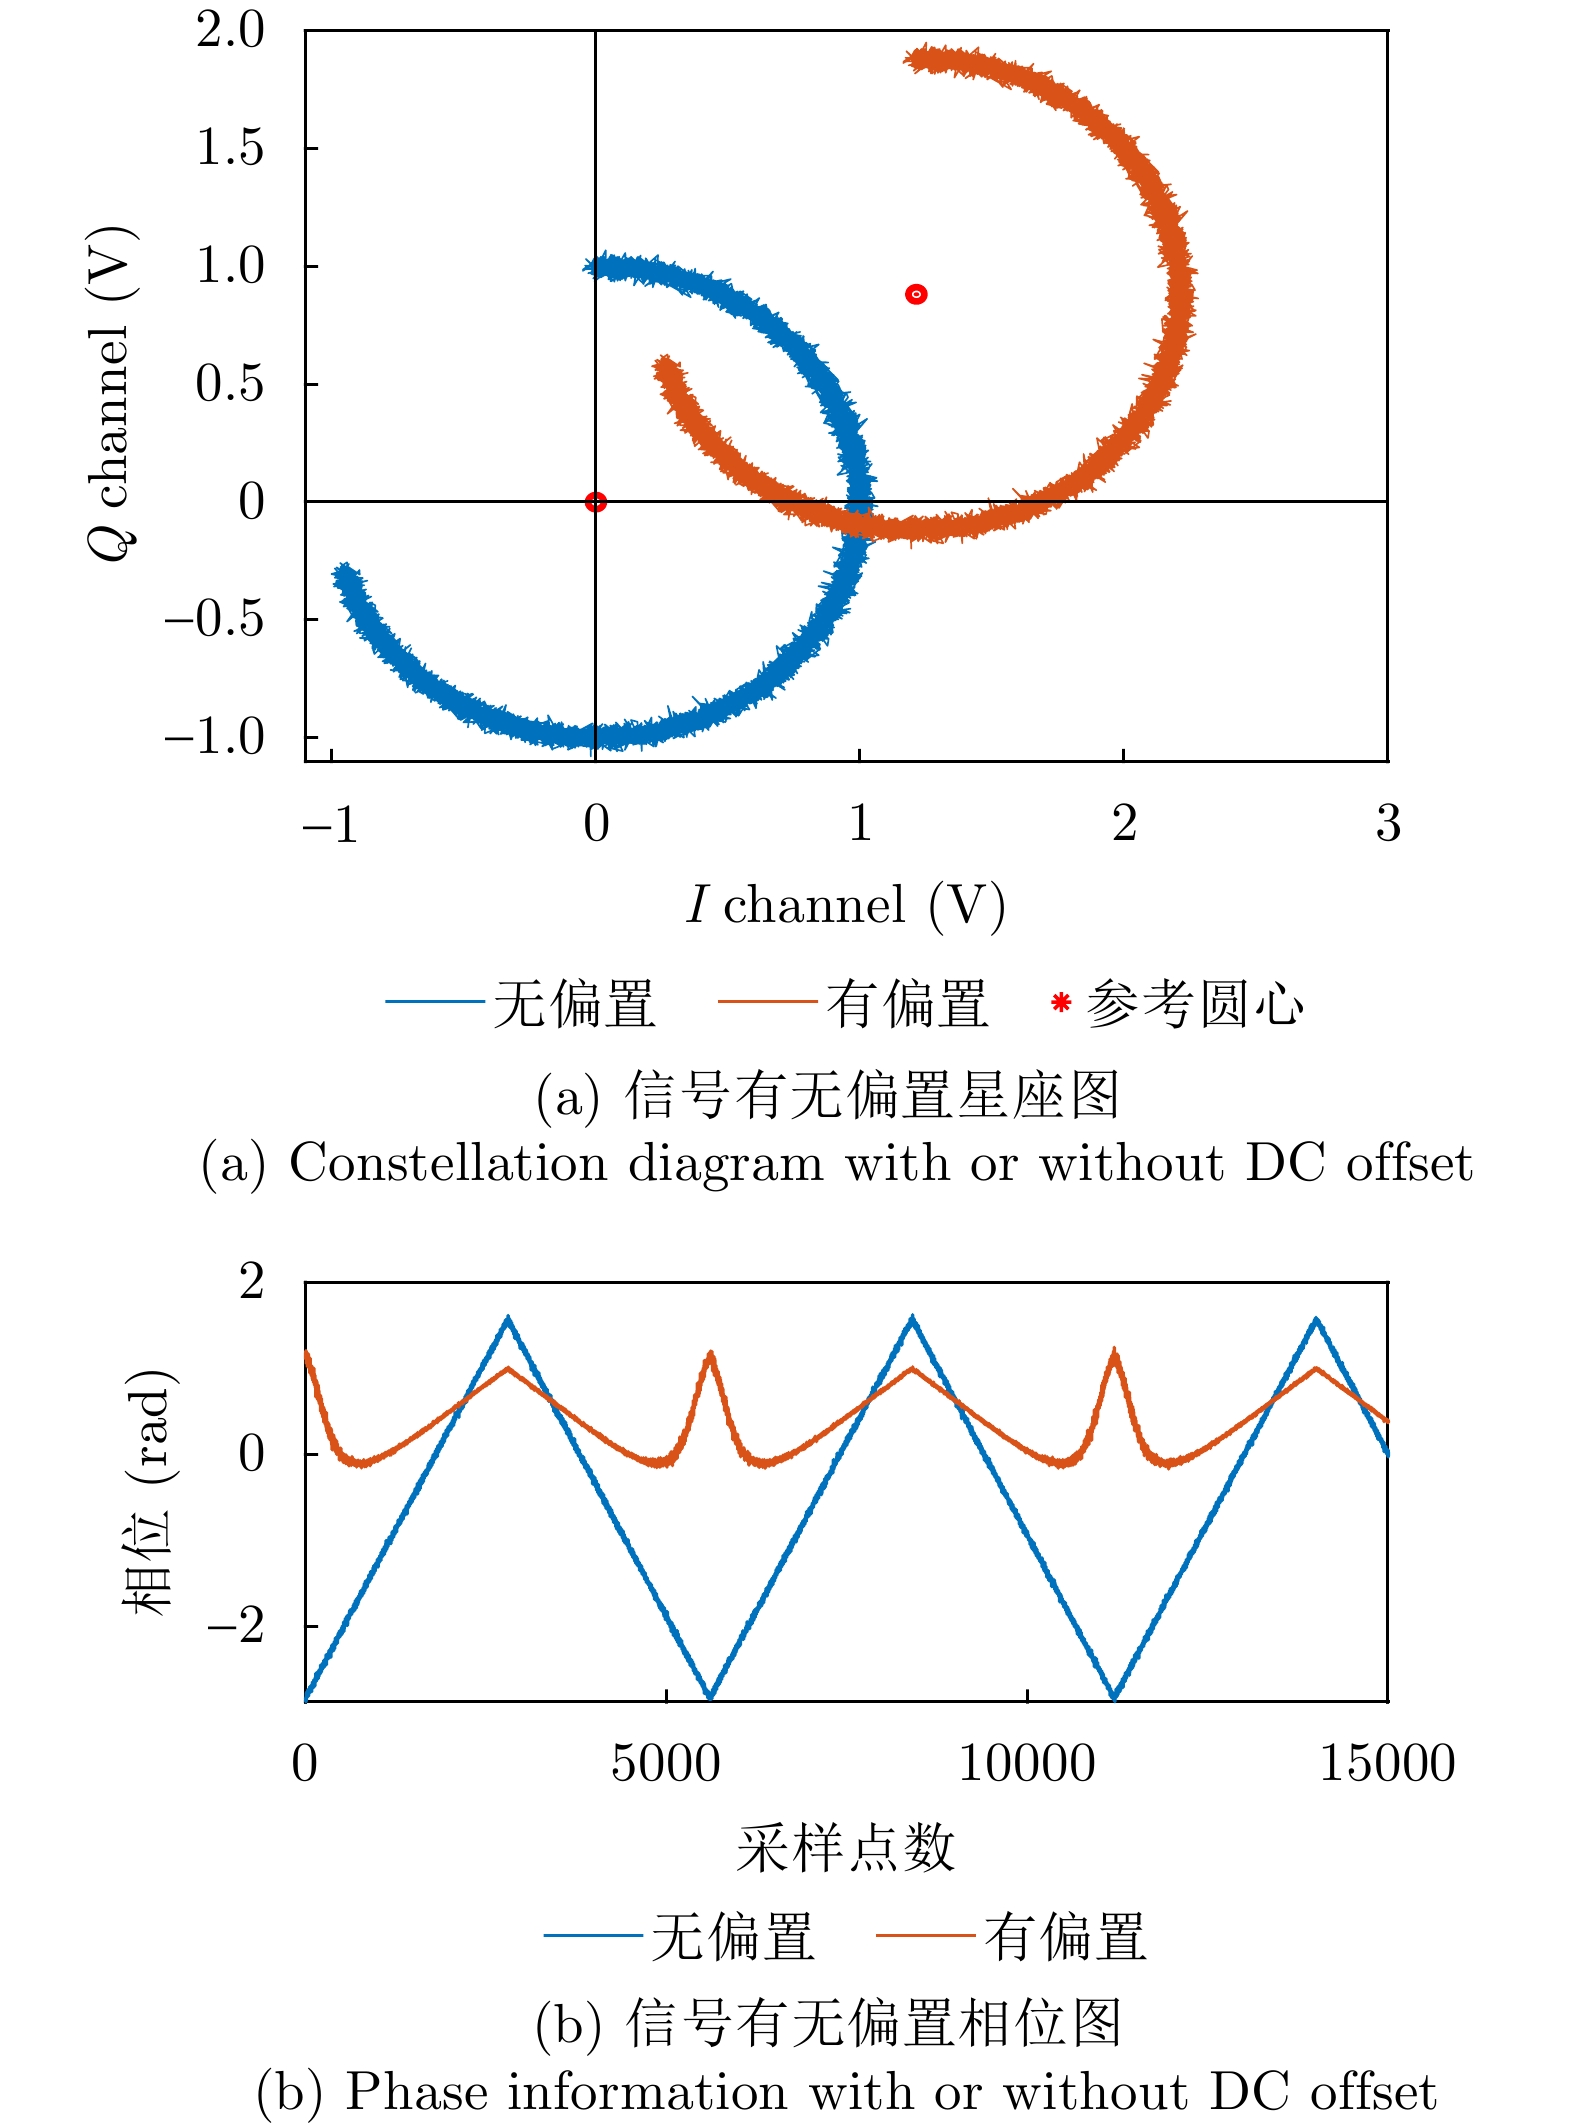
- Figure 3. Constellation diagram depicting the baseband composition of the echo signal
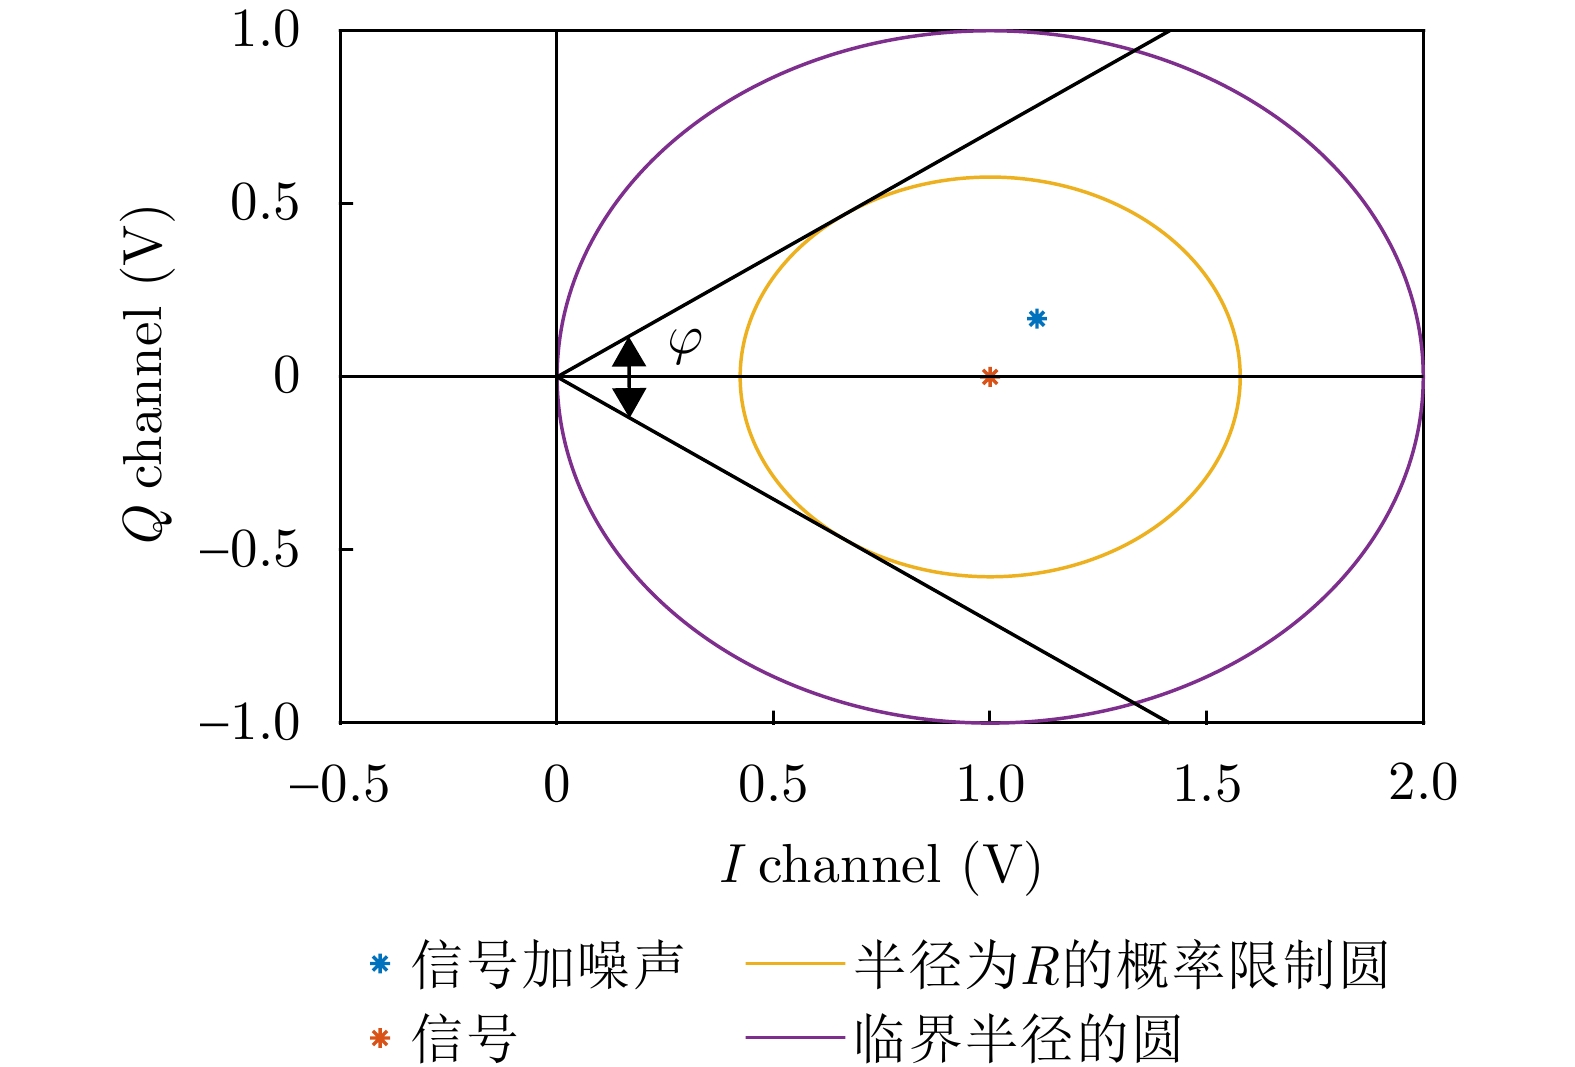
- Figure 4. Schematic of demodulation error in phase demodulation of noise-containing signals
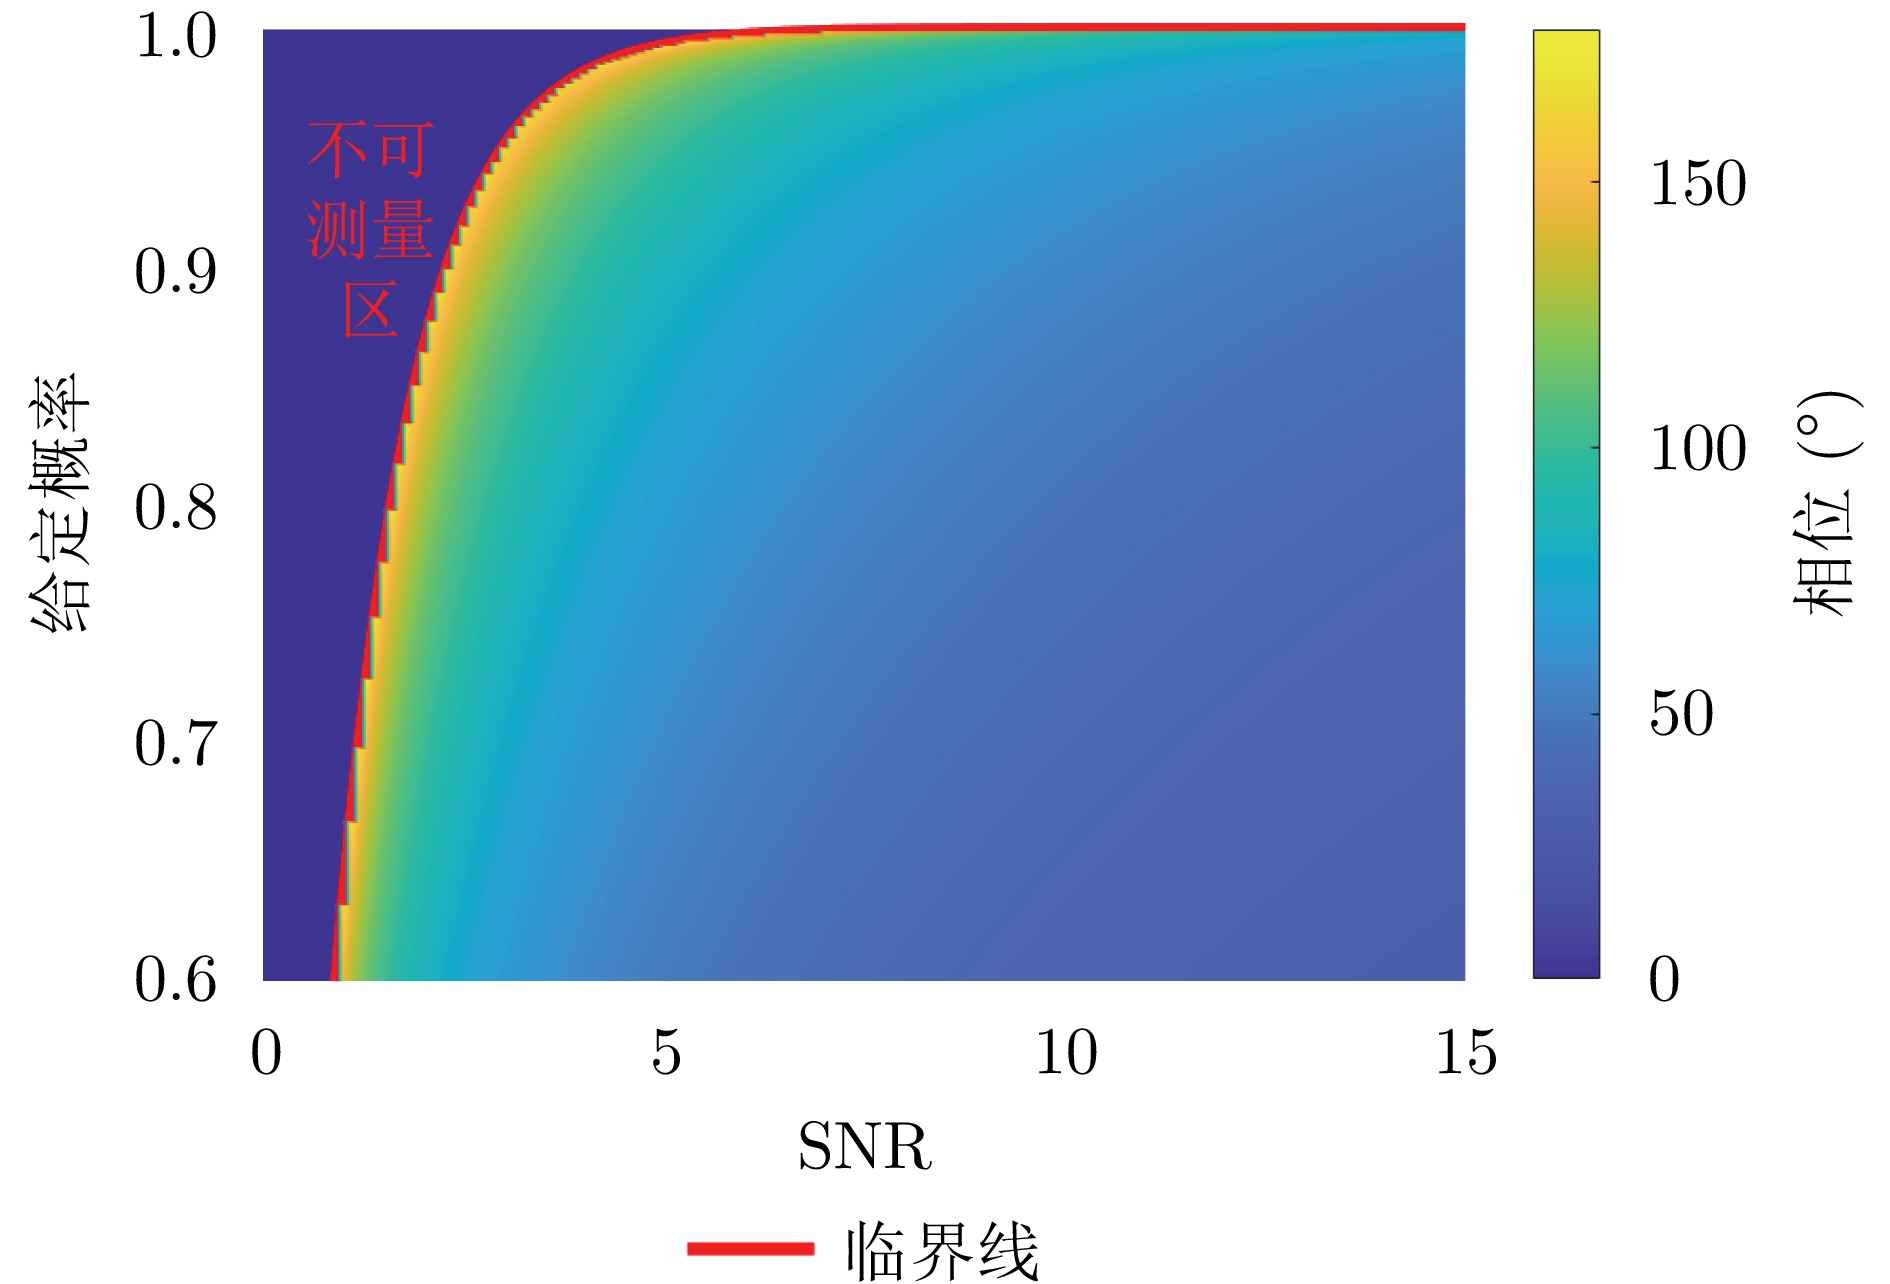
- Figure 5. The minimum measurable phase difference for a given SNR and probability of correct demodulation
- Figure 6. Framework of U-Sodar hardware system
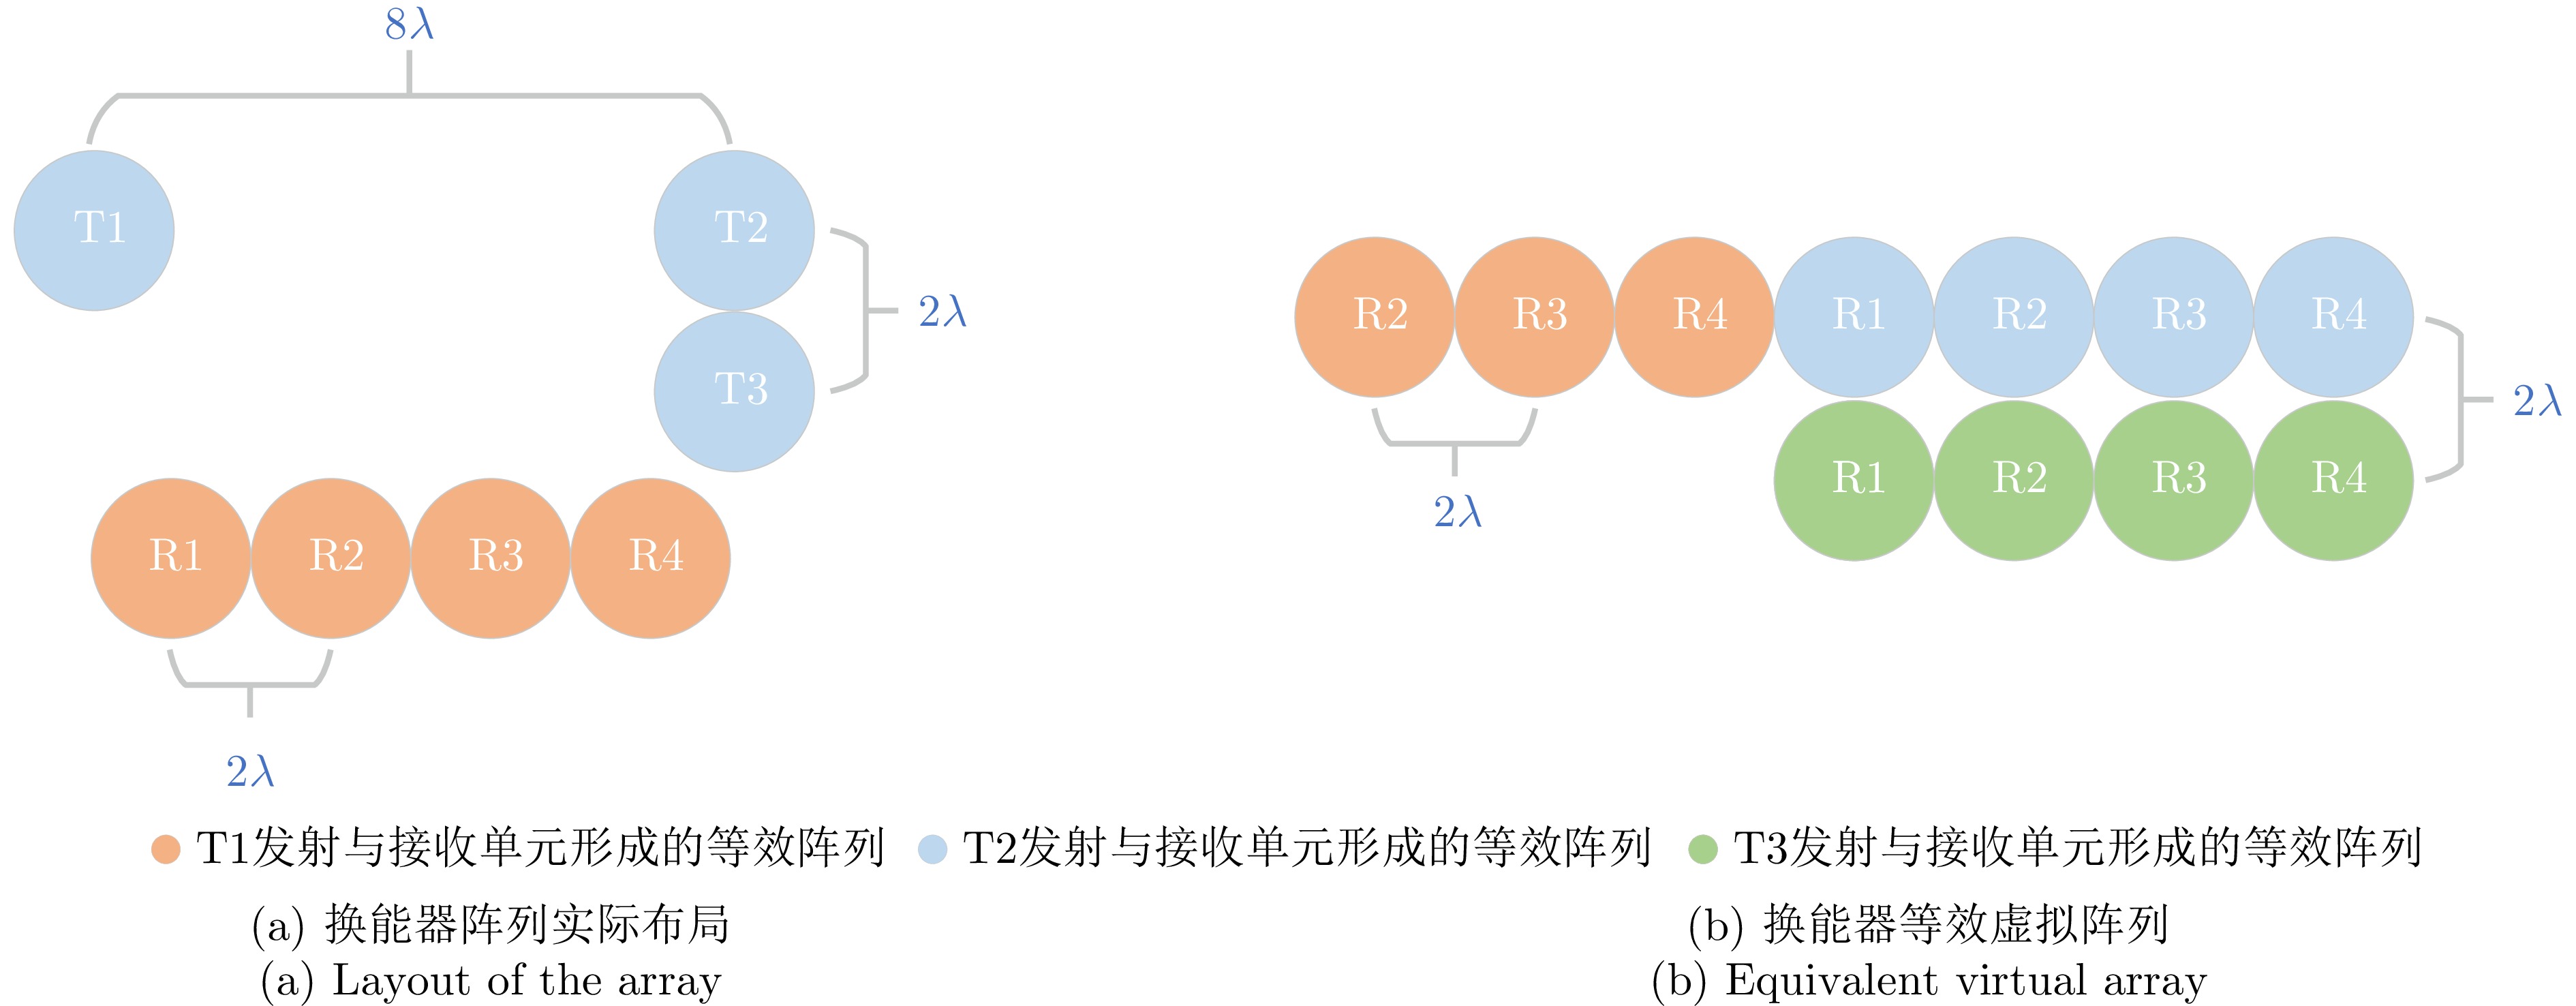
- Figure 7. Transducer array layout
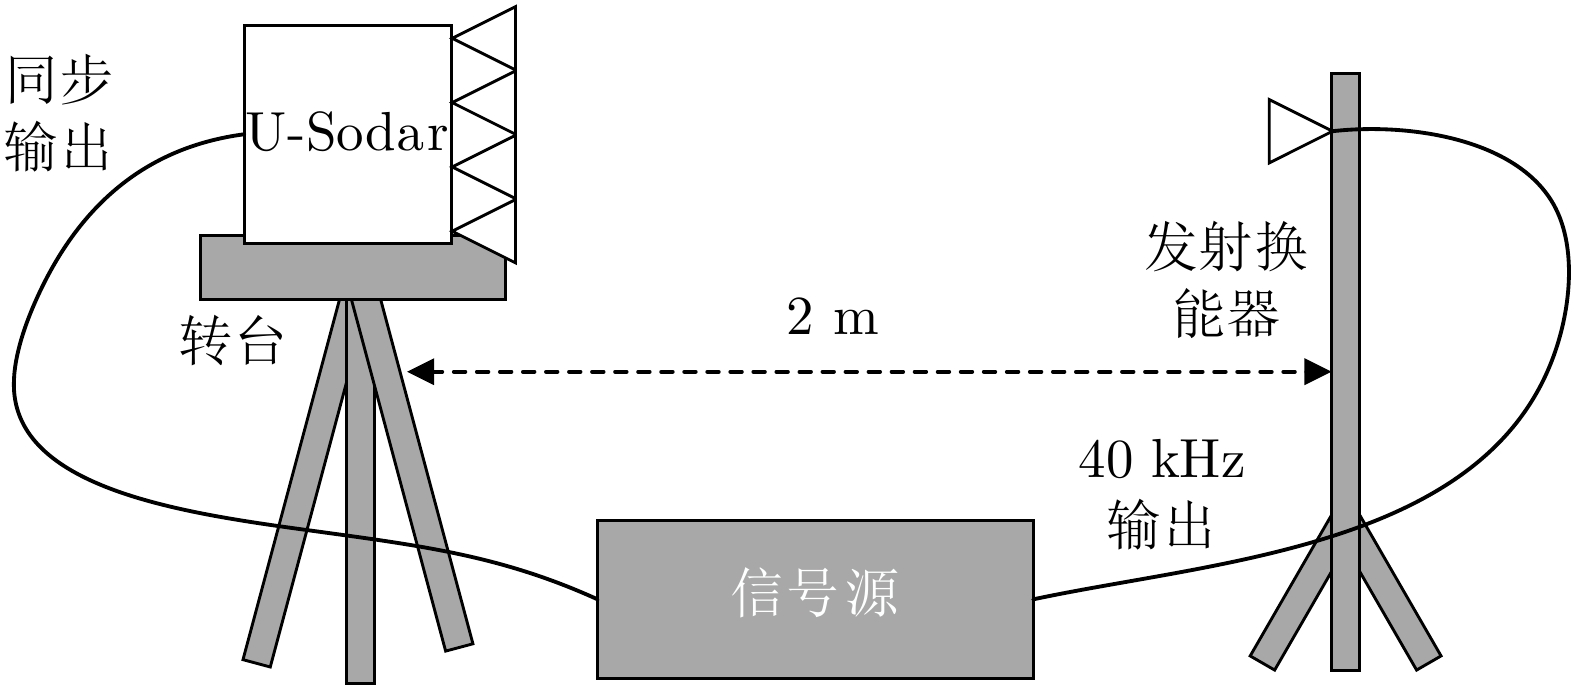
- Figure 8. Arrangement of the test scene for U-Sodar directional diagram testing
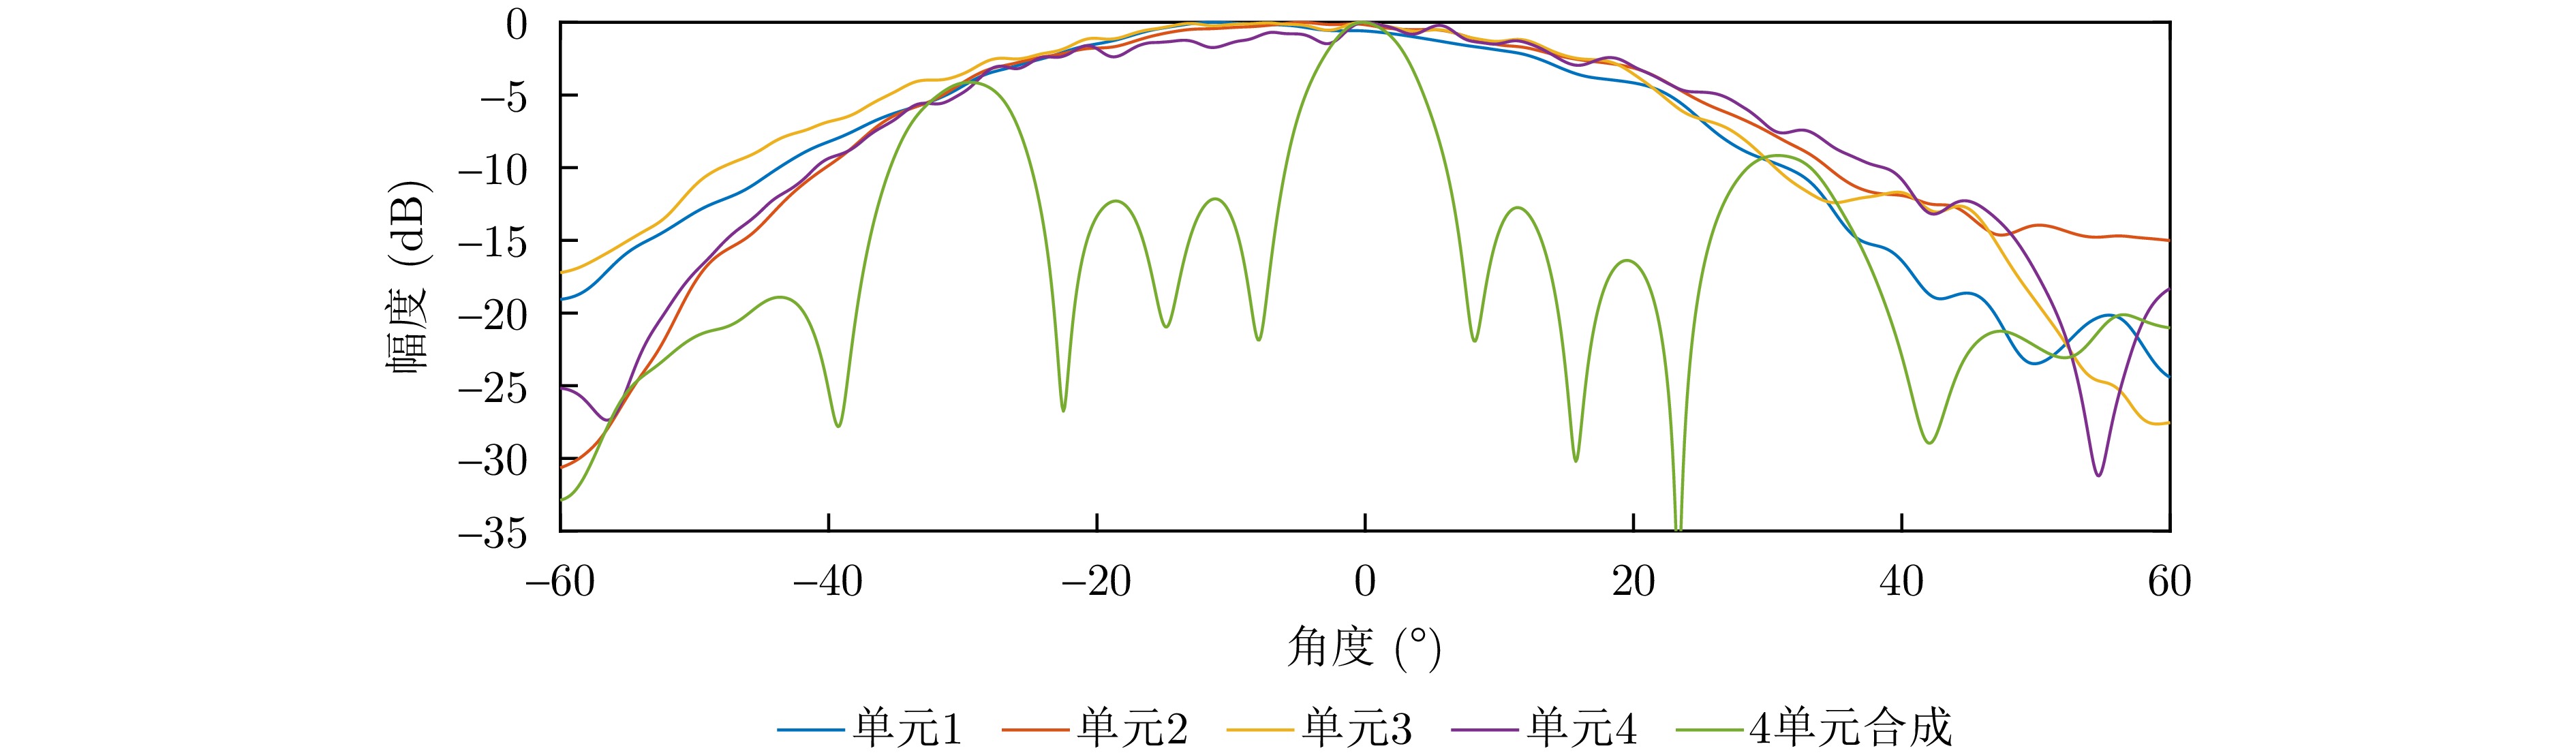
- Figure 9. Test results of directional map
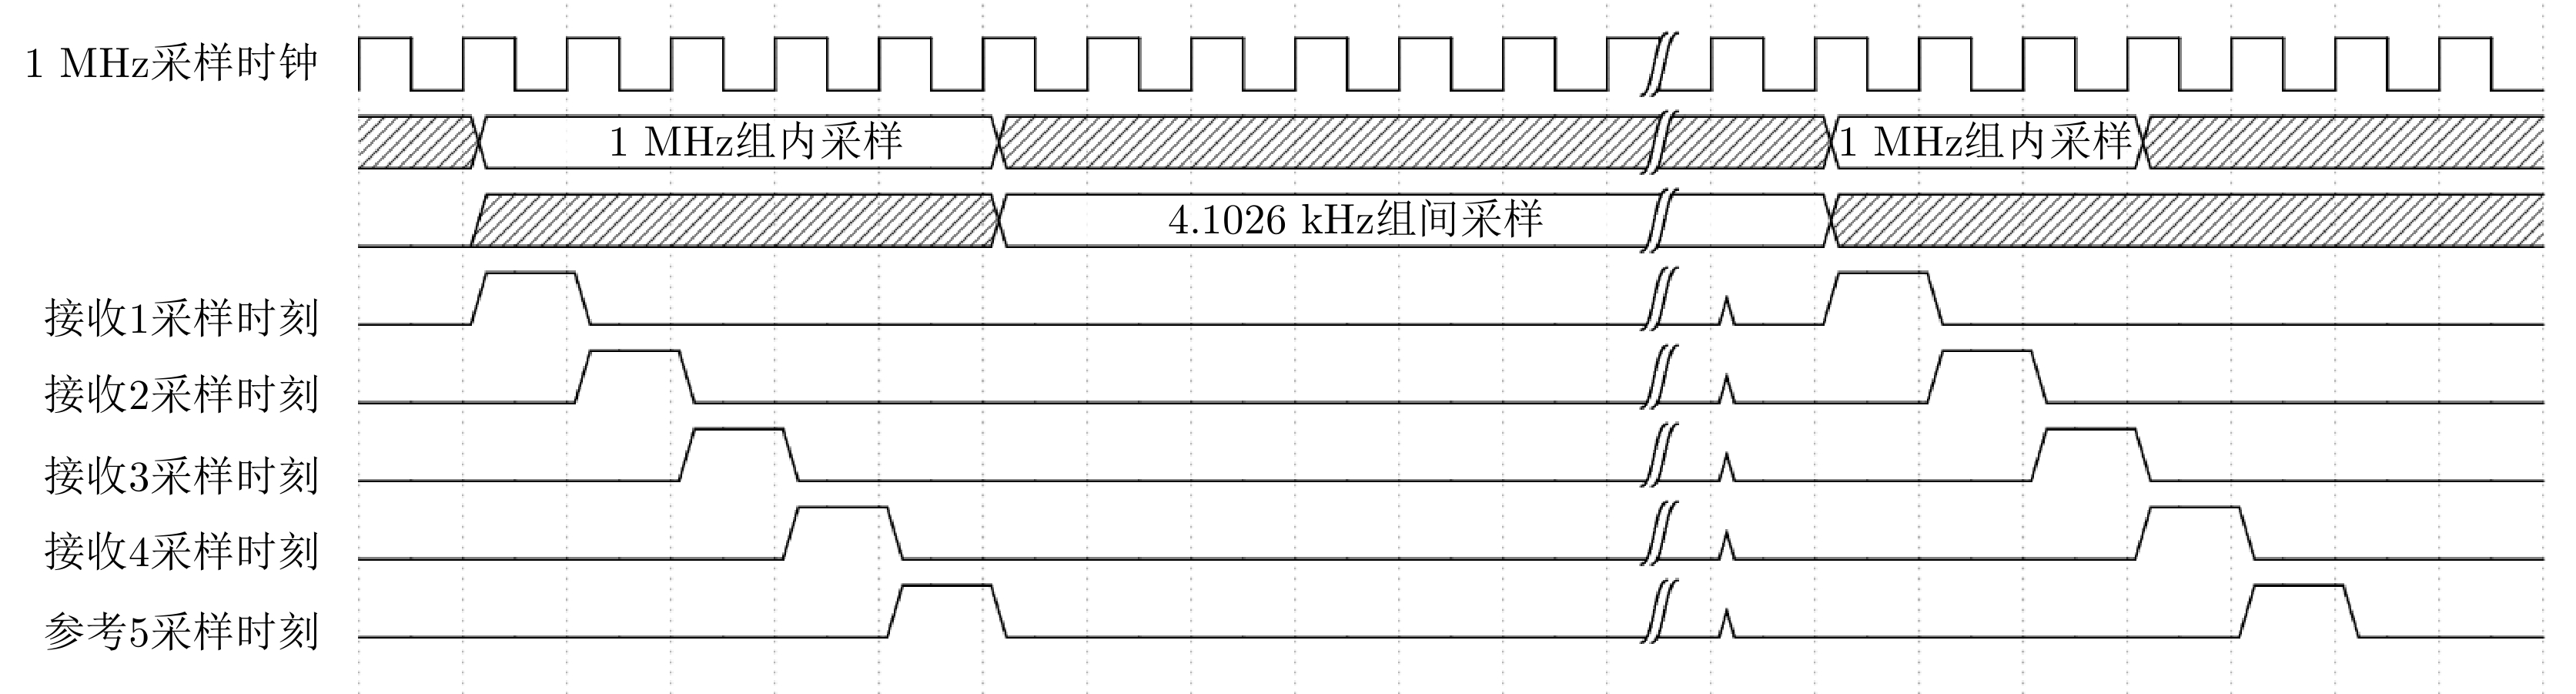
- Figure 10. Sampling multiplexing timing sequence diagram
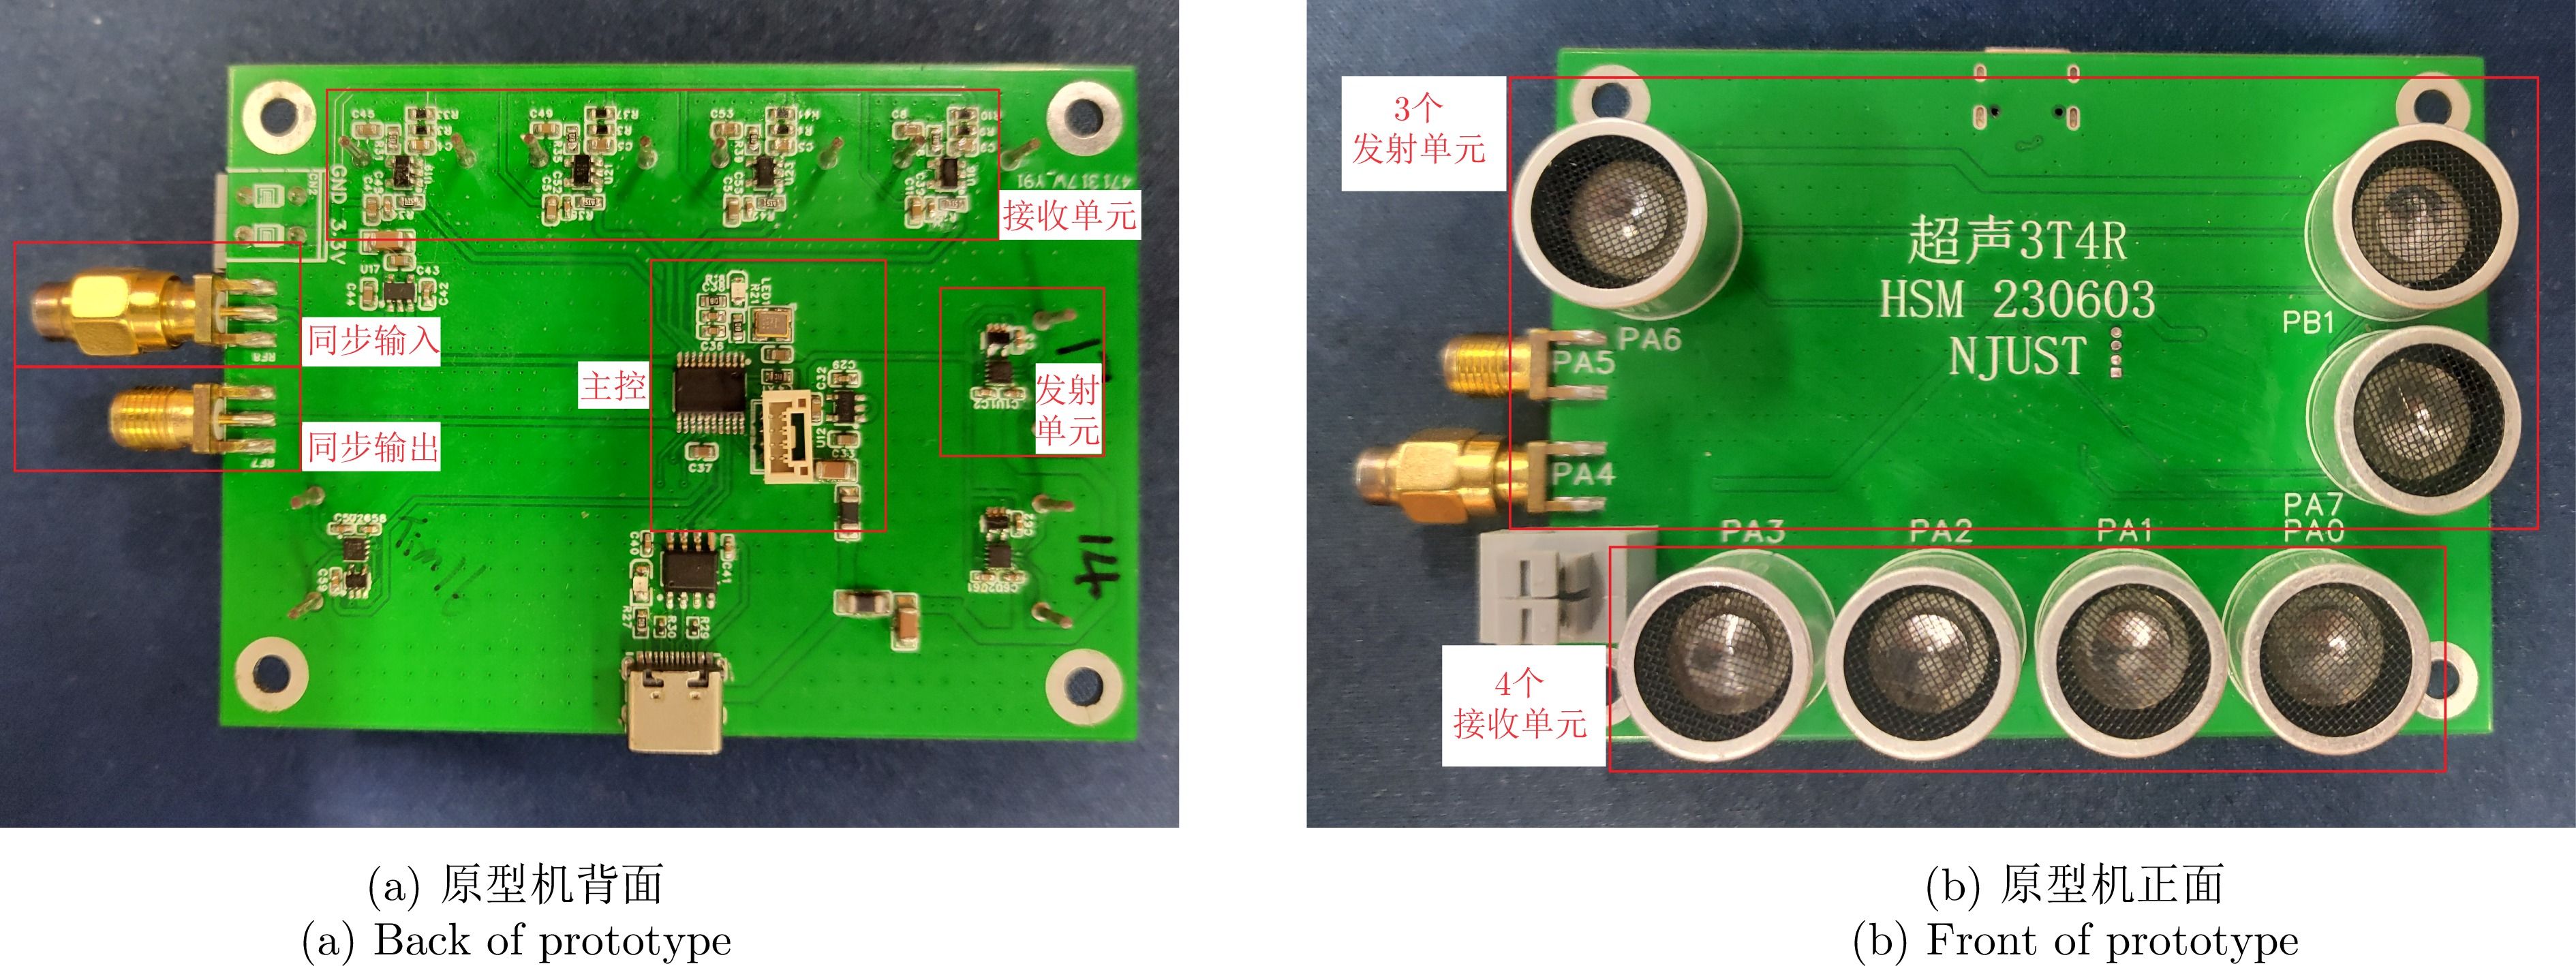
- Figure 11. U-Sodar prototype
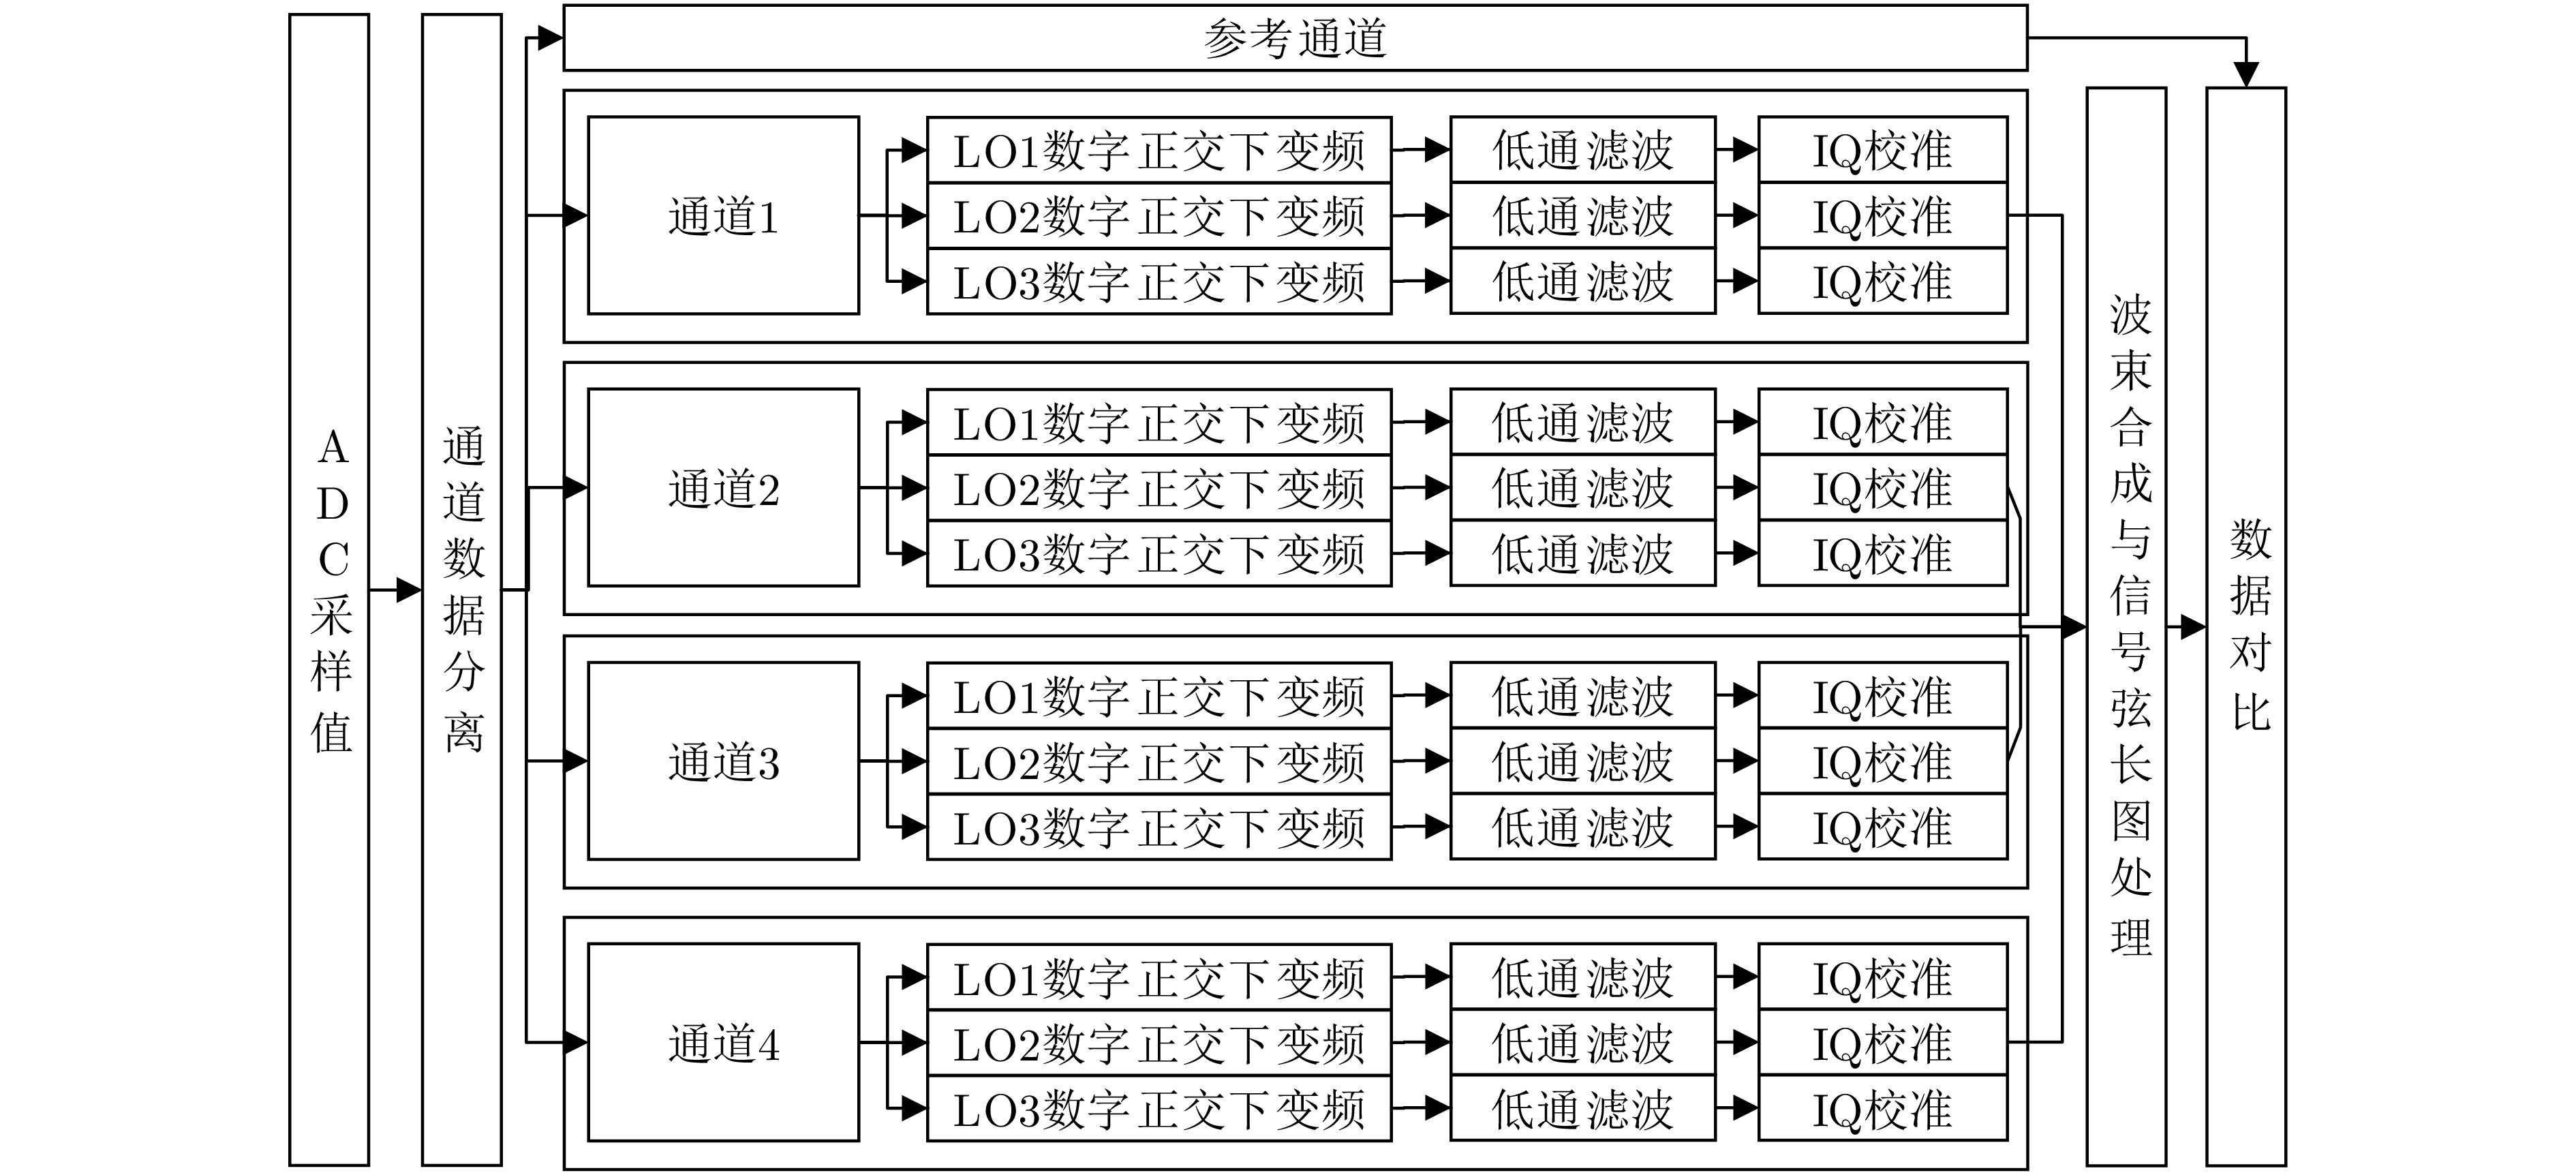
- Figure 12. Flowchart of U-Sodar signal processing
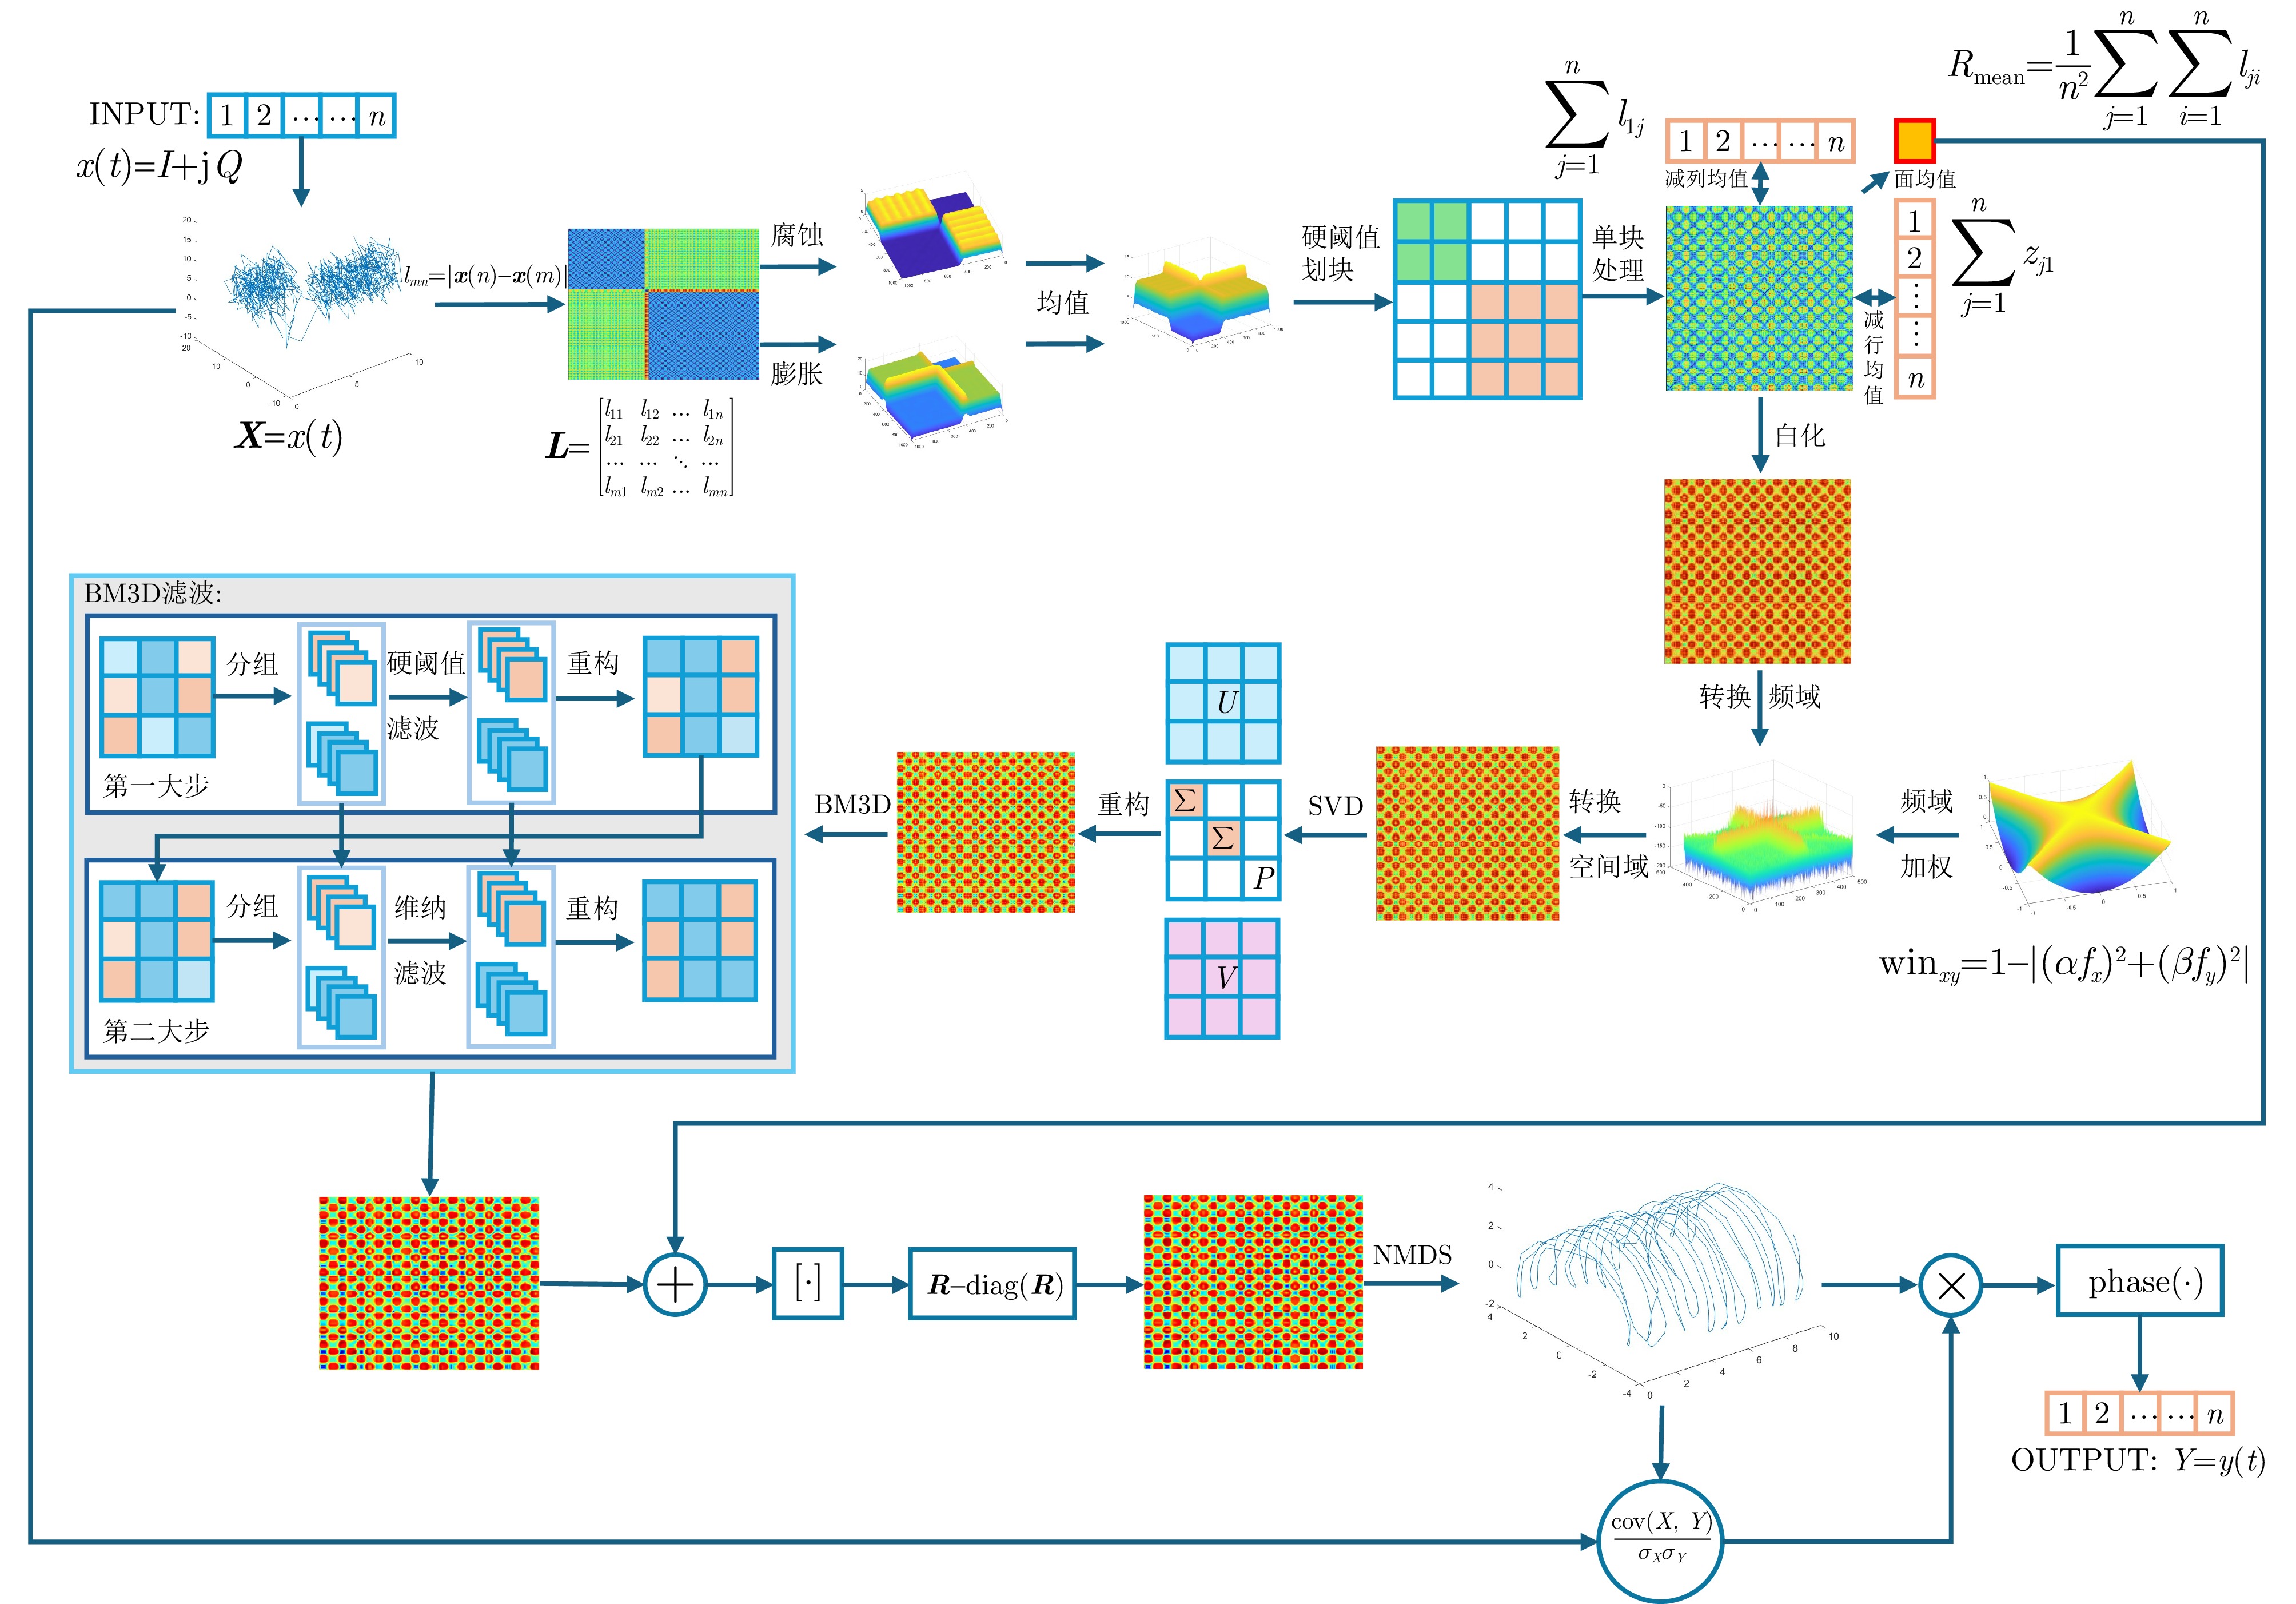
- Figure 13. Flowchart of the chord length graph algorithm
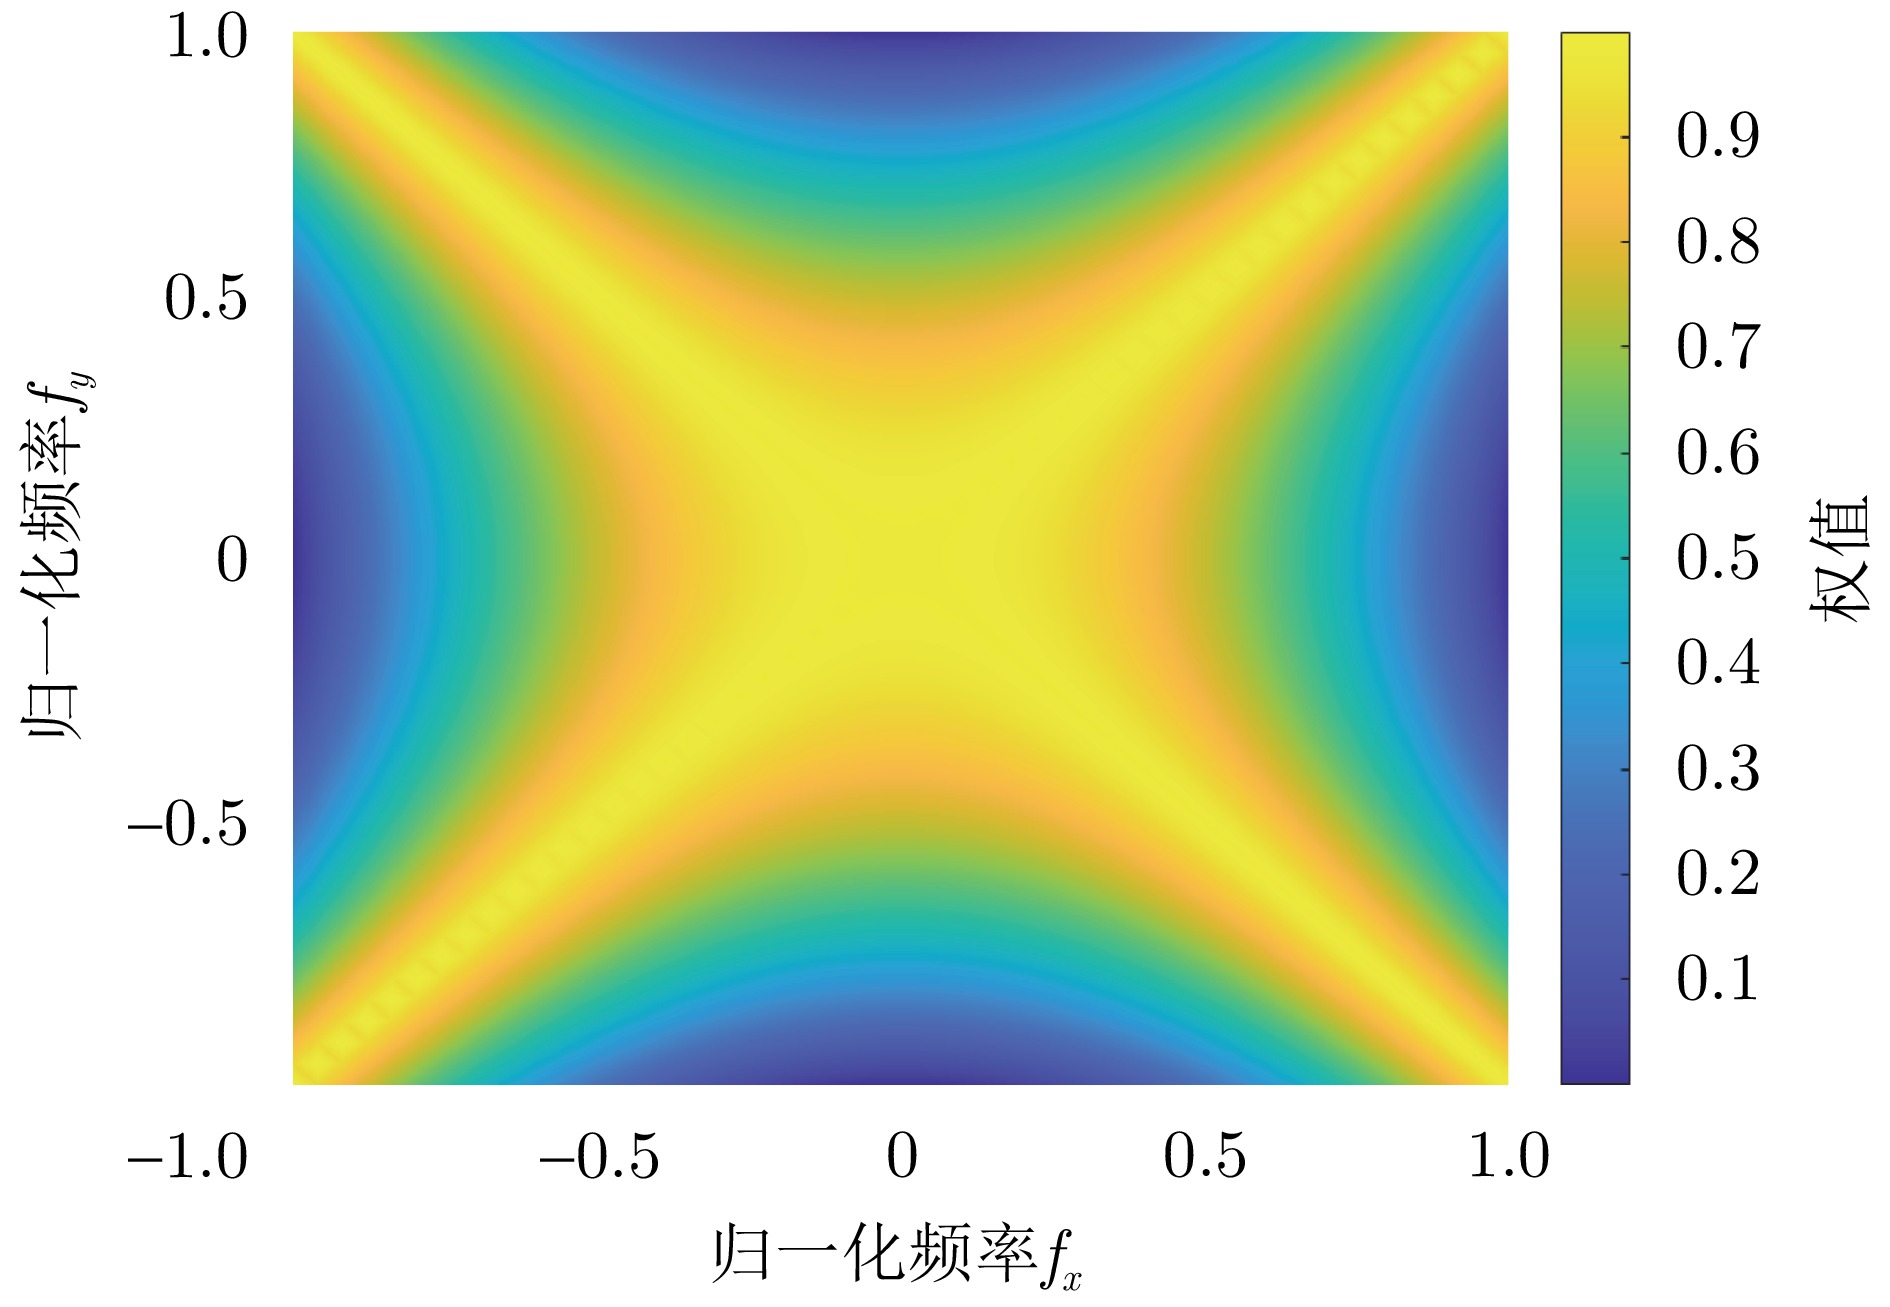
- Figure 14. Weighting map for frequency domain weighting
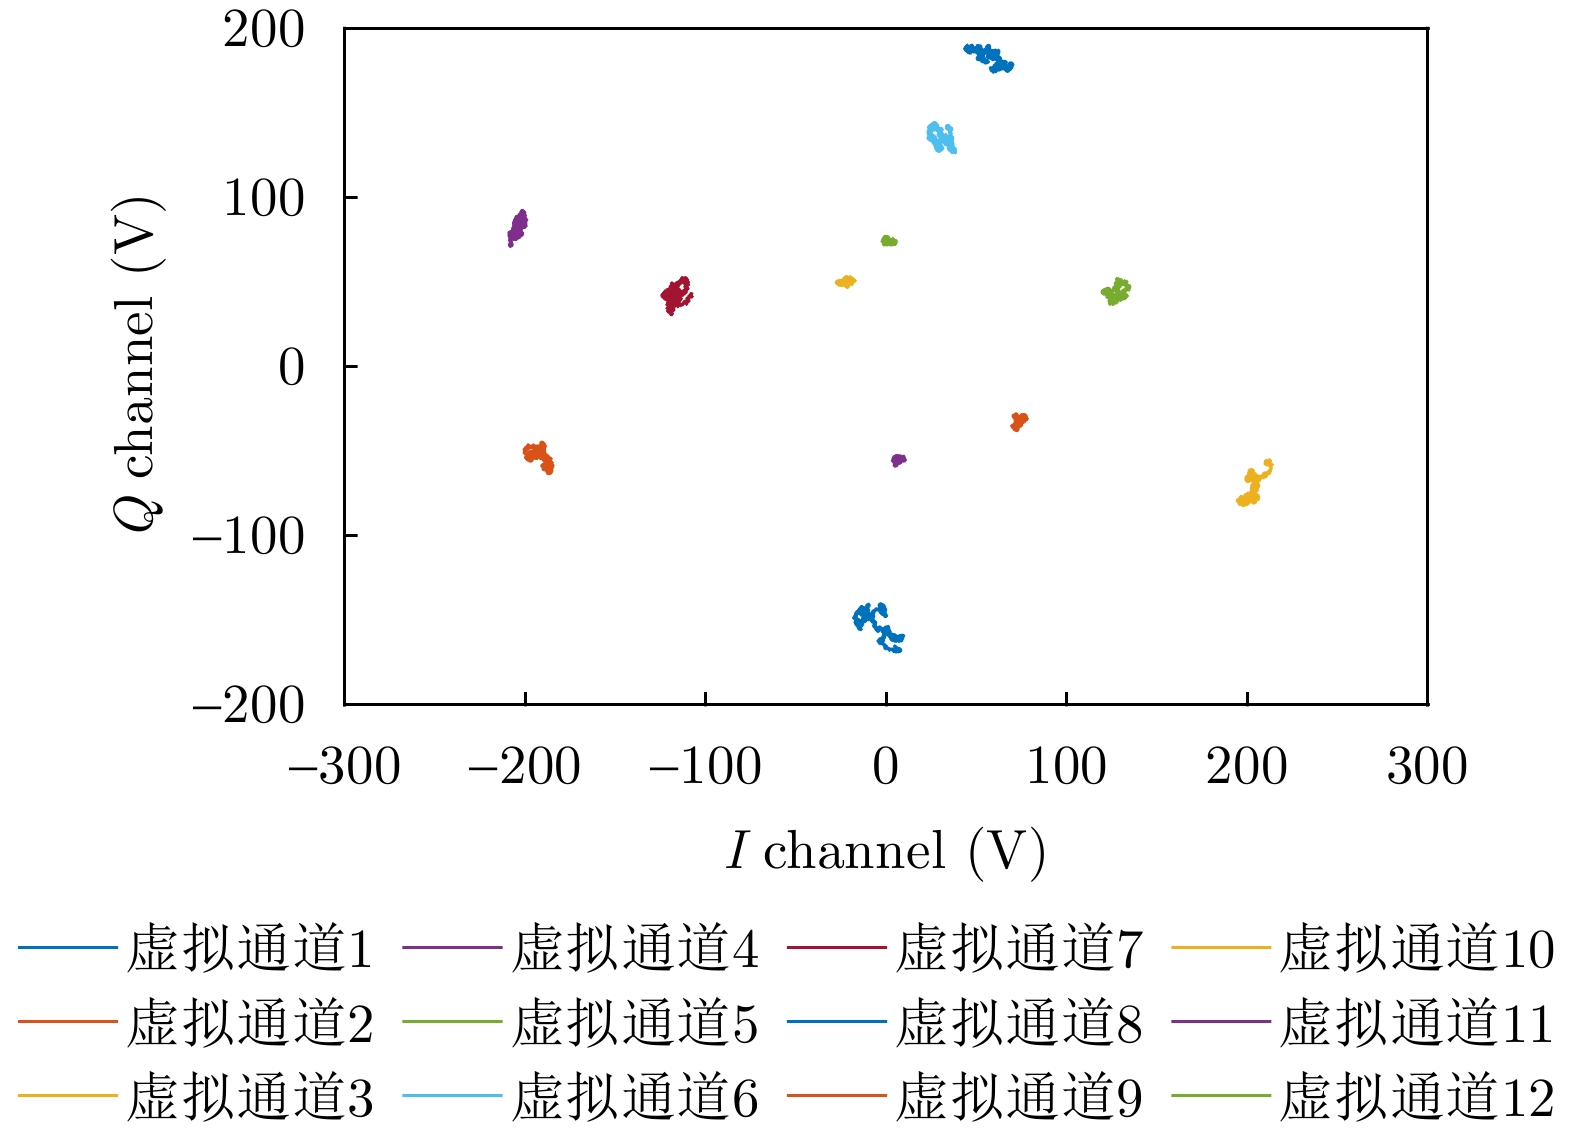
- Figure 15. Measurement of stationary wall signal vector diagram for each channel
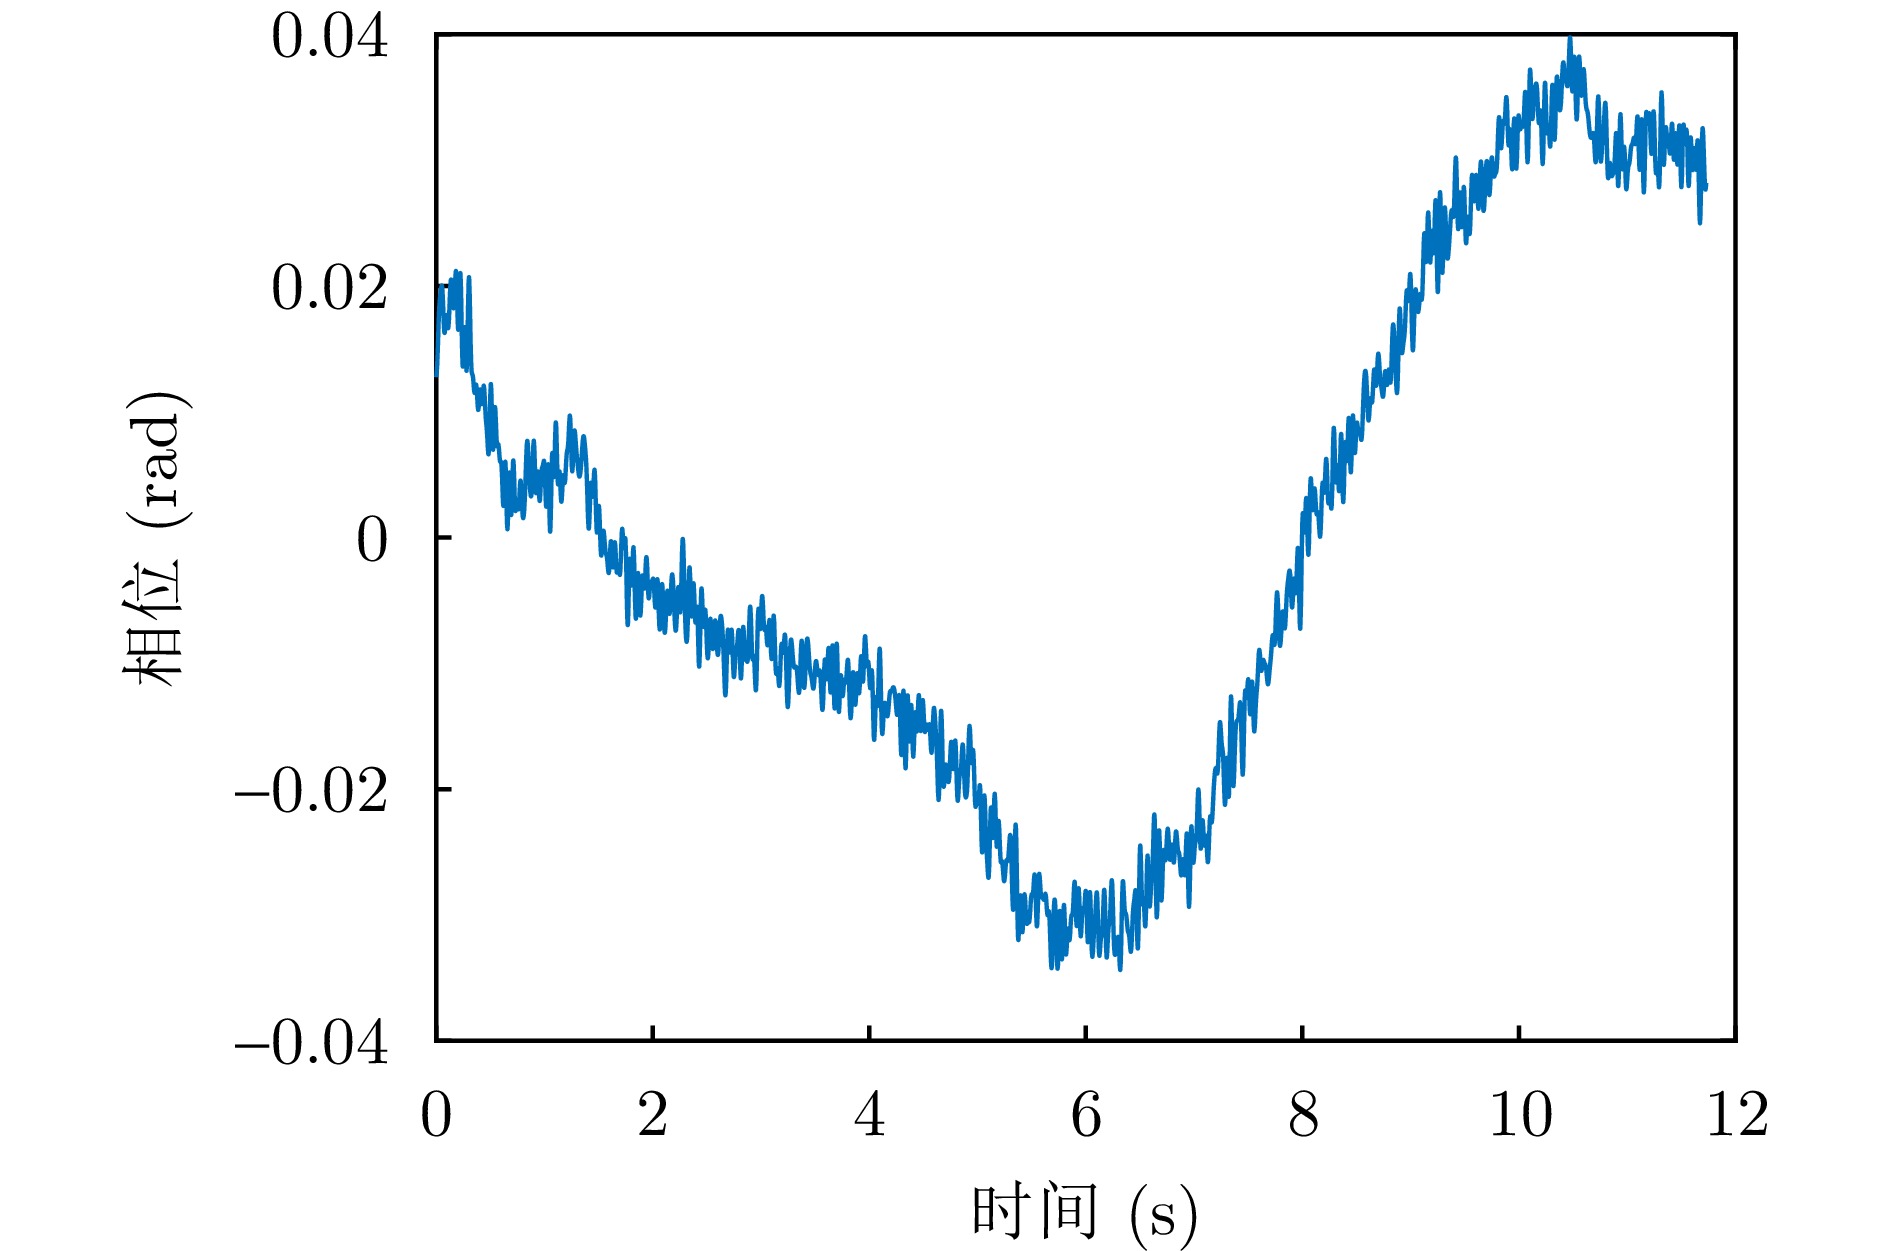
- Figure 16. Fusion phase information output
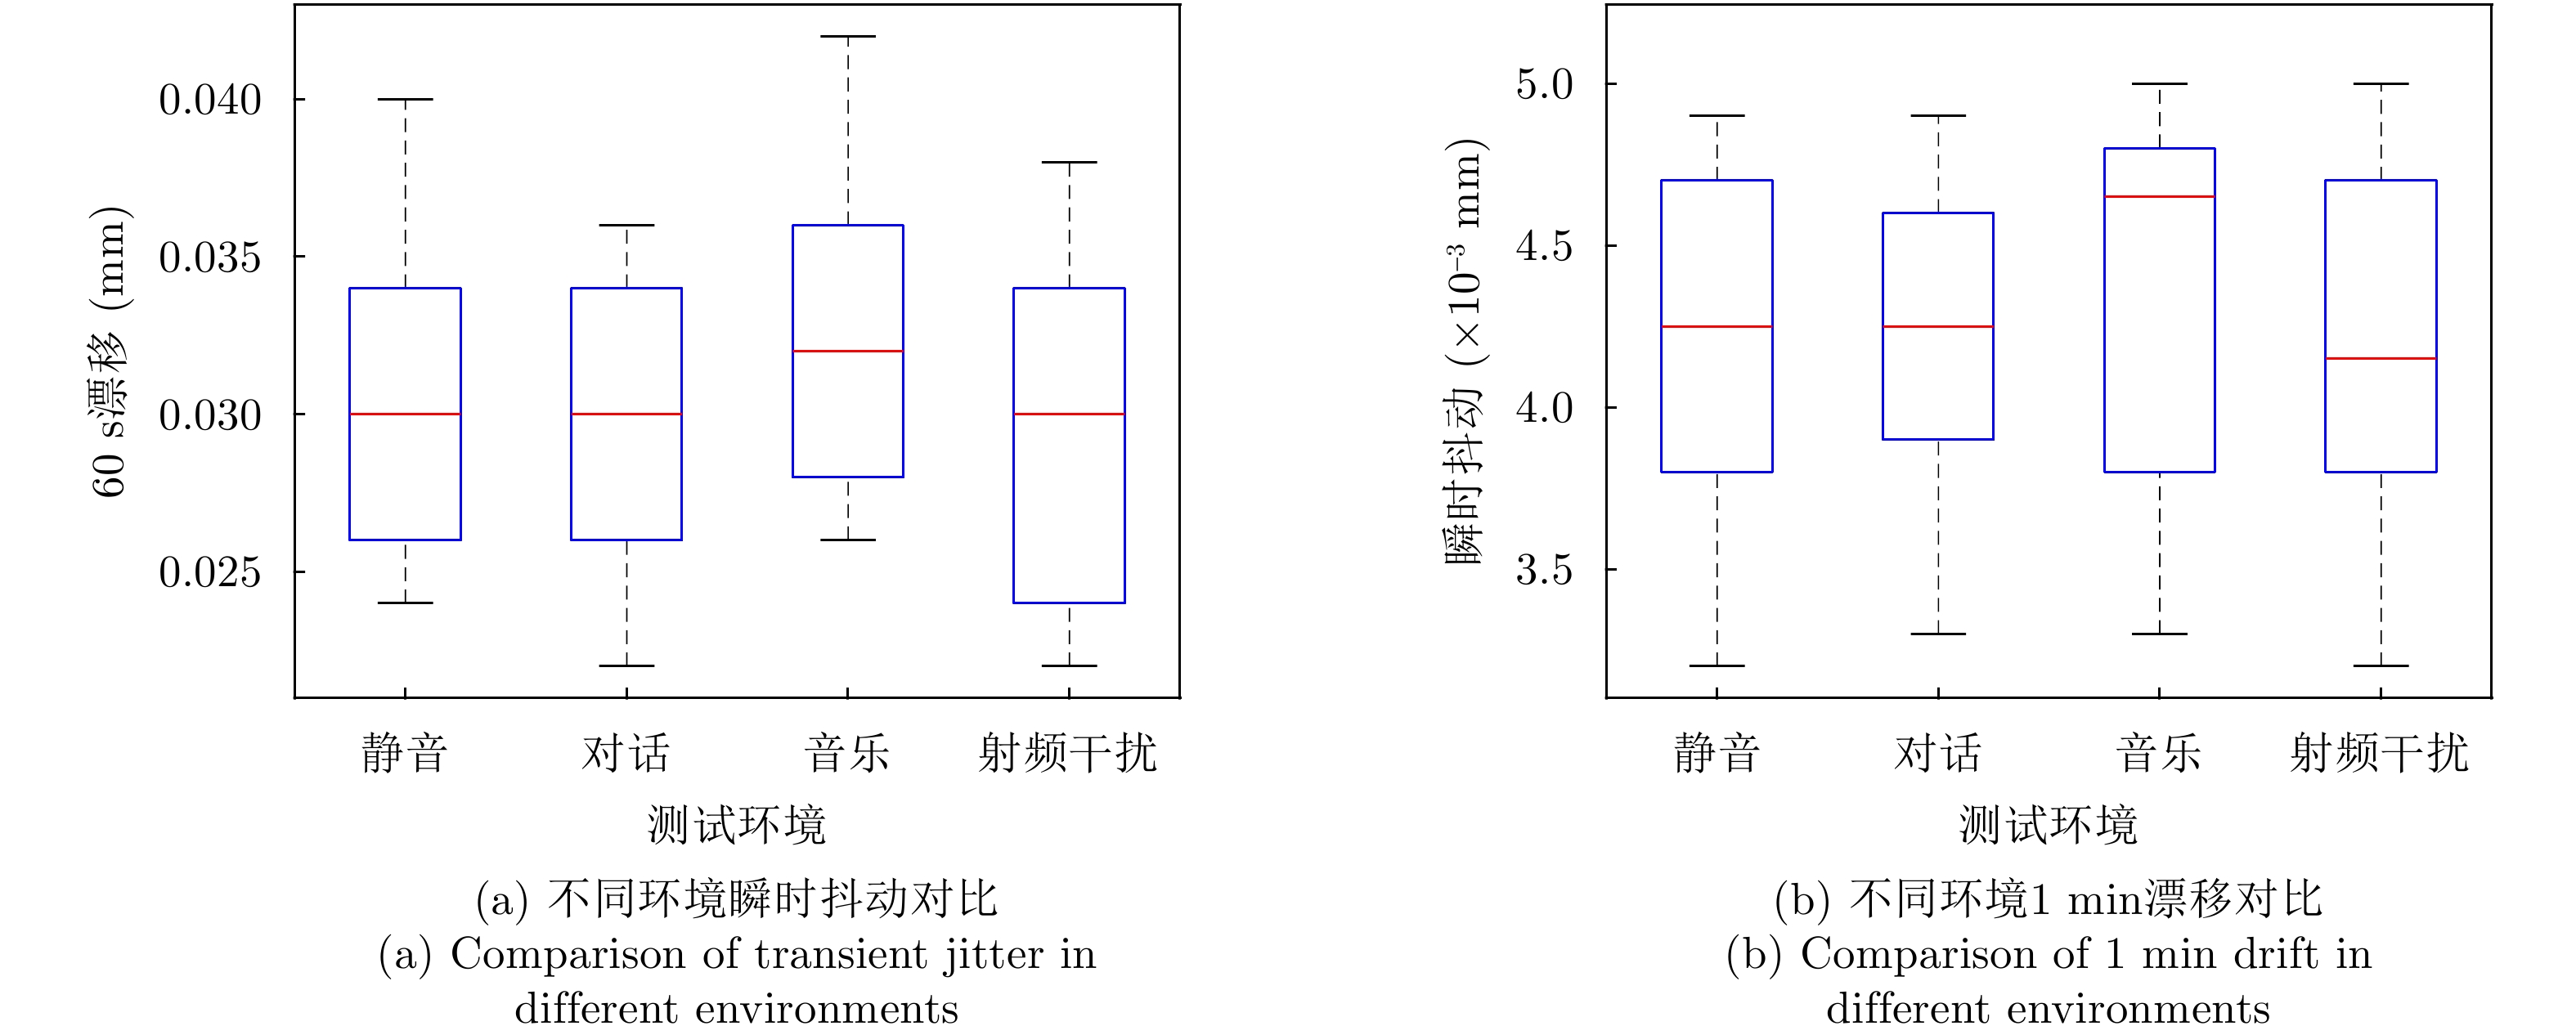
- Figure 17. Performance comparison in different environments
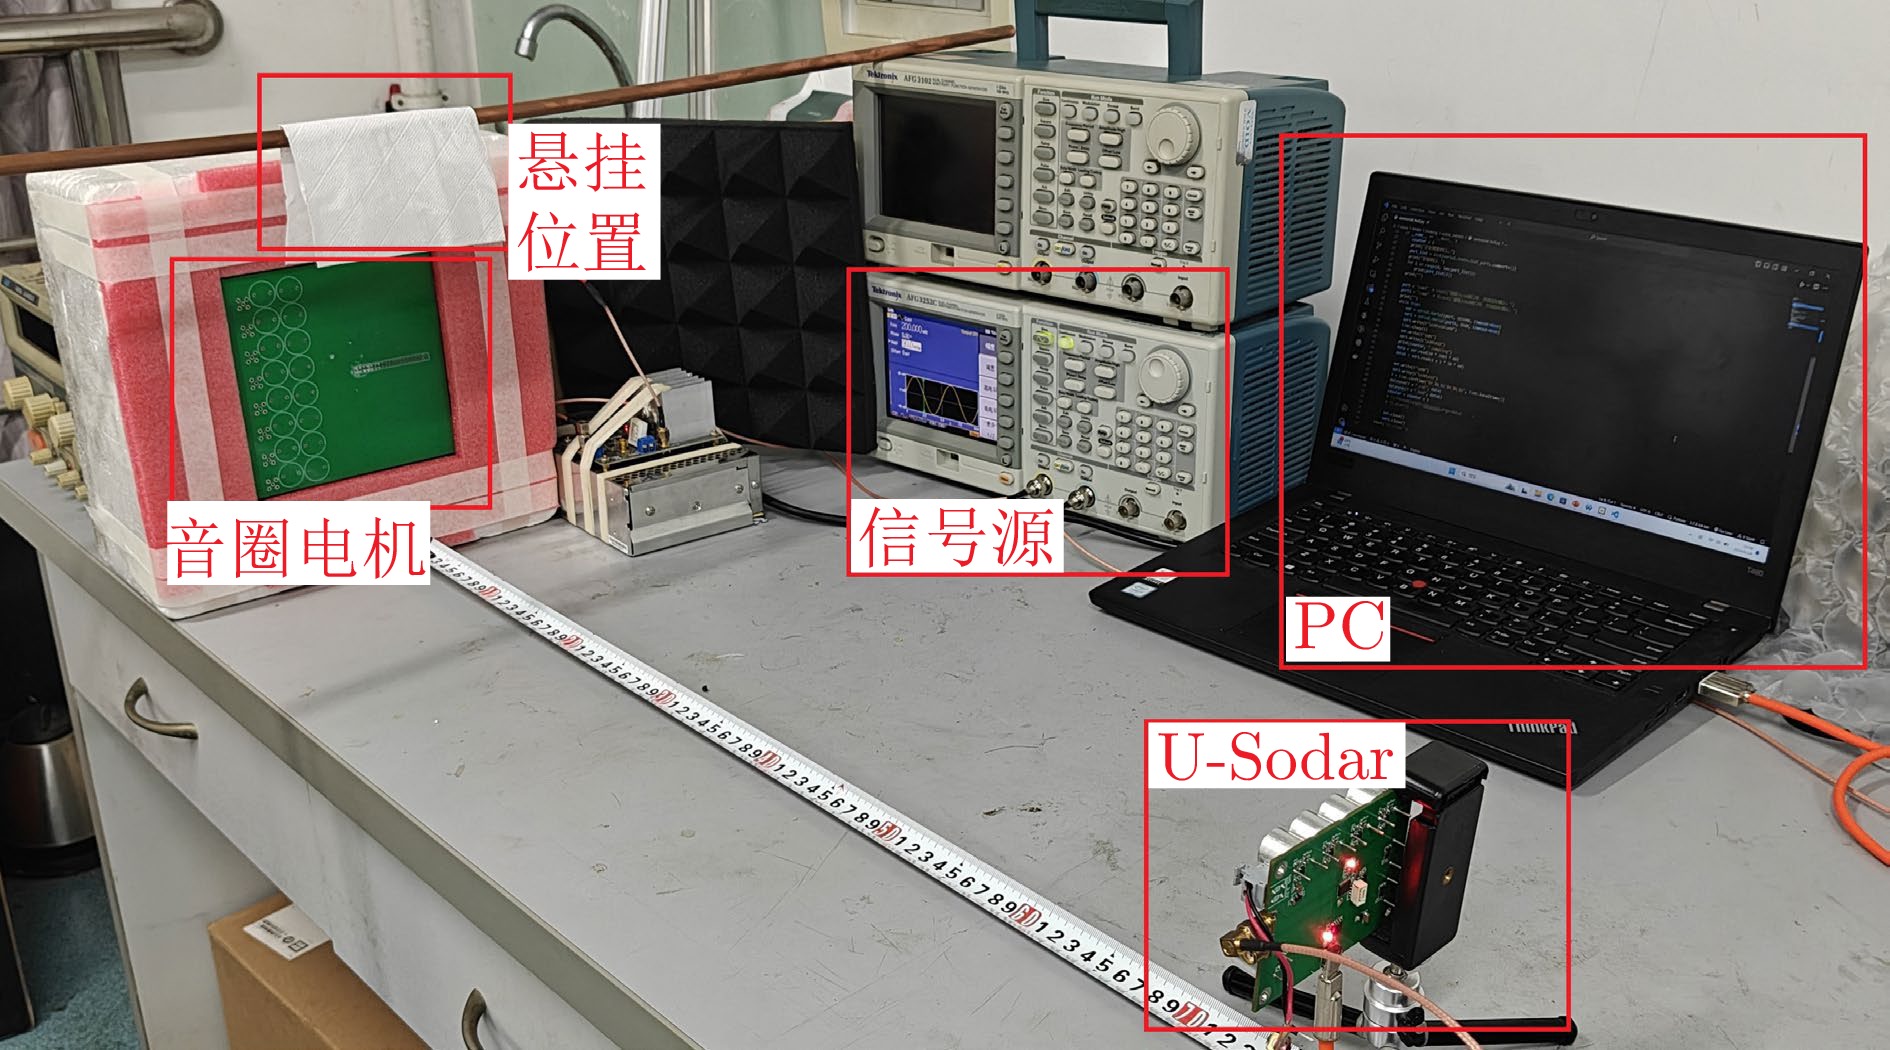
- Figure 18. Penetration test scenario
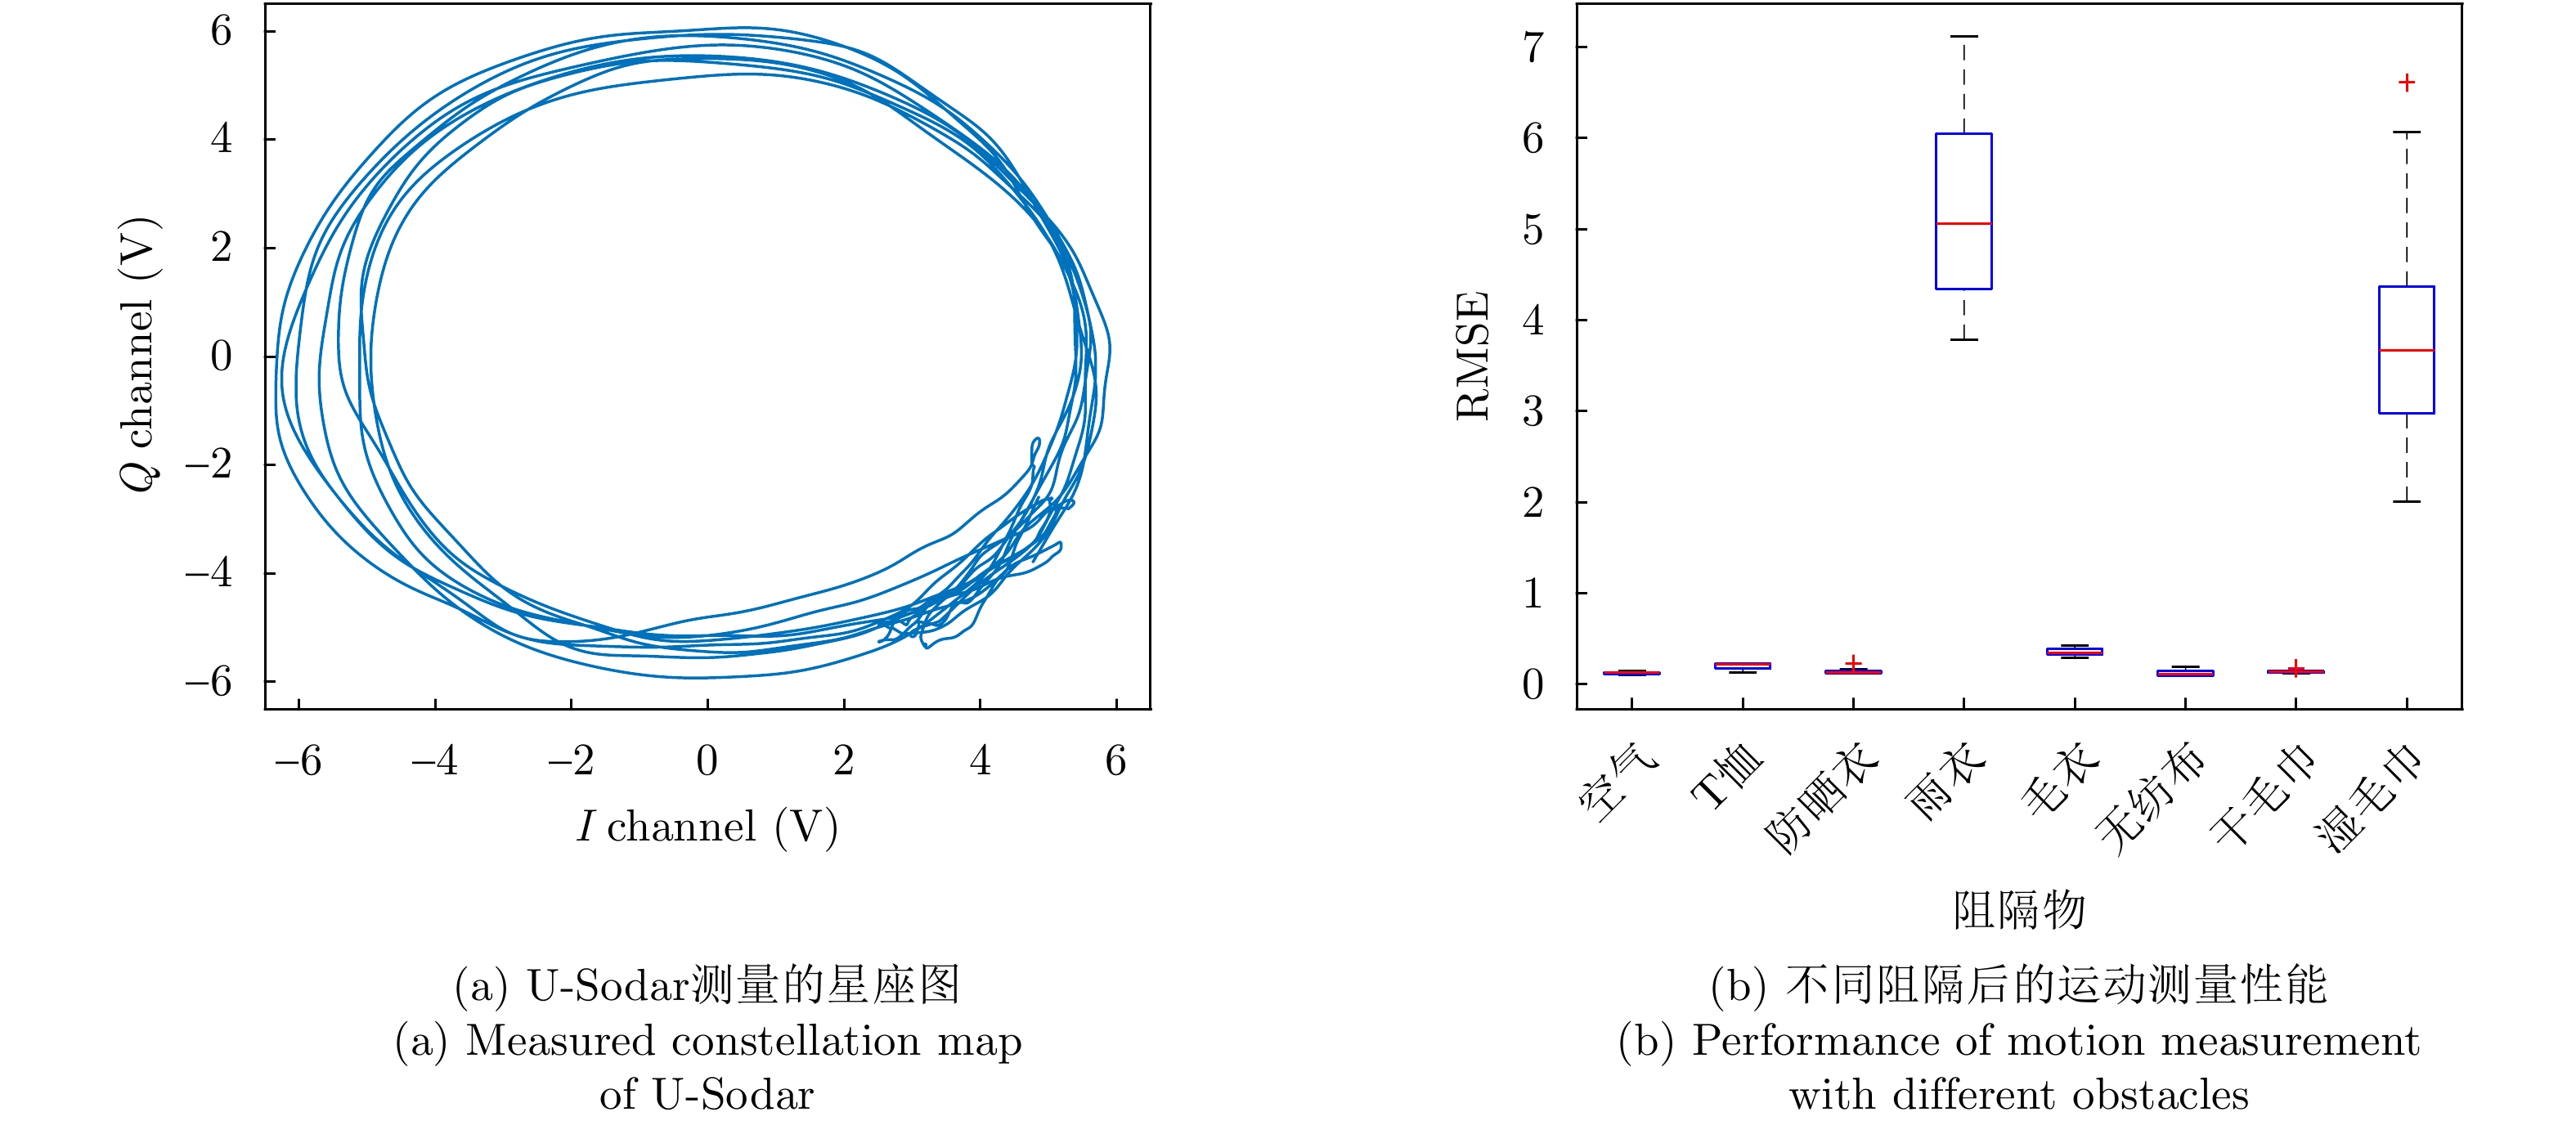
- Figure 19. Results of U-Sodar measurements on motor movement
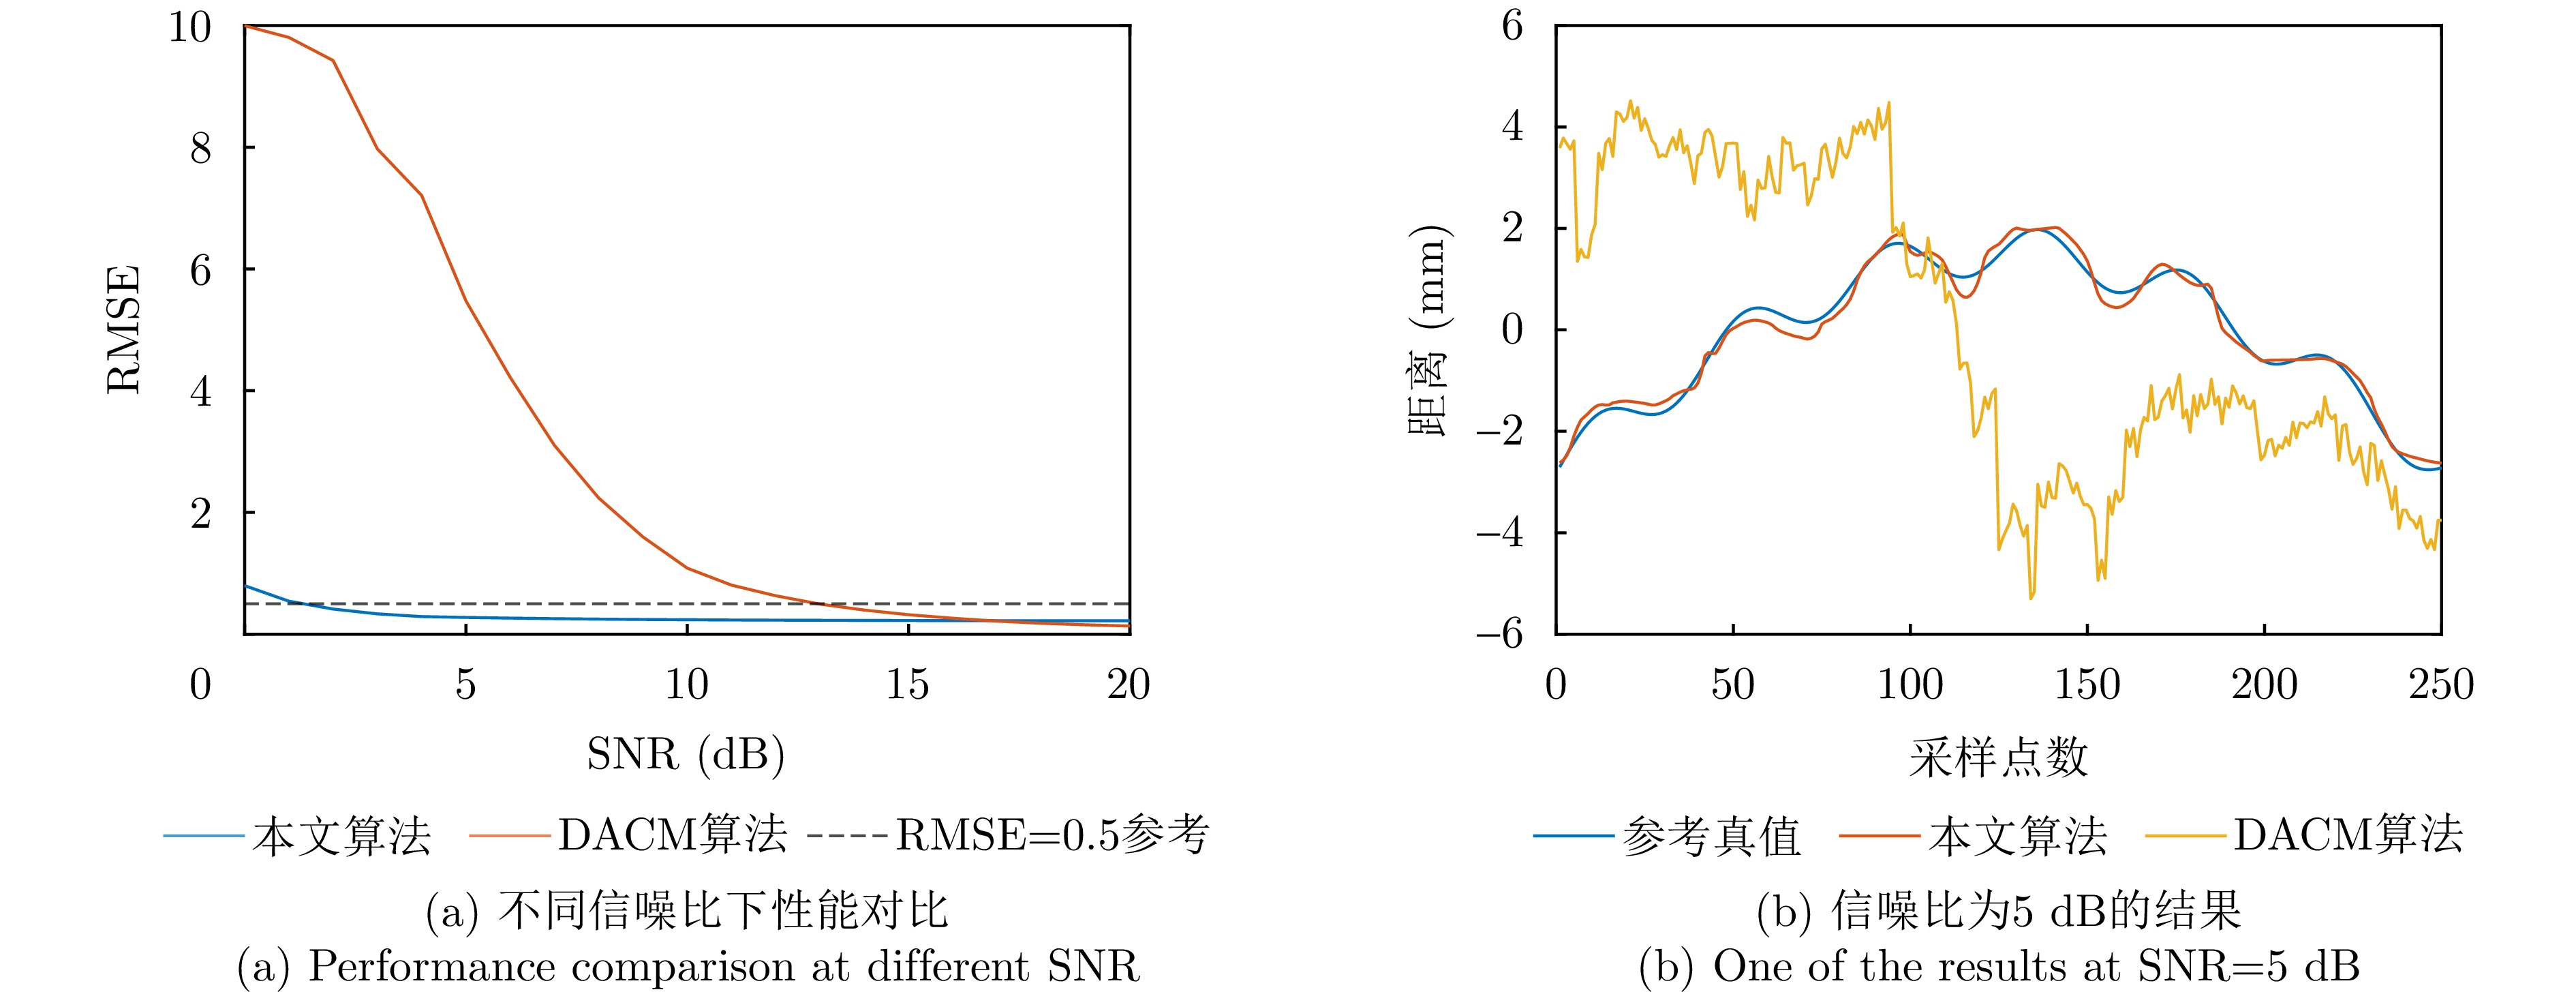
- Figure 20. Comparison of signal processing results with different signal-to-noise ratios
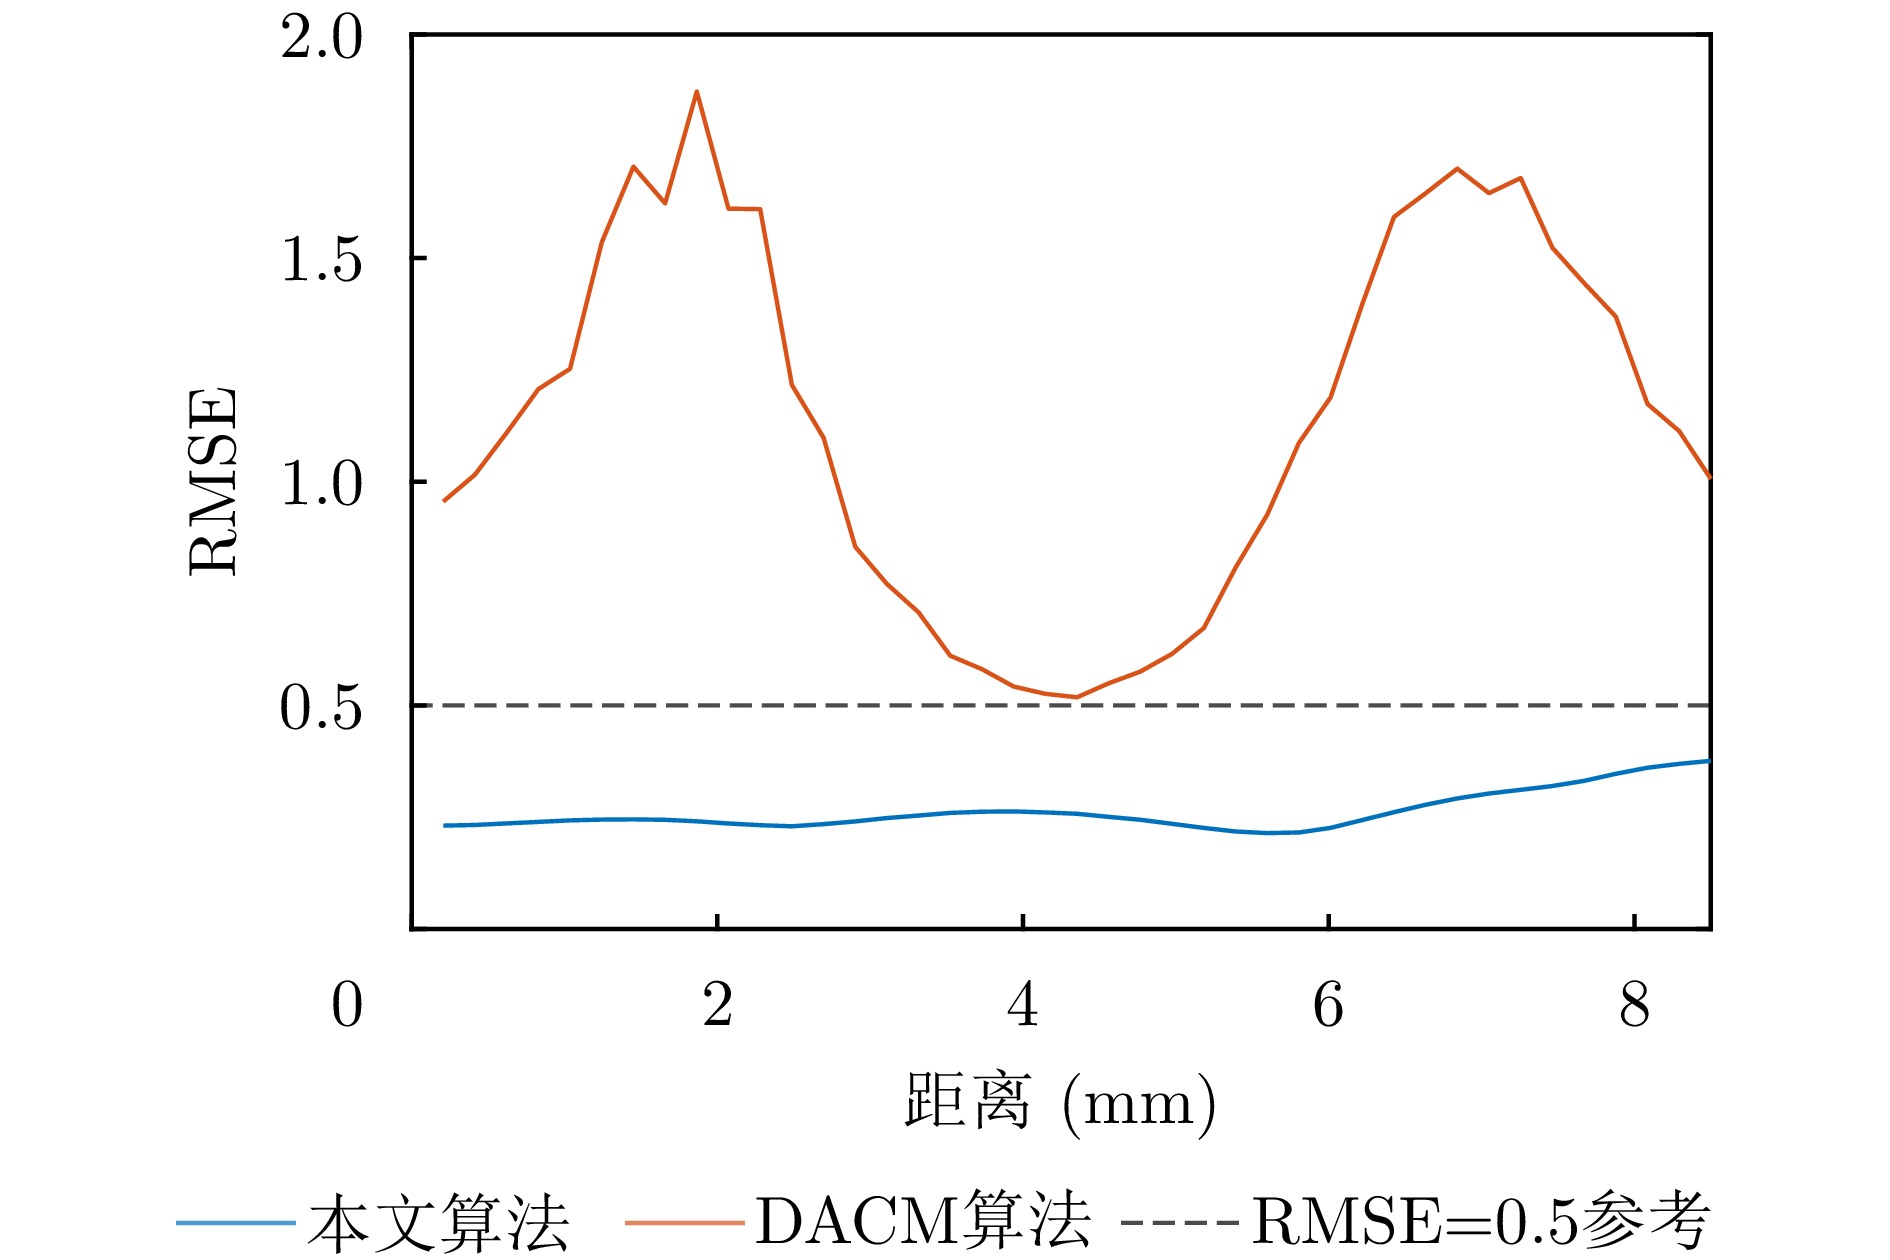
- Figure 21. Comparison of simulation results for different body movement distances
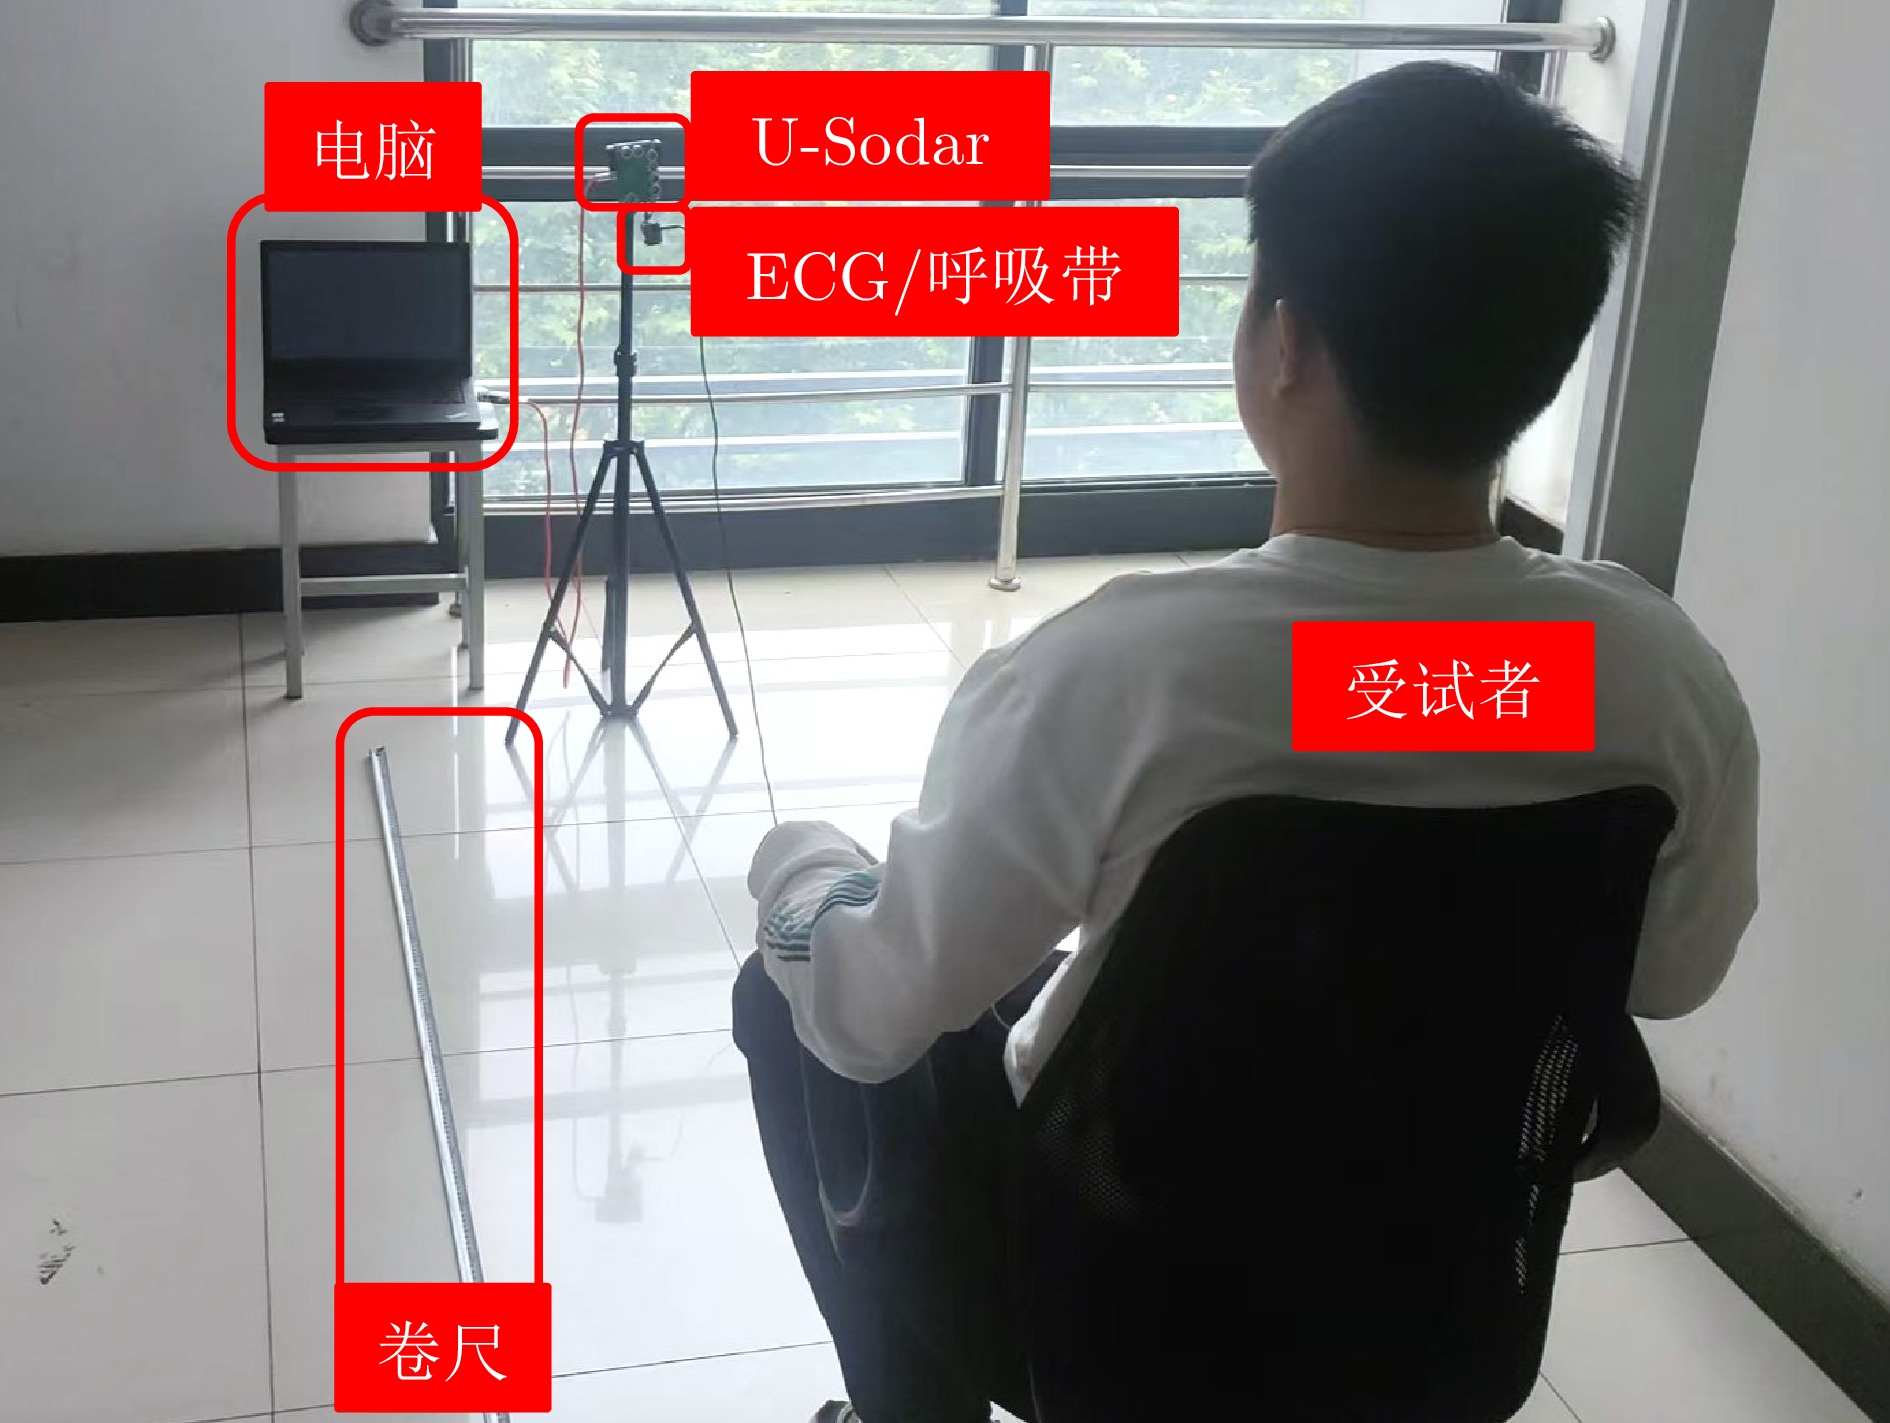
- Figure 22. Schematic of the experimental setup for measuring vital signs with U-Sodar
- Figure 23. Breathing measurements at different distances
- Figure 24. Results of heartbeat measurements at different distances