Wake turbulence, a pair of counter-rotating vortices behind aircraft generated as a consequence of aerodynamic lift, is a recognised hazard to aviation safety[1]. During the past decade or so, the understanding of wake vortex behaviour has benefitted immensely from advances in both observation (ground-based active remote-sensing)[2,3] and modelling (including but not limited to computational fluid dynamics) capabilities[4–6]. As a practical preventive measure against wake vortex safety hazards, international civil aviation has put in place stringent standards governing the minimum separation distance between the leading and trailing aircraft[6,7].
In recent years, supported by maturing research results and successful validation through field campaigns[8,9], a move towards more flexible separation standards is being pursued by major air traffic regulators in the U.S. and Europe with the aim of enhancing airport traffic capacity[10,11]. These have led to the testing and subsequent implementation of “RECAT”, or re-categorization of aircraft wake turbulence separation minima, at a number of major international airports, such as the Heathrow in London[12], the Charles de Gaulle in Paris[13], and the San Francisco International Airport[14].
The Hong Kong International Airport (HKIA) is one of the busiest airports in the world. Its current two-runway configuration (comprising the parallel North and South Runways along the 070-250 direction) supports a maximum flight handling capacity up to 68 movements per hour[15]. According to figures from the Airport Authority Hong Kong (AAHK), the number of total aircraft movement at HKIA already exceeded 400,000 in 2016[16].
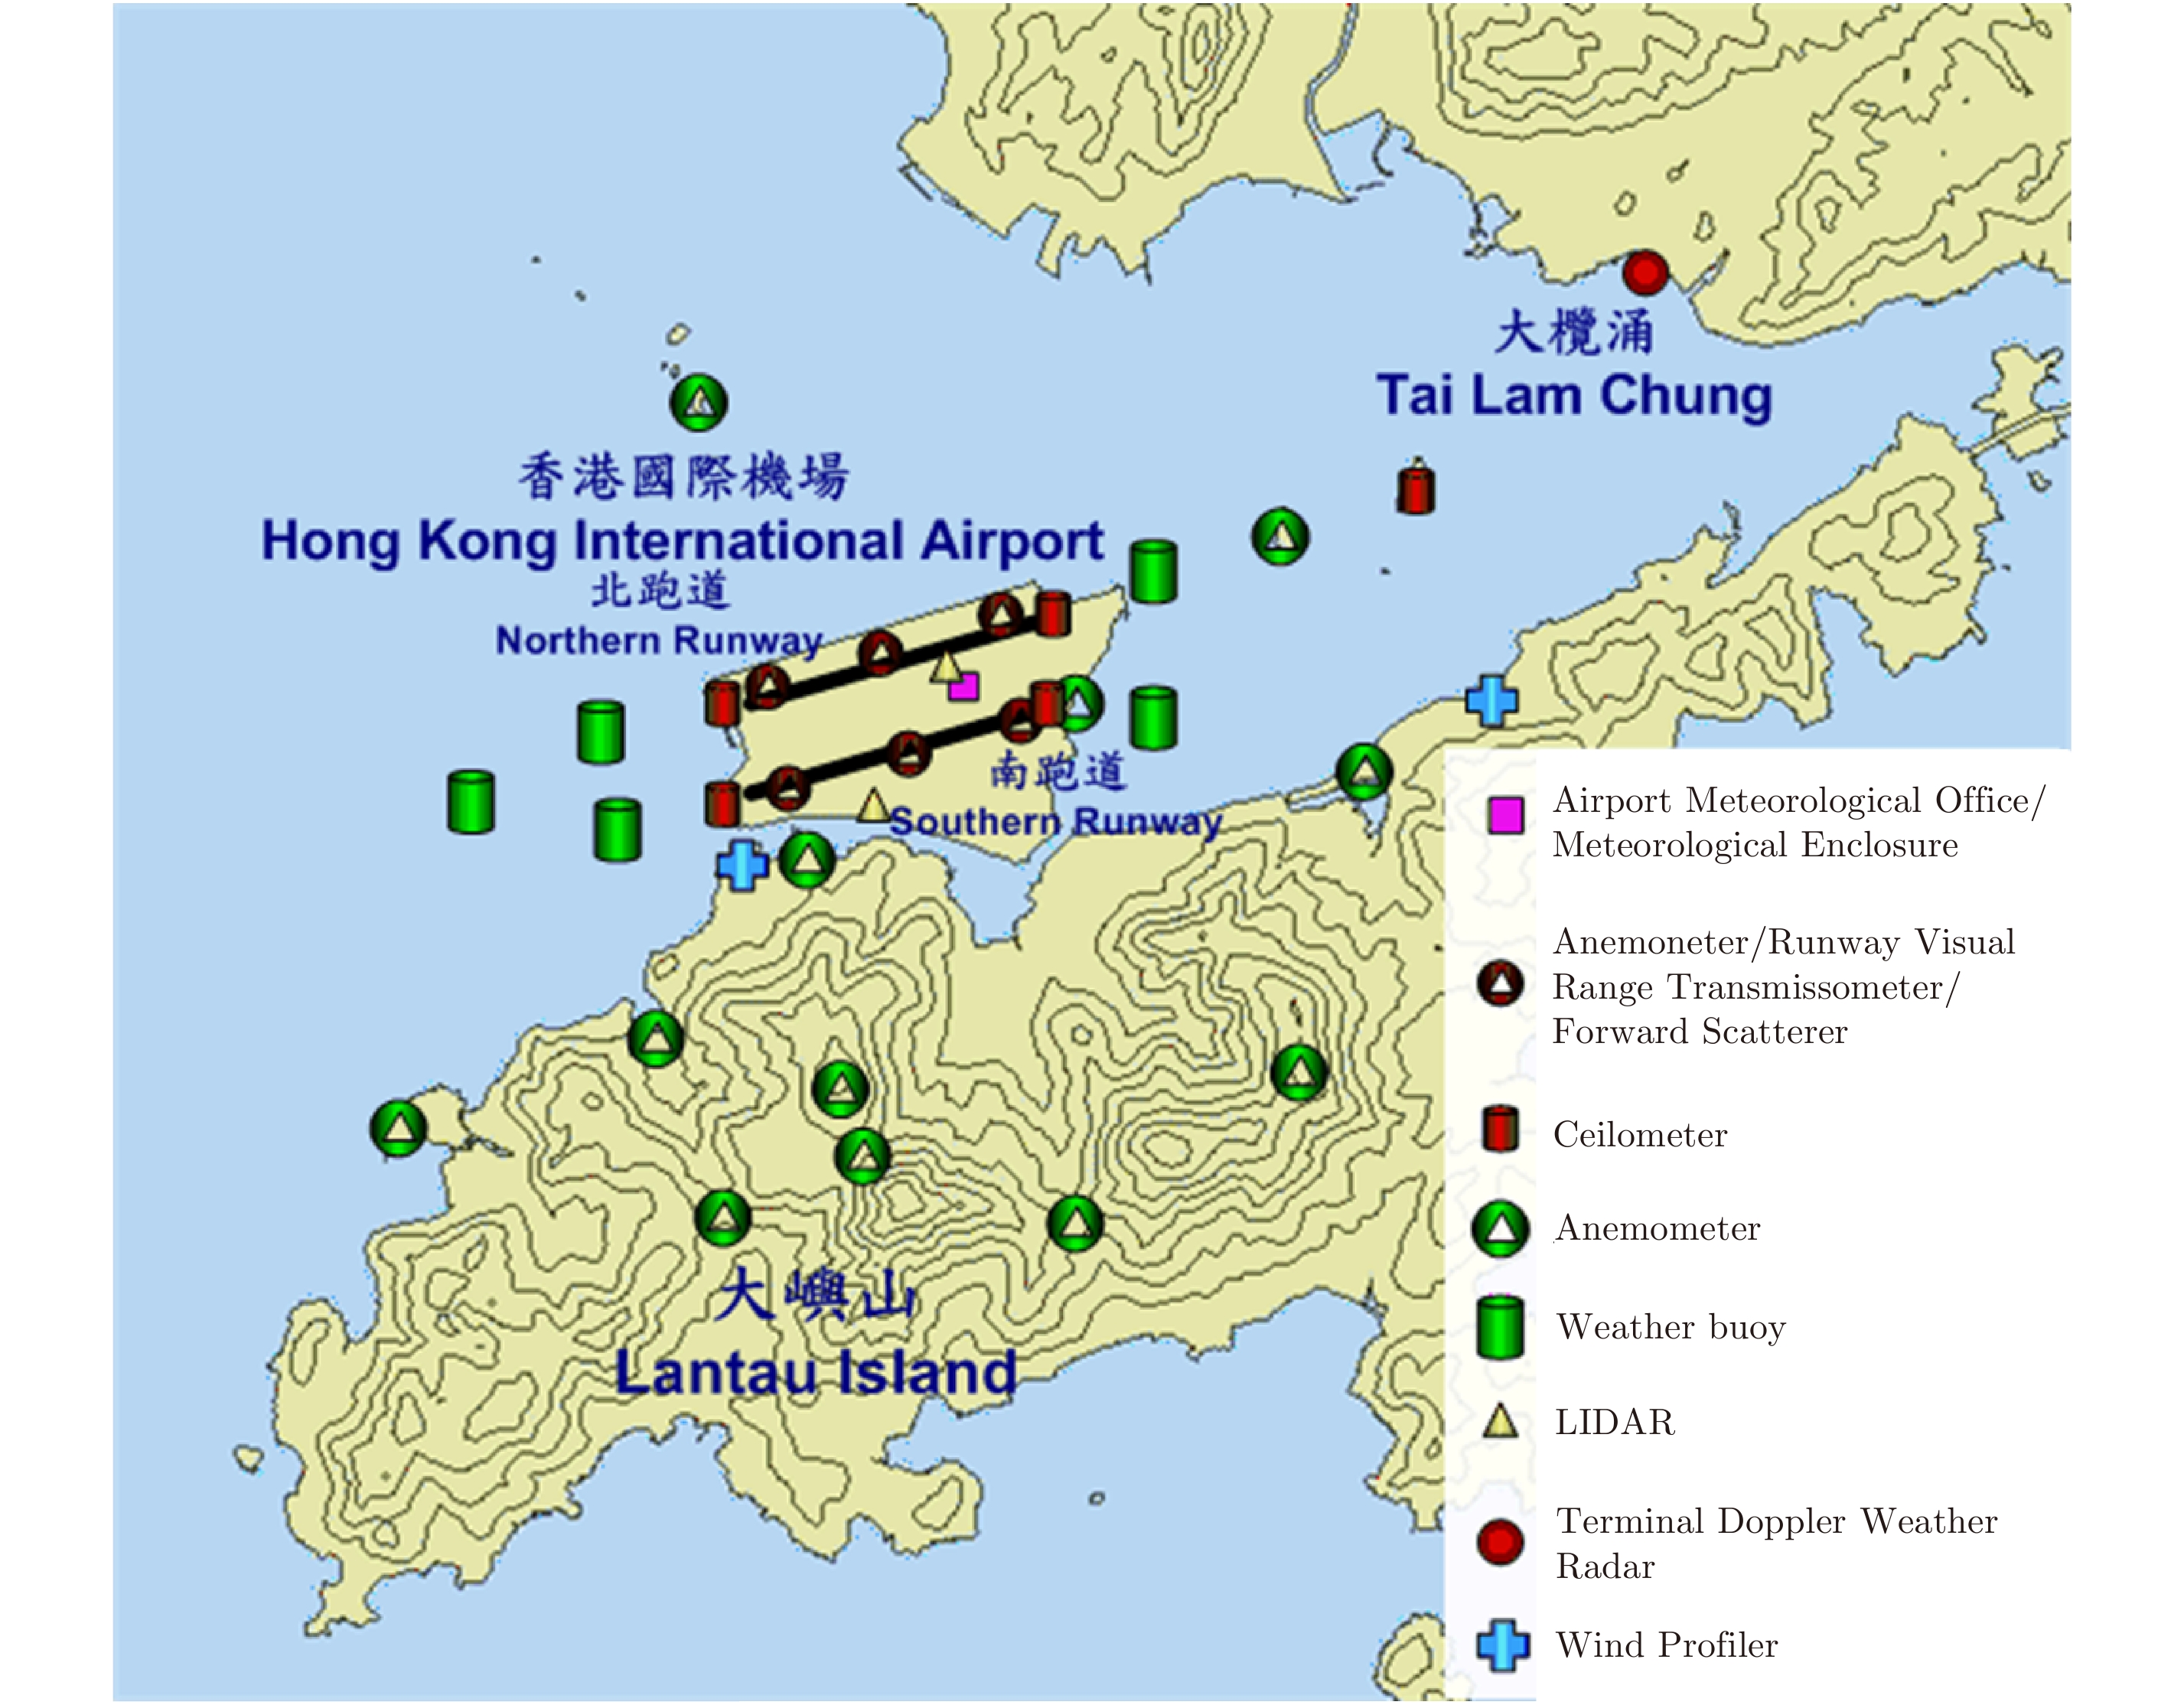
The Hong Kong Observatory (HKO) provides aviation meteorological services to HKIA as the designated Met. Authority (Fig. 1). In addition to the conventional meteorological observations and forecasts required for international air navigation, HKO is also widely recognised for operating the world’s first LIDAR (LIght Detection And Ranging) windshear alerting system[17]. Long-range coherent Doppler LIDARs, with physical range gate of about 100 m and clear-air scanning range up to 7–8 km or above, have been deployed at HKIA since 2002. In addition, HKO began field testing of Short-Range LIDARs (SRL) at HKIA since 2009. SRLs are smaller, more agile counterparts of the long-range LIDAR, with higher radial resolution (physical range gate down to about 30 m) but shorter scanning range (typically up to 2–3 km). These were deployed at a strategic location at HKIA for a few months each summer on a temporary basis for studying the impact of building-disrupted airflow on landing aircraft[18].
|
Fig.1 Schematic diagram of the terrain (contoured at 100 m separation) and major meteorological instruments surrounding the Hong Kong International Airport |
Drawing on its rich experience in aviation applications of LIDAR-based micro-scale wind sensing, HKO has recently made the first steps in aircraft wake vortex, or wake turbulence, measurements in Hong Kong[19].These include performing the first sets of wake vortex observations for arrival and departure runway corridors of HKIA, and also development of prototype algorithms for identification of wake vortices using velocity-based methods. This paper briefly describes the wake vortex observation results at HKIA so far and discusses the way forward on the monitoring and prediction of wake vortex behaviour in Hong Kong.
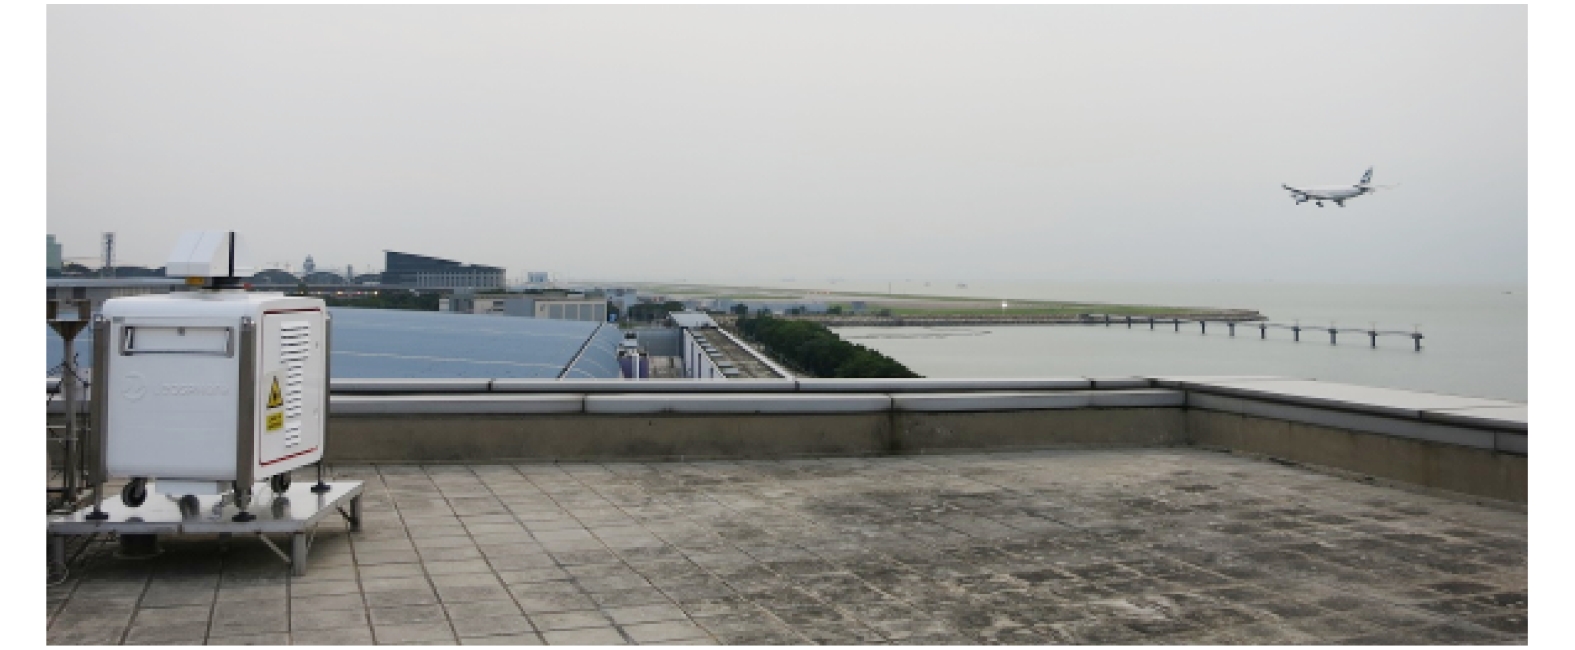
2 Wake Vortex Measurements in 2014The first wake vortex observations at HKIA were made during the summer of 2014[19]. At that time, a unit of Leosphere 200S was temporarily installed on the rooftop of the AsiaWorld-Expo at the northeastern tip of HKIA (Fig. 2) for studying building-disrupted airflow over corridor 25RA (arriving at HKIA from the eastern side using the North Runway) under southwesterly winds. It could be seen from Fig. 2 that the site enjoyed an unobstructed view of the final stretch of the landing flight path of 25RA, overlooking the seas over the northeast quadrant of HKIA from a height of about 15 m above ground level. Normally, the SRL was configured for performing fixed-elevation (or plan-position indicator, PPI) scans at 20–30 second intervals in order to map out the detailed evolution of wind patterns around the final 1 nautical mile or so from touchdown at 25RA (Fig. 3(a)). When background winds become weak (and hence not favourable for the occurrence of building-induced windshear or turbulence), the opportunity would be taken to reconfigure the SRL for performing vertical planar scans (or range-height indicator, RHI) at right angle to runway orientation (Fig. 3(b)). These RHI scans were performed at full radial resolution of the instrument (physical range gate of 30 m) with high updating frequency (up to 5 seconds per RHI scan), covering the area between the sea surface and the altitude of a normal landing aircraft at that position (roughly 80–90 m above sea level). The RHI sector spans an angle between 20° and 25°, and is normally covered by about 20 beams, giving an angular resolution of 1–1.25°. This converts to a vertical resolution of about 7 m at the location of the arrival glide path (which is roughly 400 m away from the SRL).
|
Fig.2 The temporary unit of short-range LIDAR overlooking the arrival glide path of corridor 25RA at HKIA during the 2014 field campaign |

|
Fig.3 Scanning strategies employed during the short-range LIDAR field campaign in summer 2014 |
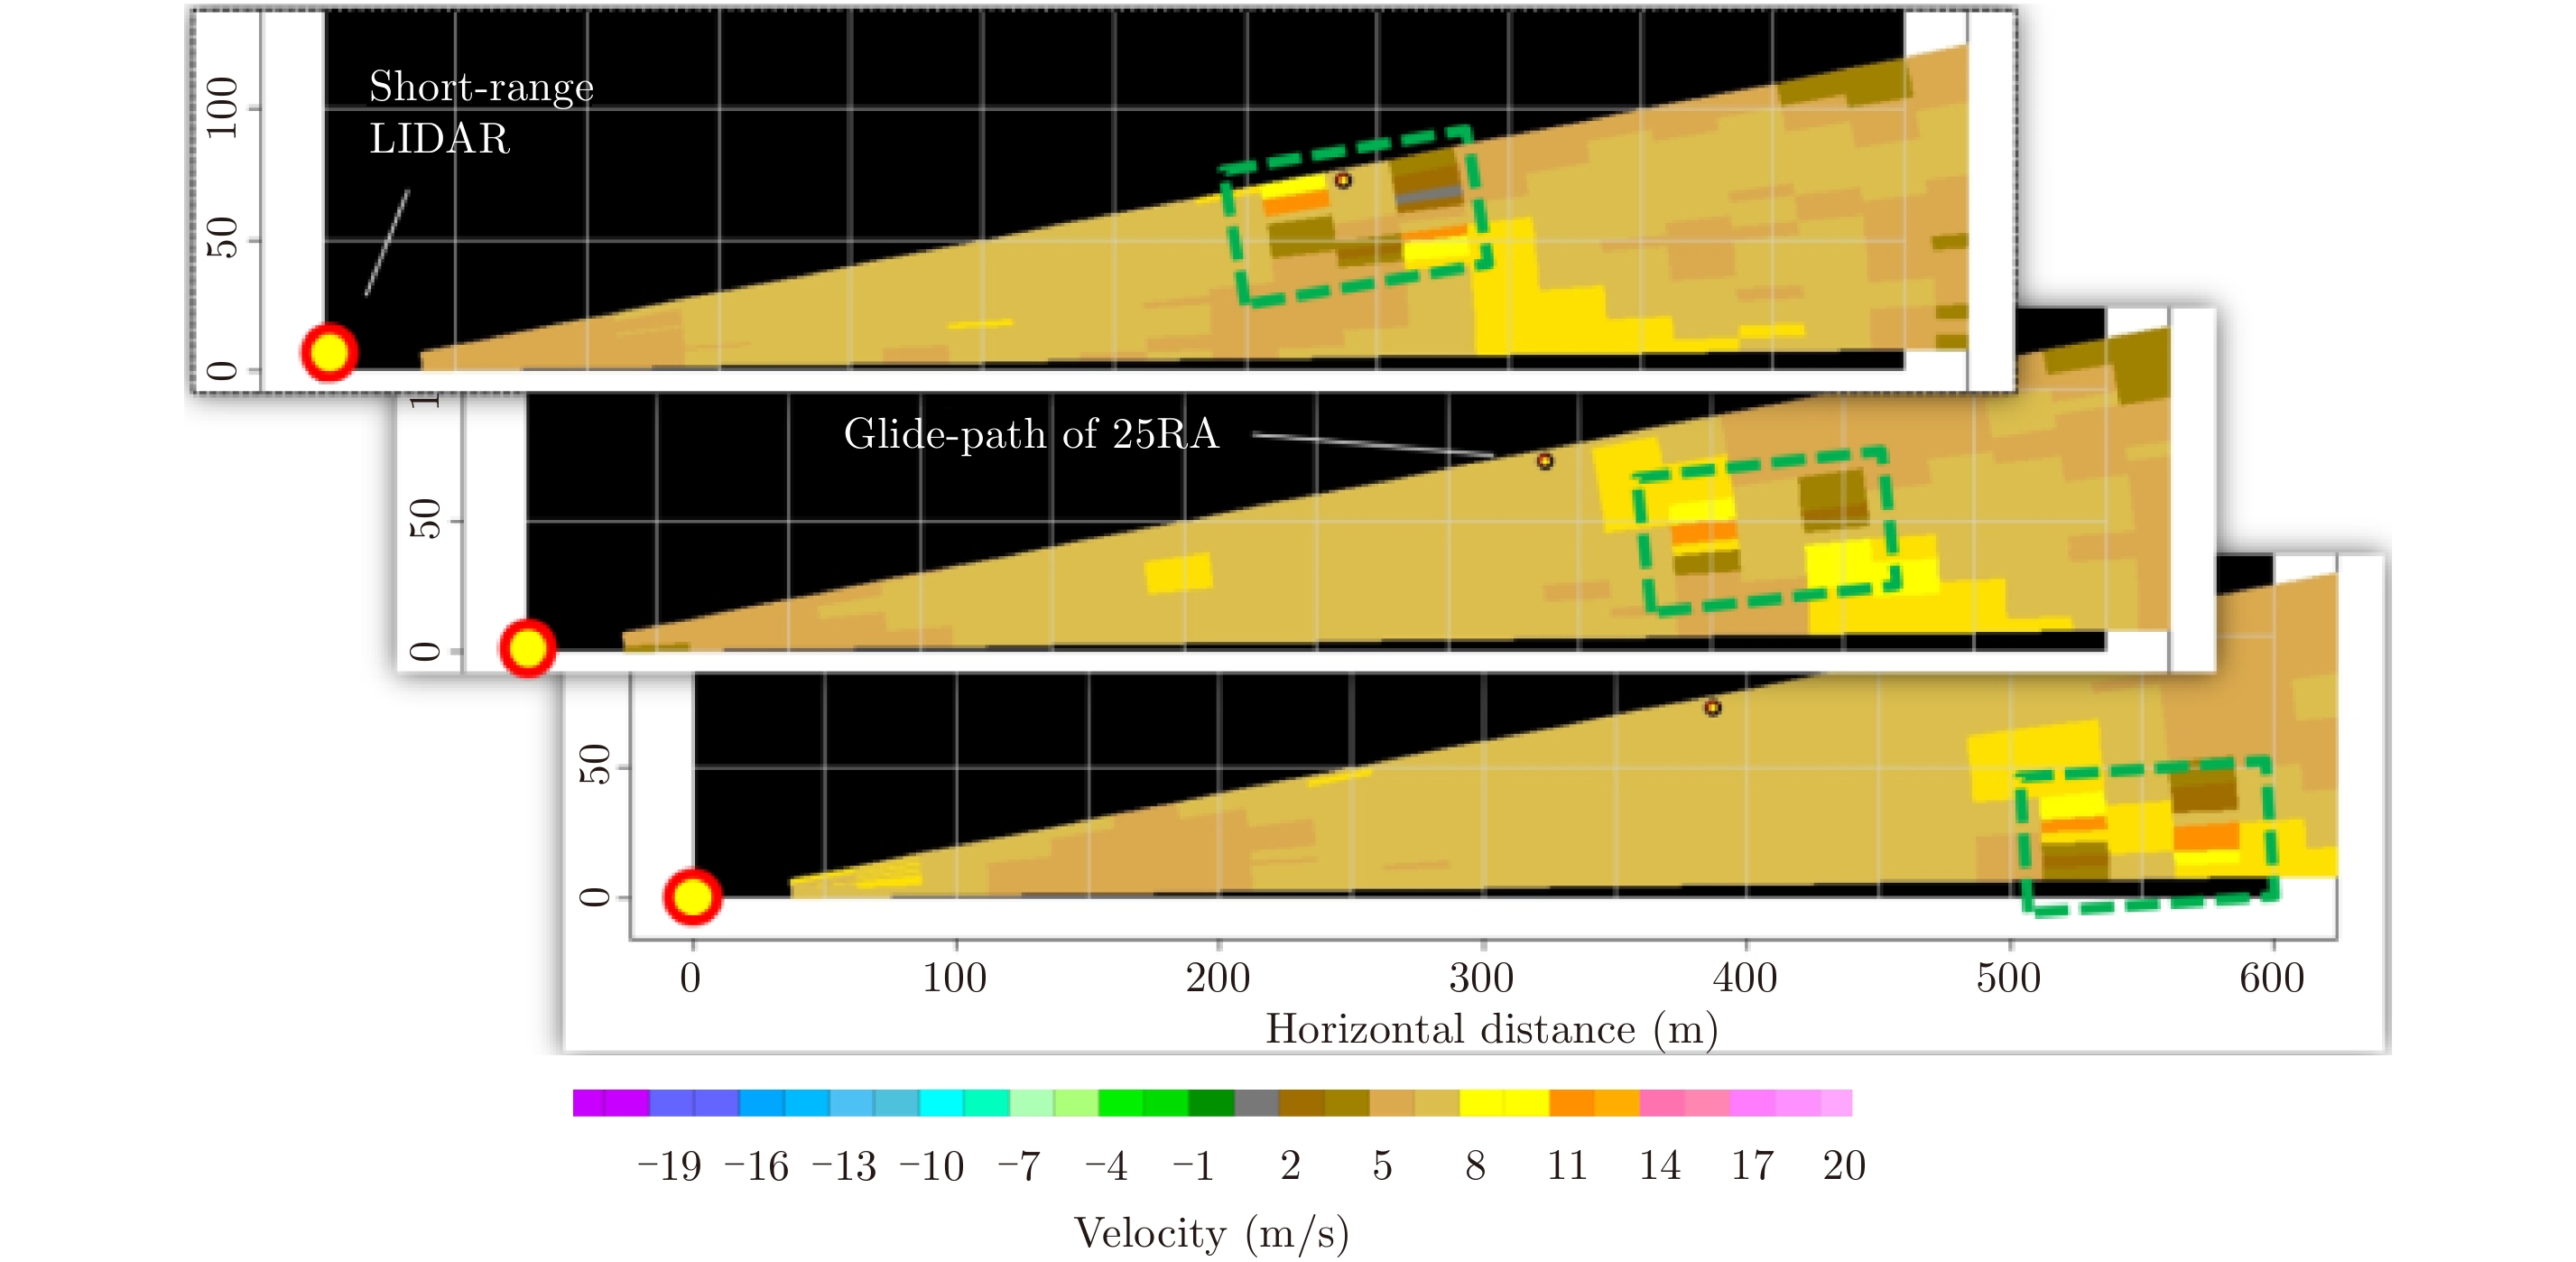
During the 3-month SRL field campaign in 2014 (lasting between June and August), there were about 10 days on which the meteorological conditions were suitable for reconfiguring the SRL for performing RHI scans at 25RA. A sample sequence of the resulting wake vortex observations is shown in Fig. 4. Here each colour pixel represents the radial velocity at each range gate (with physical length of 30 m) along a LIDAR beam. The SRL is located at the bottom left corner of each frame, which are separated by intervals of 10 seconds. The yellow dot near the uppermost beam in each frame indicates the rough location of a landing aircraft (flying “into” the page) within the vertical plane of the RHI scan, assuming a glide path angle of 3°. In all 3 frames the LIDAR signature of wake vortices can be clearly observed. The pair of counter-rotating vortices are well-represented by the quartet (or quadruple) of colour pixels-under a uniform background flow (yellow/brown) away from the SRL, the orange pixels correspond to enhanced radial outward flows at the top of the port (left) vortex and at the bottom of the starboard (right) vortex, while the brown pixels correspond to the reduced outward radial velocities due to the opposite flows at the bottom of the port vortex and at the top of the starboard vortex. In the course of about 20 seconds, the vortex pair could be observed to gradually drift away from the SRL by the background flow while sinking to the surface. The structure of the vortices remained intact throughout. It could also be seen that the location of appearance of the vortex pair (Fig. 4, first frame) matched well with the expected position of the landing aircraft, suggesting that the scanning strategy had been effective.
|
Fig.4 Sample sequence of wake vortex evolution (highlighted) captured by a short-range LIDAR over 25RA during the 2014 field campaign |
A prototype algorithm has also been developed in-house for analysing the above set of wake vortex RHI scans. Due to practical constrains in data storage and instrument settings, it was not possible at the time to record the raw, unaveraged spectral data from the SRL. Hence a method based on radial velocity output was chosen for identifying and locating the vortices from each RHI scan. This is in line with experience from other research groups who have worked with LIDAR wake vortex observations at a number of airports around the world[20,21]. Here the vortex location was determined through identification of the maximum/minimum vorticity couplet at coordinates(rL, θL) and (rR, θR) where r represents the radial position along the beam with elevation angle θ, and subscripts L and R refer to the port and starboard vortex respectively. Since high-resolution, gate-overlapping velocity output (e.g. up to 3 or 5 m in some commercially available systems) were not available at the time, it was opted not to locate the vortex pair by fitting each beam to some established vortex models (e.g. the well-known Hallock-Burnham model). The vorticity ζ was computed based on the Stokes’ theorem, through the equivalence between the area integral of the circulation and the line integral of the velocity along its binding path. After selecting a suitable binding area A (e.g. spanning 3 × 3 or 4 × 4 range gates) for each grid box or range gate, the vorticity at each point can then be computed using
Since the position of the glide path is fixed for an arrival corridor (roughly at the top of the RHI scan domain), the determination of first appearance of a vortex pair was simplified in the prototype algorithm. A new vortex pair was considered to have appeared whenever (i) a pair of positive and negative vorticity maxima appeared within a pre-defined distance from the known glide path position with magnitude exceeding certain pre-defined threshold; and (ii) no previously identified “active” vortex pairs were present or observed nearby.
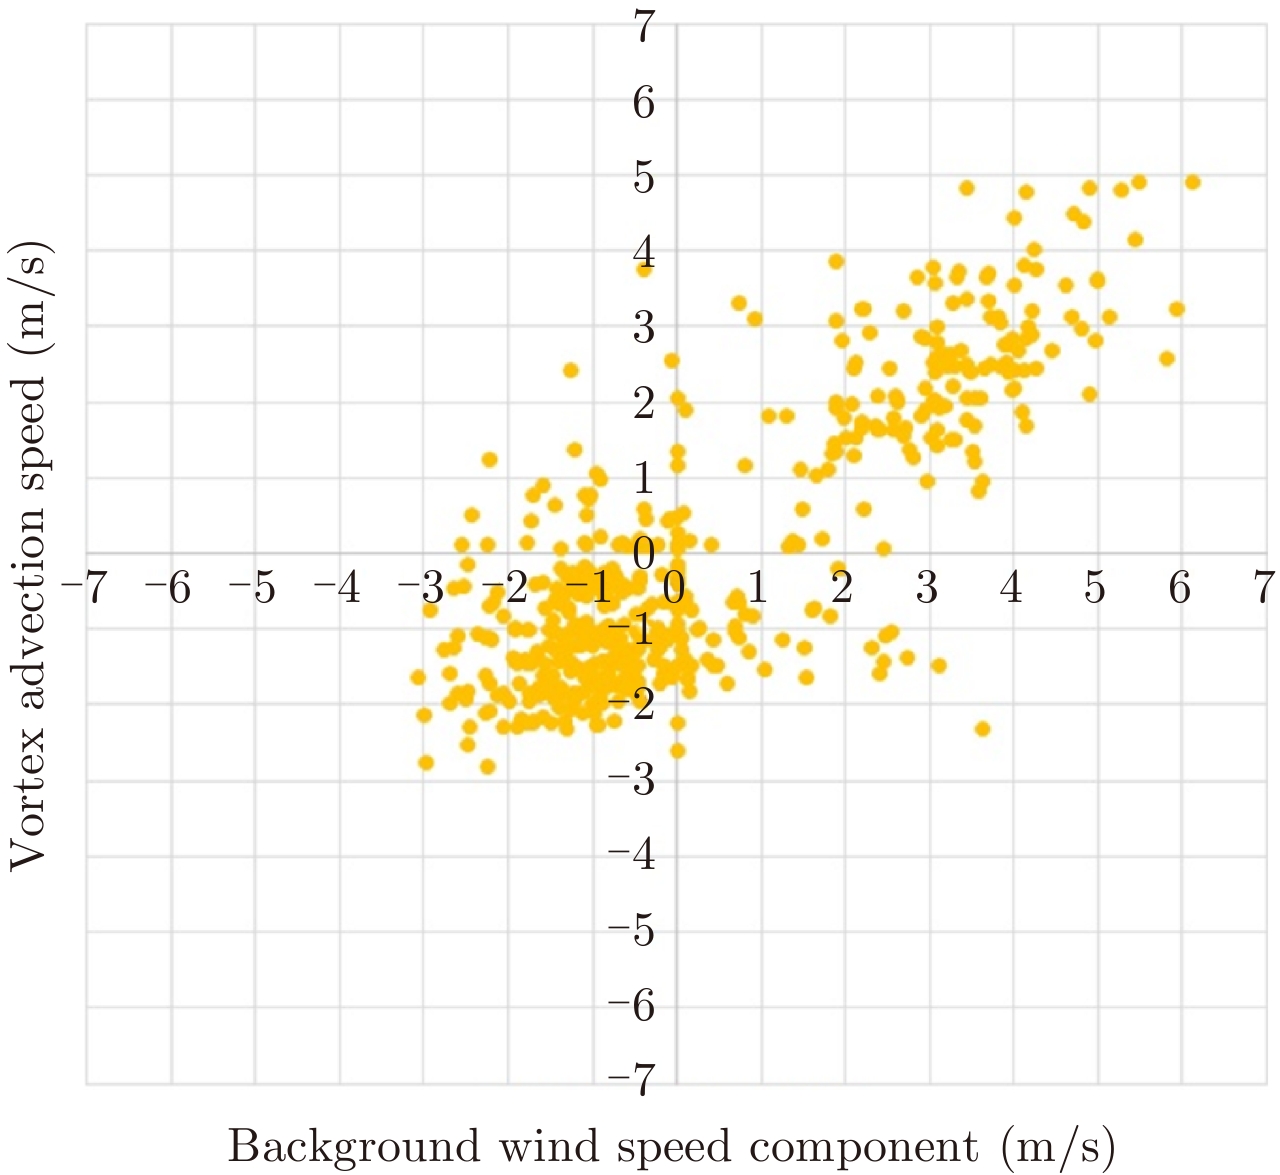
Out of the available RHI scan data from the 2014 field campaign, over 700 wake vortex events over 25RA were identified within the scanning domain. The in-house algorithm also attempts to track the vortex pair from appearance to dissipation and/or departure from the scanning domain. Preliminary results indicated that the “lifetimes” of these vortices are mostly within 60–70 seconds. Care must of course be exercised in interpreting such figures, since they only contain observation results from a very limited range of meteorological and operational conditions. Additionally, the advection speed of the vortex pair along the RHI plane, as obtained from the time evolution of the tracking positions, was found to correlate strongly with the background wind speed (Fig. 5). Here the vertical axis represents the advection speed (confined inside the plane of scanning) of each vortex pair as determined by the prototype tracking algorithm, while the horizontal axis represents the background wind speed as determined by the wind measurements from a nearby anemometer decomposed along the plane of scanning. It could be seen that, within the range of meteorological conditions during the observation campaign (i.e. observed background wind components between about –3 m/s and 6 m/s), the derived vortex advection speeds follows closely the background component with a clear positive and linear correlation, demonstrating the effect of vortex advection by background crosswinds.
|
Fig.5 Scatterplot of estimated advection speed of identified wake vortices during the 2014 field campaign (vertical axis) against background wind speed from a nearby anemometer (horizontal axis). Please refer to the main text for more detailed descriptions |
Temporary deployment of SRL for field measurements at HKIA continued in 2015. This time a unit of Halo Streamline SRL was used and the campaign lasted from late June to early September. For about 10 days at the beginning of this period, a special arrangement was made for the SRL to be placed at a rooftop location near the southwestern side of HKIA such that RHI scans could be performed for corridor 25LD (taking off towards the southwest using the South Runway) (Fig. 6). (For the rest of the field campaign, the SRL was moved back to the Asia World-Expo as in 2014.) This was the first time in Hong Kong that wake vortex measurements were made for departing aircraft.

|
Fig.6 Scanning strategy employed for departure-corridor wake vortex observations during the SRL field campaign in 2015 |
Similar to the practice in 2014, rapid RHI scans at up to 5 seconds intervals were performed at an angle perpendicular to the runway orientation for capturing wake vortex signatures over corridor 25LD. Once again a physical range gate of 30 m was used without gate-overlapping (output resolution down to 3 m possible according to manufacturer). Adjustments were made to the range of elevation angles used so that the initial occurrence (together with the first couple of frames of sinking motion) of most observed vortex pairs could be captured. One such snapshot is shown in Fig. 7. Here the background winds are rather light as indicated by the grey colour. The aircraft flies “into” the page. The pair of wake vortices stand out as a quadruple of green and brown pixels, representing respectively radially inward and outward flows with respect to the SRL (at the bottom left corner of the image).

|
Fig.7 Sample snapshot of a pair of wake vortices (highlighted) observed over corridor 25LD during the SRL field campaign in 2015 |
However, based on an initial survey of the scan results, large variations in the initial occurrence positions of wake vortices could be observed across flights. This results from differences in rotation point (where the aircraft begins to pull up and gain altitude) along the departure runway for different aircraft types, size and takeoff weight. As a result, it becomes difficult to define an optimal scanning strategy for capturing the large variety of possible wake vortices over a departure corridor. If the swath of the RHI scan is too narrow, either the occurrence of wake vortices above the uppermost beams would be missed, or there would be insufficient coverage of vortex evolution near the ground level. This could lead to biases in the estimate lifetime of wake vortices occurring within the scanning domain. On the other hand, using a very wide swath for the RHI scans would comprise the azimuthal angular resolution (and hence spatial resolution along the vertical direction), if the same scanning frequency is to be maintained. This would in turn affect the precision of identifying vortex locations by downstream algorithms.
Due to the different LIDAR make and hence output file format and characteristics, the in-house algorithm developed for the 2014 field campaign has not yet been tested on the departure-corridor data of 2015. Upcoming work would focus on data conversion in order to verify the applicability of the prototype algorithm across different hardware and scanning configurations.
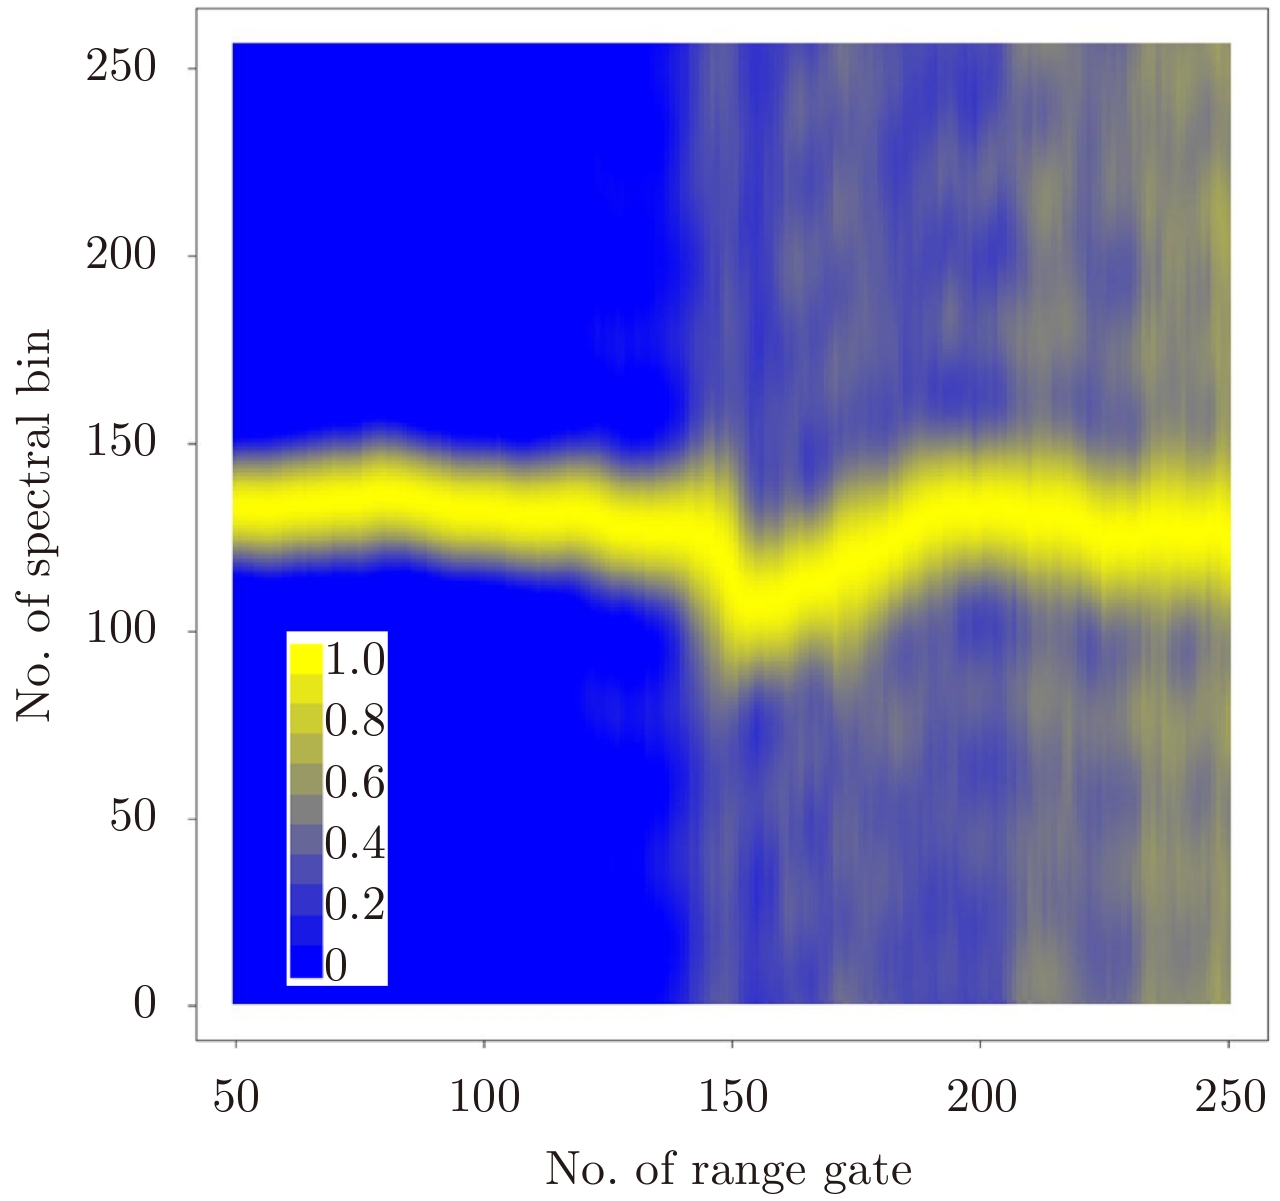
4 Developments in 2016In spring 2016, HKO acquired its first permanent unit of SRL for the detection of windshear and turbulence at 25RA. Hardware installation completed around September and the new instrument, a Halo Streamline, was sited at a seaside location next to the AsiaWorld-Expo. As such, no special observation campaigns were carried out in summer or autumn 2016. However, with more flexible configurations possible in an acquired unit, the first sets of spectral measurements for wake vortices at 25RA have been made during a short hardware testing period in late 2016 (Fig. 8). Here the plotted spectra is normalised on a per range gate basis—assuming the power spectrum at thei-th range gate is represented by
|
Fig.8 Sample normalised spectral intensities obtained from the permanent SRL unit of HKO during late 2016. The sharp jump near the middle of the plot corresponds to rough occurrence location of the observed wake vortices |
It has been mentioned in the opening paragraphs that the original intention of introducing an SRL at HKIA is for the detection and alerting of building-related windshear and turbulence at 25RA[18]. Thanks to the high spatial resolution (30 m as compared to about 100 m of long-range LIDARs) and also short revisit time of the dedicated SRL PPI scans (once every 20–30 second over 25RA as compared to once every 2–3 minutes for the whole of HKIA by the long-range LIDAR), it is also possible to visualise the structure and evolution of wake vortices in the horizontal direction under suitable meteorological conditions and runway usage.
When pilots encounter significant windshear and/or turbulence during landing and take-off at HKIA, a report could be made to HKO through Air Traffic Control regarding the particulars of the event, such as occurrence timing, location, altitude and intensity. During inspection of the SRL PPI sequences taking during a number of windshear reports over 25RA, there were indications that certain windshear encounters occurring under rather light background wind conditions might be due to a combination of existing meteorological conditions (e.g. directional shear due to a weak sea breeze front) and remnant wake vortex flows.
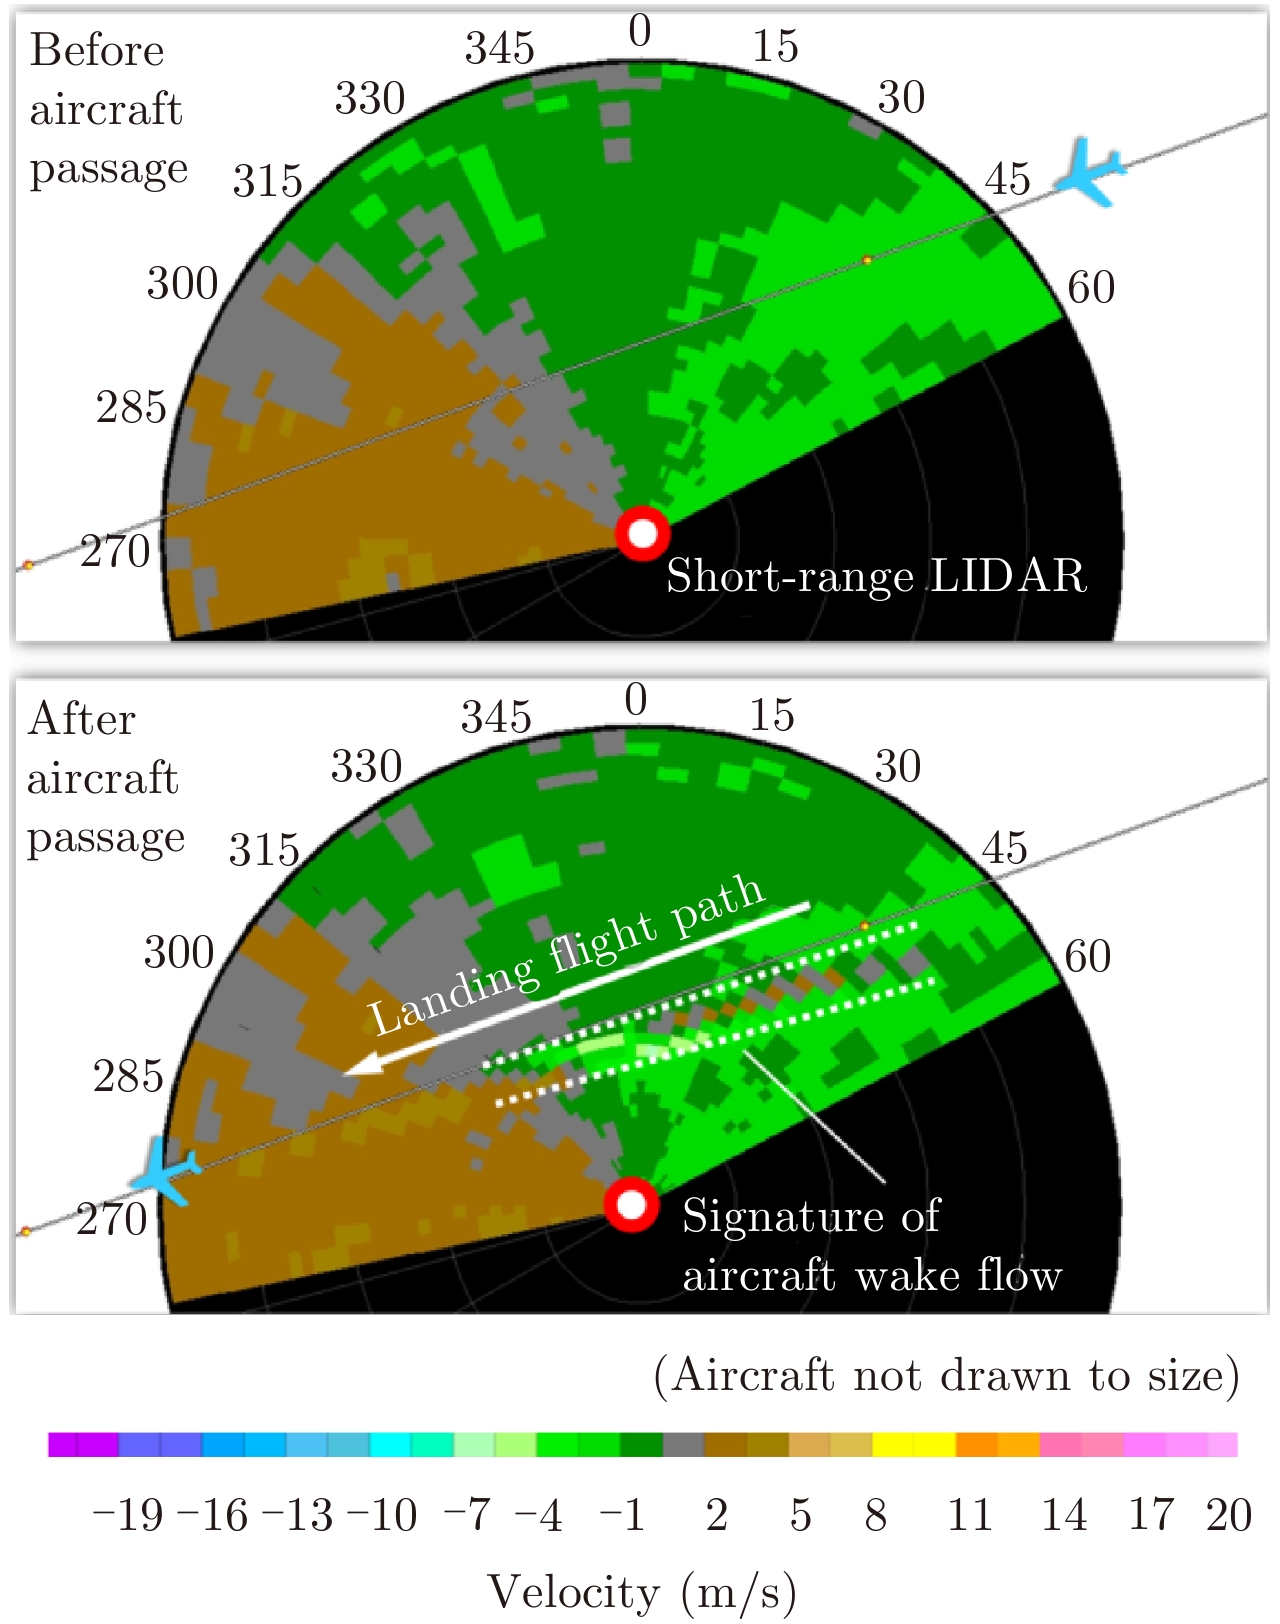
One such case is illustrated in Fig. 9—here the elevation angle is approximately 3° and each PPI scan is completed in 20–30 seconds, which is just enough to resolve the wake vortex features in the horizontal plane based on the experience in Hong Kong. The top panel showed relatively uniform flow pattern around 25RA before arrival of a landing aircraft, with a smooth transition between the brown and green regions of the radial velocity field. After passage of the landing aircraft, a narrow “tail” of alternating green and brown pixels (i.e. inflow and outflow with respect to the SRL), only a few pixels wide, could be seen to emerge alongside the aircraft glide path in the bottom panel. This is the horizontal signature of the trailing wake vortices as revealed by PPI scans of an SRL. Under weak background winds and also a stable atmosphere, the vortices were slow to decay and remained observable near the same location for about 2 minutes. The next landing aircraft, which flew into the region of perturbed airflow along the exact same arrival glide path, reported an encounter of significant windshear. High-resolution aircraft position data at 1-second intervals from the Advanced-Surface Movement Guidance and Control Systems (A-SMGCS) at HKIA confirmed the sequence and timing of aircraft movement.
|
Fig.9 Sample sequence of short-range LIDAR fixed-elevation scans (3° elevation; each planar scan completed in 20–30 seconds) during a suspected case of low-level windshear encounter related to remnant wake vortices. The trailing arrival aircraft would report an encounter of significant low-level windshear |
Such events are of course rare at HKIA, which adheres strictly to relevant international and local flight separation standards, but serves as an interesting illustration of wake vortex observation capabilities offered by LIDAR-based remote-sensing with high spatial and temporal resolution.
6 Discussions & Way ForwardWhile a number of milestones have been made over the past few years in the observation of aircraft wake vortices in Hong Kong, measurements are so far performed mainly on an ad-hoc basis as part of other field measurement campaigns. This greatly limits the representativeness of any statistical results obtainable from the existing sets of observation data. However, despite various practical limitations, the feasibility of wake vortex detection at HKIA has been successfully demonstrated using a number of different SRL models for both arrival and departure corridors under clear air conditions. The observed vortex signatures, include shape and evolution, are found consistent with findings in other major international airports as reported in the literature. The design and implementation of scanning strategies used at HKIA also echo the experience of other major research groups or observation campaigns elsewhere. In particular, an in-house prototype analysis algorithm based on the radial velocity approach has been developed and successfully applied to intensive observation data in 2014, identifying and tracking over 700 wake vortex events over corridor 25RA. Of course, if a reliable climatology of wake vortex behaviour at HKIA is to be constructed, it would be necessary to conduct continuous measurements, e.g. lasting at least a couple of years, for the major arrival and departure corridors.
Starting from 2016, introduction of Automatic Dependent Surveillance-Broadcast (ADS-B) capability at HKO has enabled real-time tracking of aircraft movement around Hong Kong at high spatial and temporal resolution. This would provide valuable information which could be analysed in conjunction with rapid-updating SRL observations for better understanding of local wake vortex characteristics.
HKO also operates the Aviation Model (AVM)[23] which is a fine-resolution Numerical Weather Prediction (NWP) suite providing hourly-updated short-term forecasts for HKIA and its immediate vicinity at a spatial resolution up to 200 m. In addition to detailed wind and temperature forecasts, the AVM is capable of direct prediction of the Eddy Dissipation Rate (EDR), a measure of atmospheric turbulence which is an important parameter controlling the decay of wake vortices. In particular, it is well-established that the low-level turbulence intensity as quantified by EDR bears strong correlation to the break-up or decay of vortex circulation[24]. Earlier studies conducted in Hong Kong[25] have indicated good correspondence between AVM forecasts and LIDAR-derived estimates of near-surface EDR, the latter of which is available in real-time at HKIA using observations from and algorithms developed for the long-range LIDAR[26]. Hence the AVM could potentially provide useful input regarding short-term vortex evolution.
Despite various practical constrains in siting a laser-emitting instrument in a tightly-packed airport environment with rapid and continuous development, HKO would continue to utilise the latest observation and prediction technologies for improving the understanding of wake vortex behaviour at HKIA with a view to potentially enhancing aviation efficiency. The sheer volume of air traffic at HKIA makes it a unique and ideal site for the study of wake vortices. On the technical side, algorithm development and experiments with scanning strategy would continue to improve the identification and characterisation of wake vortex circulation.
Acknowledgements
Messrs. C. B. Fung and T. K. Leung are gratefully acknowledged for their assistance in hardware aspects. Messrs. C. M. Li, Neo Kong and K. Y. Leung are acknowledged for IT and coding support.
| [1] |
Hallock J N. Aircraft wake vortices: An assessment of the current situation[R]. U.S. Department of Transportation Report. DOT-FAA-RD-90-29. Washington, D.C.: U.S. Department of Transportation, 1991: 59.
Hallock J N. Aircraft wake vortices: An assessment of the current situation[R]. U.S. Department of Transportation Report. DOT-FAA-RD-90-29. Washington, D.C.: U.S. Department of Transportation, 1991: 59. (  0) 0)
|
| [2] |
Rubin W L. Radar-acoustic detection of aircraft wake vortices[J].
Journal of Atmospheric and Oceanic Technology, 2000, 17(8): 1058-1065. DOI:10.1175/1520-0426(2000)017<1058:RADOAW>2.0.CO;2 ( 0) 0)
|
| [3] |
Holzäpfel F, Gerz T, Köpp F, et al.. Strategies for circulation evaluation of aircraft wake vortices measured by Lidar[J].
Journal of Atmospheric and Oceanic Technology, 2003, 20(8): 1183-1195. DOI:10.1175/1520-0426(2003)020<1183:SFCEOA>2.0.CO;2 ( 0) 0)
|
| [4] |
Liu Zhong-xun, Jeannin N, Vincent F, et al.. Modeling the radar signature of raindrops in aircraft wake vortices[J].
Journal of Atmospheric and Oceanic Technology, 2013, 30(3): 470-484. DOI:10.1175/JTECH-D-11-00220.1 ( 0) 0)
|
| [5] |
Holzäpfel F and Robins R E. Probabilistic two-phase aircraft wake vortex model: Application and assessment[J].
Journal of Aircraft, 2004, 41(5): 1117-1126. DOI:10.2514/1.2280 ( 0) 0)
|
| [6] |
Holzäpfel F, Kladetzke J, Amelsberg S, et al.. Aircraft wake vortex scenarios simulation package for takeoff and departure[J].
Journal of Aircraft, 2009, 46(2): 713-717. DOI:10.2514/1.39346 ( 0) 0)
|
| [7] |
ICAO. Procedures for air navigation services—air traffic management (Doc 4444)[Z]. 2016, 5: 1–36 (Technical document of the International Civil Aviation Organisation).
ICAO. Procedures for air navigation services—air traffic management (Doc 4444)[Z]. 2016, 5: 1–36 (Technical document of the International Civil Aviation Organisation). (  0) 0)
|
| [8] |
EUROCONTROL. European wake vortex mitigation benefits study (EuroBen)[Z]. High Level Benefits Analysis & Systemic Analysis, 2005 (Technical report of EUROCONTROL).
EUROCONTROL. European wake vortex mitigation benefits study (EuroBen)[Z]. High Level Benefits Analysis & Systemic Analysis, 2005 (Technical report of EUROCONTROL). (  0) 0)
|
| [9] |
Tittsworth J A, Lang S R, Johnson E J, et al.. Federal aviation administration wake turbulence program-recent highlights[C]. 57th Air Traffic Control Association (ATCA) Annual Conference & Exposition, Cambridge, MA, USA, 2012.
Tittsworth J A, Lang S R, Johnson E J, et al.. Federal aviation administration wake turbulence program-recent highlights[C]. 57th Air Traffic Control Association (ATCA) Annual Conference & Exposition, Cambridge, MA, USA, 2012. (  0) 0)
|
| [10] |
Federal Aviation Administration. Wake turbulence recategorization[Z]. Order JO 7110.659C, 2016 (Administrative order form FAA of USA).
Federal Aviation Administration. Wake turbulence recategorization[Z]. Order JO 7110.659C, 2016 (Administrative order form FAA of USA). (  0) 0)
|
| [11] |
Treve V and Rooseleer F. RECAT-EU proposal, validation and consultation[R]. WakeNet-EU, EUROCONTROL Experimental Centre, Bretigny, France, 2014.
Treve V and Rooseleer F. RECAT-EU proposal, validation and consultation[R]. WakeNet-EU, EUROCONTROL Experimental Centre, Bretigny, France, 2014. (  0) 0)
|
| [12] |
Morris C, Peters J and Choroba P. Validation of the time based separation concept at London Heathrow Airport[C]. Tenth USA/Europe Air Traffic Management Research and Development Seminar, 2013.
Morris C, Peters J and Choroba P. Validation of the time based separation concept at London Heathrow Airport[C]. Tenth USA/Europe Air Traffic Management Research and Development Seminar, 2013. (  0) 0)
|
| [13] |
French Civil Aviation Authority. Implementation of the RECAT-EU wake turbulence separation scheme at Paris Charles de Gaulle, Paris-le Bourget and Pontoise-Cormeilles-en-Vexin airports from March 22nd 2016[R]. AIC France A 03/16. 2016.
French Civil Aviation Authority. Implementation of the RECAT-EU wake turbulence separation scheme at Paris Charles de Gaulle, Paris-le Bourget and Pontoise-Cormeilles-en-Vexin airports from March 22nd 2016[R]. AIC France A 03/16. 2016. (  0) 0)
|
| [14] |
Federal Aviation Administration. Re-categorization (RECAT) of FAA wake turbulence separation categories at specific airports[R]. SAFO 12007. Washington, DC: SAFO, 2013.
Federal Aviation Administration. Re-categorization (RECAT) of FAA wake turbulence separation categories at specific airports[R]. SAFO 12007. Washington, DC: SAFO, 2013. (  0) 0)
|
| [15] |
Airport Authority Hong Kong. Hong Kong international airport fact sheet[EB/OL]. http://www.hongkongairport.com/eng/media/facts-figures/facts-sheets.html, 2016.
Airport Authority Hong Kong. Hong Kong international airport fact sheet[EB/OL]. http://www.hongkongairport.com/eng/media/facts-figures/facts-sheets.html, 2016. (  0) 0)
|
| [16] |
Airport Authority Hong Kong. Finalized civil international air traffic statistics at HKIA, Year 2016[EB/OL]. http://www.hongkongairport.com/eng/pdf/business/statistics/2016e.pdf, 2016.
Airport Authority Hong Kong. Finalized civil international air traffic statistics at HKIA, Year 2016[EB/OL]. http://www.hongkongairport.com/eng/pdf/business/statistics/2016e.pdf, 2016. (  0) 0)
|
| [17] |
Shun C M and Chan P W. Applications of an infrared Doppler Lidar in detection of wind shear[J].
Journal of Atmospheric and Oceanic Technology, 2008, 25(5): 637-655. DOI:10.1175/2007JTECHA1057.1 ( 0) 0)
|
| [18] |
Hon K K, Chan P W, Chiu Y Y, et al.. Application of short-range LIDAR in early alerting for low-level windshear and turbulence at Hong Kong International Airport[J]. Advances in Meteorology, 2014, 2014: Article ID 162748.
Hon K K, Chan P W, Chiu Y Y, et al.. Application of short-range LIDAR in early alerting for low-level windshear and turbulence at Hong Kong International Airport[J]. Advances in Meteorology, 2014, 2014: Article ID 162748. (  0) 0)
|
| [19] |
Hon K K. First wake vortex measurements at the Hong Kong International Airport[EB/OL]. News bulletin for the aviation community, Hong Kong Observatory. http://www.hko.gov.hk/aviat/outreach/32nd/wakevortex.htm, 2015, January.
Hon K K. First wake vortex measurements at the Hong Kong International Airport[EB/OL]. News bulletin for the aviation community, Hong Kong Observatory. http://www.hko.gov.hk/aviat/outreach/32nd/wakevortex.htm, 2015, January. (  0) 0)
|
| [20] |
Smalikho I N, Banakh V A, Holzäpfel F, et al.. Method of radial velocities for the estimation of aircraft wake vortex parameters from data measured by coherent Doppler Lidar[J].
Optics Express, 2015, 23(19): A1194-A1207. DOI:10.1364/OE.23.0A1194 ( 0) 0)
|
| [21] |
Loaec S, Thobois L, Cariou J P, et al.. Monitoring wake vortices with a scanning Doppler LIDAR[C]. Proceedings of the 9th International Symposium on Tropospheric Profiling, 2012.
Loaec S, Thobois L, Cariou J P, et al.. Monitoring wake vortices with a scanning Doppler LIDAR[C]. Proceedings of the 9th International Symposium on Tropospheric Profiling, 2012. (  0) 0)
|
| [22] |
Smalikho I, Köpp F and Rahm S. Measurement of atmospheric turbulence by 2-μm Doppler Lidar[J].
Journal of Atmospheric and Oceanic Technology, 2005, 22(11): 1733-1747. DOI:10.1175/JTECH1815.1 ( 0) 0)
|
| [23] |
Chan P W and Hon K K. Performance of super high resolution numerical weather prediction model in forecasting terrain-disrupted airflow at the Hong Kong International Airport: Case studies[J].
Meteorological Applications, 2016, 23(1): 101-114. DOI:10.1002/met.2016.23.issue-1 ( 0) 0)
|
| [24] |
Hon K K and Chan P W. Sub-kilometer simulation of terrain-disrupted airflow at the Hong Kong International Airport-aviation applications and inter-comparison with LIDAR observations[C]. 16th Conference on Mountain Meteorology, 2014.
Hon K K and Chan P W. Sub-kilometer simulation of terrain-disrupted airflow at the Hong Kong International Airport-aviation applications and inter-comparison with LIDAR observations[C]. 16th Conference on Mountain Meteorology, 2014. (  0) 0)
|
| [25] |
Wassaf H S, Tabrizi A, Wang F Y, et al.. Atmospheric turbulence effects on near-ground wake vortex demise[C]. 13th Conference on Aviation, Range and Aerospace Meteorology, 2008.
Wassaf H S, Tabrizi A, Wang F Y, et al.. Atmospheric turbulence effects on near-ground wake vortex demise[C]. 13th Conference on Aviation, Range and Aerospace Meteorology, 2008. (  0) 0)
|
| [26] |
Chan P W. Generation of an eddy dissipation rate map at the Hong Kong International airport based on Doppler Lidar data[J].
Journal of Atmospheric and Oceanic Technology, 2011, 28(1): 37-49. DOI:10.1175/2010JTECHA1458.1 ( 0) 0)
|


